Abstract
Cell–cell adhesion in 2-D PZ-HPV-7 prostate epithelial and DU-145 prostate cancer cell aggregates (monolayers), synchronously and rapidly (within 30 s) formed in suspension in an ultrasound trap has been examined over 60 min. The intracellular distributions of the cadherin/catenin complex components for both cell lines were time-dependent and were clearly identifiable as early as 150 s following cell–cell contact in the trap, while equilibrium positions were reached within 60 min following cell–cell contact. The accumulation of E-cadherin at the cell–cell interface was greater for PZ-HPV-7 than for DU-145 cells over 60 min in the trap, with the apparent formation of adherens junctions over that time scale in PZ-HPV-7 but not in DU-145 cells. The amounts of F-actin, α-, β-, and γ-catenins recruited to the cell–cell interface of PZ-HPV-7 cells were on average 2.4 times higher than those of DU-145 cells. The ability of different cell types to spread along neighboring cells was 1.5-fold greater for the PZ-HPV-7 than for the DU-145 cells. These results, discussed also in the context of earlier studies of cell adhesion in an ultrasound trap, characterize a reduced adhesiveness of DU-145 cells compared to PZ-HPV-7 cells.
INTRODUCTION
Tumor cells are genetically unstable, and accumulation of mutations is one of the first steps during transformation. Some mutations include genes encoding cytoplasmic signaling molecules that modulate cell growth, cell adhesion, and gene expression (Lozano et al. Citation2003). Epithelial tumors account for the vast majority of human cancers. Differentiated epithelial cells are polarized, i.e., they exhibit tight cell–cell adhesion, cuboidal morphology, and distinct membrane domains (apical and basolateral). Benign tumors are hyperproliferative, but cells still have a differentiated morphology. Malignant tumors arise due to de-differentiation of benign tumors, a process involving loss of the morphological characteristics of epithelial cells mentioned above (Lozano et al. Citation2003). Since most cancers show decreased intercellular adhesiveness, attention has been focused on the E-cadherin/catenin complex and its association, via catenins, with the actin cytoskeleton as a possible prognostic and predictive marker of cancer development. Expression of E-cadherin and catenin proteins in malignant tumors is generally either lower (Ferlicot et al. Citation2004) or more heterogeneously distributed (Buda and Pignatelli Citation2004) than that in normal tissues.
Mutations in β-catenin that disrupt its binding to E-cadherin result in accumulation of cytosolic β-catenin, increased interaction of β-catenin with the transcription factor TCF, and enhanced transcription of β-catenin-regulated genes and tumorigenesis (Buda and Pignatelli Citation2004). Mutations in the gene that encodes α-catenin effectively inactivate E-cadherin function (Wheelock et al. Citation2001). In human tumors, reduced expression of α-catenin has been associated with gastric, colon, and prostate cancer (Nolet et al. Citation2000) and is significantly associated with the depth of tumor invasion (Buda and Pignatelli Citation2004). Reduced expression of γ-catenin has been reported in non-small cell lung cancer (Bremmes et al. Citation2002). Abnormalities in p120expression are common in adenomatous polyps and colon cancer (Ireton et al. Citation2002).
The expression of E-cadherin in prostate cancer is reduced compared to normal prostate tissue (Davies et al. Citation2000; Lu et al. Citation2005; Jaggi et al. Citation2005) but is rarely permanently lost (Chesire and Isaacs Citation2003); furthermore, the expression of both α-and β-catenins is also altered (Graff et al. Citation1995; Yang et al. Citation2005). The temporal development of the distribution of the cadherin/catenin complex in prostate or other cancer cell lines where that complex is impaired has not previously been studied. A genotypic and phenotypic analysis has been previously conducted on many prostate cell lines, with the purpose of providing meaningful comparison between similar cell lines held in different laboratories (Mitchell et al. Citation2000). Of these, epithelial ‘normal’ (PZ-HPV-7) and cancer (DU-145) cell lines were selected for study in the present work.
The rapid molecular responses of cells to contact have recently been examined using confluent monolayers of keratinocytes growing on a substratum (Zhang et al. Citation2005), S180 sarcoma cell doublets held together by micropipettes (Chu et al. Citation2004) and neural cell (Bazou et al. Citation2005a) and chondrocyte (Bazou et al. Citation2006) monolayers levitated in suspension in an ultrasound trap. In the latter two cases, cell–cell adhesion was examined on bringing the cells together synchronously, rapidly (within 30 s) and non-intrusively (Bazou et al. Citation2005b), free of the influences of solid substrata. Cells in 2-D monolayer in the ultrasound trap do not exhibit apical-basal polarity as they are not in contact in the z-axis with other cells or with the extracellular matrix (ECM); however, the extent to which cells exhibit planar cell polarization has not yet been established. Cell–ECM interactions that might alter the contact response are not explored here.
The trap is an ultrasound resonator where the acoustic pathlength in the cell suspension is a single half wavelength. The resonator has a pressure node plane halfway through the cell suspension and parallel to the transducer. The cell trap exploits the fact that particles in general experience an axial direct acoustic radiation force when in an ultrasound standing wave field. This force normally drives cells towards a pressure node. In an appropriately designed field (Bazou et al. Citation2005b) they then move, within that plane, to accumulate at the center of the field. The technique has provided insight to the role of particle/cell surface properties in determining aggregate morphology for latex particles (Spengler and Coakley Citation2003) and for cells (Coakley et al. Citation2004; Bazou et al. Citation2005a; Bazou et al. Citation2006). Application of the trap has enabled data, such as the intracellular temporal progression of F-actin, N-cadherin, and NCAM formation in neural cells to be extracted from a large (ca. 104) sample of cells (Bazou et al. Citation2005a); in contrast, the kinetics of those changes cannot be established in tissue since molecular distributions in most of the cells are already in the final state.
In the present study, we apply the ultrasound trap to establish and compare the temporal changes in the distribution of the cadherin/catenin complex and F-actin upon facilitation of cell–cell contact in epithelial prostate (PZ-HPV-7) and prostate cancer (DU-145) cell aggregates/monolayers. We explore the extent to which different morphological-and immunofluorescence-based indices provide internally consistent insights to cell adhesion and its molecular consequences.
MATERIALS AND METHODS
Culture of PZ-HPV-7 and DU-145 Cells
The human cell lines PZ-HPV-7 (derived from epithelial cells cultured from normal tissue of the peripheral zone of the prostate) and DU-145 (isolated from a lesion in the brain of a patient with metastatic carcinoma of the prostate) were obtained from the American Type Culture Collection (Rockville, MD, USA). Cell lines were maintained as replicative cultures at 37C under an atmosphere of 95% air and 5% CO2, in Ham's F-12 medium (Sigma, Cambridge, UK) supplemented with 10% fetal calf serum (PAA Laboratories, Austria) and 100 μ g/ml penicillin-streptomycin solution (Sigma, Cambridge, UK). The medium was changed every third day.
The protocol for cell harvesting was a modification of that described by Jiang et al. (Citation1995). Cells at the confluence phase were rinsed with 3 ml of N-2-hydroxyethylpiperazine-N′-2-ethanesulfonic acid (HEPES) Ca2+ and Mg2+-free buffered saline (HCMF) and then treated with 3 ml of Accutase (Innovative Cell Technologies, Inc.), a solution that contains mild collagenolytic and proteolytic enzymes (the names and concentrations of these enzymes are the company's proprietary information) for 15 min to release cells from the culture flask surface. Cells were filtered through a 40 μ m Nitex cell strainer (FALCON) to ensure a single cell suspension. Cells were then centrifuged at 600 g for 5 min, resuspended in HCMF containing 5 mM CaCl2, counted, and finally diluted to the desired concentration. The sample was introduced into an ultrasound trap at room temperature with a 2 ml sterile syringe (Plastipak, Becton Dickinson, UK). The acoustic field was then activated.
Ultrasound Trap
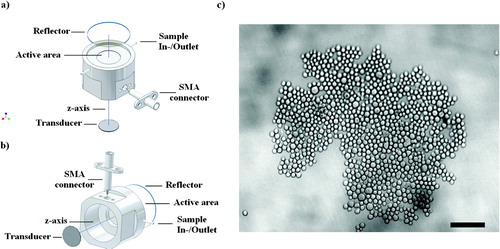
The in-house constructed trap employed in the present work had four layers: a transducer (Ferroperm, Kvistgard, Denmark) nominally resonant in the thickness mode at 1.5 MHz and mounted in a radially symmetric housing, a steel layer coupling the ultrasound to a one half wavelength (λ /2 or 0.5 mm depth, where λ is the wavelength of sound in water at 1.5 MHz) aqueous layer and a quartz acoustic reflector that provided optical access from above (, ). The outer diameter of the cylindrical steel body was 35 mm. The ‘sample-containing’ active area had a diameter of 18 mm. The disc transducer (12 mm diameter) was driven at 1.59 MHz. Its back electrode was etched to a 6 mm diameter circle so as to give a single central aggregate in a single half-wavelength chamber. The quartz glass acoustic reflector had a thickness of 1 mm (λ /4) so as to locate the single pressure node plane halfway through the sample volume. The piezoceramic transducer was driven from a function generator (HM 8138, HAMEG, Mainhausen, Germany) to generate a mechanical wave. The sound pressure amplitude (Po), estimated as described by Khanna et al. (Citation2003), was 0.54 MPa for the first 30 s of ultrasound initiation and subsequently reduced to 0.27 MPa for 30 s and 0.06 MPa (the level at which the acoustic radiation force just balanced the gravitational force on the aggregate and thus maintained the aggregate in suspension) for the remaining time, up to 55 min, of aggregate levitation.
Figure 1 (a) Schematic diagram of the cylindrical steel trap assembly, epi-microscope, sample loading, and ultrasound generation. Its main components were a 1.5 MHz disc transducer attached to a steel acoustic coupling layer, a sample volume, and a glass acoustic reflector. (b) Back view of the trap assembly. (Reproduced from Bazou et al. Citation2006, with permission of Taylor and Francis). (c) PZ-HPV-7 cell aggregate levitated in the trap for 5 min; pressure, 0.27 MPa. Cell aggregate morphology was closely packed, with little evidence of the hexagonal order that is typical of non-interacting spheres. Scale bar is 100 μ m.
Optical System
A fast, high-resolution CCD F-view camera (12-bit depth) mounted on an Olympus BX41M reflection epi-microscope via a 0.3× TV adapter (U–PMTVC) allowed observation in the direction of sound propagation (negative z-axis). The microscope was pre-focused on the trap's pressure nodal plane. Images were captured and processed using the analySIS 3.1 software (analySIS 3.1 user's guide).
Assay of Temporal Change in Cell Aggregate Packing by Measurement of Void Space
Images of cell aggregates suspended in the trap (cell concentration of 5 × 10⁵/ml) were captured () and processed using the analySIS 3.1 software. The areas of the voids (cell-free regions within the aggregate periphery) were outlined manually using the free-hand tool. The percentage of the void area in a field of view was calculated as follows: the void area after a certain time of ultrasound exposure (Av) was divided by the overall area of part of the aggregate in the field of view (Ap) under continuous microscopic observation. A void index (Av/Ap) was then calculated (Bazou et al. Citation2004).
Immunofluorescence
Non-sonicated (control) cells from each cell line (at a concentration of 3 × 10⁶/ml) were initially assayed. Cells were prepared as described above and incubated as suspension cultures for 1 h at 37C/5% CO2. A 100 μ l aliquot was then placed on a HistoBond (RA Lamb, UK) microscope slide and fixed with 90% ethanol. Samples were blocked at room temperature with goat serum (DAKO, Dorset, UK) at 1:20 dilution in PBS for 20 min and incubated with the primary antibody (E-cadherin (monoclonal anti-human; 5 μ g/ml; R and D Systems, Oxford, UK), α-, β-, or γ-catenins (monoclonal anti-human; 5 μ g/ml; BD Transduction Laboratories, UK)). After washing in PBS, samples were incubated with Alexa 594 conjugated anti-mouse IgG (5 μ g/ml, Molecular Probes, Inc., Eugene, OR) for 1 h. After further washing (× 3) the slides were mounted in Vectashield (Vector, UK). Staining of F-actin was performed in ethanol-fixed cells by adding 2U/ml of Phalloidin-Alexa 488 conjugate (Molecular Probes, Inc., Eugene, OR, USA). Samples were then incubated for 20 min in the dark at room temperature, washed (× 3) with PBS and mounted in Vectashield.
Cell suspensions (3 × 10⁶ cells/ml) were then placed in the trap and assayed following sonication. Aggregates of significant size (i.e., ca. 1 mm diameter) were formed within 30 s of ultrasound exposure and were held in the trap for 1 and 60 min. They were then slowly removed from the trap, placed on a slide, fixed with ethanol, and stained for α-, β-, or γ-catenins as described for control cells in suspension above. It is noted that, while samples were removed from the trap after 1 and 60 min of levitation, the immunofluorescent images correspond to the ‘real’ times of 2.5 and 61.5 min due to the time gap (typically 1.5 min) from termination of ultrasound to specimen fixation.
Dual labeling for E-cadherin and F-actin was performed as follows: fixed samples were blocked with goat serum as described above at room temperature and incubated with the primary antibody (monoclonal anti-E-cadherin) overnight at 4C. After washing in PBS, samples were incubated with Alexa 594 conjugated anti-mouse IgG for 1 h. After further washing (× 3), F-actin was labeled by adding 2U/ml of Phalloidin-Alexa 488 conjugate. The slides were incubated at room temperature in the dark, rinsed, and mounted in Vectashield. Dual-labeled slides were observed (Olympus BX61 epi-fluorescent microscope) with different filters, as appropriate for each stain. Each resulting pair of images was merged using the analysis 3.1 software. Experiments in which the secondary antibody (Alexa 594) was added to the cells without application of the primary antibody as well as the use of non-specific IgGs (5 μ g/ml; DAKO, Dorset, UK) on application of the secondary antibody, showed no non-specific antibody labeling (data not presented).
The integral intensity of the phalloidin labeling at the cell interface was quantified by placing a rectangle provided by the analySIS 3.1 software, to contain the interface of each of 20 randomly selected pairs of cells. The integral intensity of an image is defined for this purpose as the sum of all the intensities within the defined area multiplied by the pixel area. The integral intensity approach is used here as an indicator of change in the amount of the labeled molecule implicitly involved in the cadherin/catenin complex (Bazou et al. Citation2005a).
Measurements of Membrane Spreading
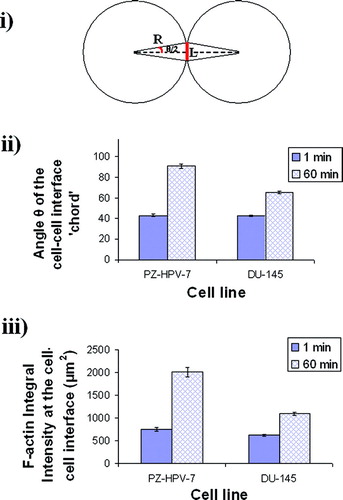
Estimates of the angle θ subtended by the F-actin staining region at the centers of a pair of interacting cells, were used to quantify the extent of membrane-membrane contact over different times. In contrast to measures of length of contact seam an angular index allows comparison of contact between cells of different radii (the mean diameters of PZ-HPV-7 and DU145 are 16 and 12 μ m, respectively). The angle was calculated as follows: The contact region was treated as a shared chord of ‘overlapping’ circles. It is appreciated that the cell perimeters are longer than those for perfect circles as cells have surface area in excess of that required to contain a spherical cell volume (a property necessary so that when a cell divides, the two resulting smaller volumes are each continuously covered by membrane). No geometrical allowance can therefore be made for the consequent departure from circular profiles as membrane spreading continues. Within that limitation it will be taken, for a ‘cell–cell contact chord’ L and cell radius R (), that Sin (θ/2), where θ is the angle subtended by the chord at the centre of the cell, is given byso that
and
Figure 2 i) Schematic diagram of an interacting cell doublet; L is the length of the F-actin staining region or ‘chord’ (drawn here as a straight line), R is the radius of the cells, and θ is the angle subtended by the chord at the center of the cell. ii) The angle θ of the ‘cell–cell interface chord’ for 20 randomly selected pairs of cells from a slide of each of quadruplicate experiments after 1 and 60 min of levitation in the trap, for both cell lines (error bars represent one standard error of the mean). iii) Integral intensity measurements of F-actin at the cell–cell interface of 20 randomly selected pairs of cells from a slide of each of quadruplicate experiments after 1 and 60 min of levitation in the trap, for both cell lines (error bars represent one standard error of the mean).
While the membrane dynamics and micromechanics at the end of contact regions are not known, it is reasonable to assume that, for cells, the ability to continue to increase the length of a chord depends, among other things, on both the surface density of the homophilic receptors and the local resistance of the membrane to deformation. Measurements of the cell–cell interface ‘chord’ were performed using analySIS 3.1 software. The angle θ was also measured from records of phalloidin stained F-actin in neural cells (Bazou et al. Citation2005a) and chondrocytes (Bazou et al. Citation2006) prepared for immunofluorescence as described both here and in the previous reports.
Scoring the Incidence of Different Categories of Distribution of Cadherin/Catenin-Complex Molecules in PZ-HPV-7 and DU-145 Cells
Five randomly selected immunofluorescent images (1 image from each of 3 experiments and 2 images from a fourth) were examined in order to identify the distribution of E-cadherin and α-, β-, and γ-catenins in both cell lines. A dominant distribution of a particular molecule, e.g., E-cadherin, was identified for PZ-HPV-7 cells and coded as PZE-cadDom. Its incidence for the 5 randomly selected fields of view was scored and summed (XPZDom). The dominant distribution of E-cadherin in DU-145 (DUE-cadDom) was then identified, counted, and summed as YDUDom. It emerged that almost all (ca. 98%) of the cells in the 5 fields of view for each cell line and each molecule fell into either one or other of the categories selected as above. is an exemplar 2 × 2 contingency table for data obtained as above.
Table 1 Exemplar 2 × 2 contingency table constructed for the identification and scoring of the distribution of E-cadherin (as well as α-, β-, and γ-catenins) in both cell lines
The different molecular distributions were scored for the two cell lines at 1 and 60 min. The total number of cells in the 5 images ranged from 98 to 277 for the different experiments. A χ2-test was performed at each time point to establish whether there was a significant difference between the frequencies of the selected molecular distributions between the two cell lines.
RESULTS
Aggregate Morphologies
Cells of both cell lines moved into the optically focused nodal plane of the USWT within 1 s of initiation of sonication, and a small aggregate had formed at the central region of the nodal plane 20 s later. Incoming single cells and dendritic small clusters formed strong contact instantly with the peripheral cells of the growing aggregate, i.e., they did not roll along the periphery. However, the short dendritic clusters rotated, without internal reorganization, about their first contact point with the main aggregate so that it developed a more closely packed form (). The void indices (Av/Ap) measured in single PZ-HPV-7 and DU-145 cell aggregates were similar (0.06 and 0.05, respectively). An aggregate was fully formed within 5 min of ultrasound exposure, as characterized by the absence of free single cells from the field of view ().
Membrane Spreading
Cell morphology change from a circular to a pentagonal/quadrilateral one occurred within the 60 min levitation period (). The ability of cells to spread was quantified by measuring the angle θ of the cell–cell interface ‘chord’ (). The angle increased by factors of 2.1 and 1.5 for PZ-HPV-7, and DU-145 cells, respectively (). There was no significant difference between the 1 min mean values of the angle θ of the cell–cell interface ‘chord’ for the two cell lines (Students t-test, P > 0.05), whereas P was < 0.05 for the 1 hr mean values.
Immunolabeling of Non-Sonicated Samples
Observations for all molecules (E-cadherin, F-actin, α-, β-, and γ-catenins) were based on separate experiments performed twice.
E-cadherin: E-cadherin in PZ-HPV-7 cells was concentrated mainly at the cell surface in the form of a homogeneous ring-type pattern ( and ) after 1 h in suspension culture. A low level of diffuse cytoplasmic staining was also observed. In DU-145 cells, E-cadherin staining was quite diffuse throughout the cells, while the ring-type pattern at the cell surface was granulated and less prominent than in PZ-HPV-7 cells ( and ).
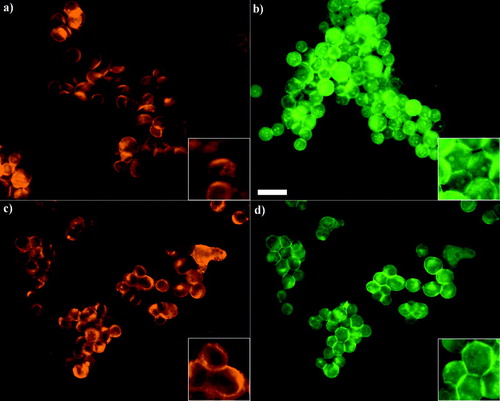
Figure 3 i) Representative micrographs and ii) their pseudo color images of the distribution of E-cadherin (a, pericellular staining; f, diffuse staining), F-actin (b, nuclear staining (arrows); g, cortical F-actin (arrows)), α-(c, perinuclear halo (arrows); h, diffuse staining), β-(d, discrete intracellular staining (arrows); i, diffuse staining) and γ-(e, discrete intracellular staining (arrows); j, diffuse staining) catenins in PZ-HPV-7 (a–e) and DU-145 (f–j) non-sonicated (control) cells after 1 h in suspension culture. Scale bar is 20 μ m.
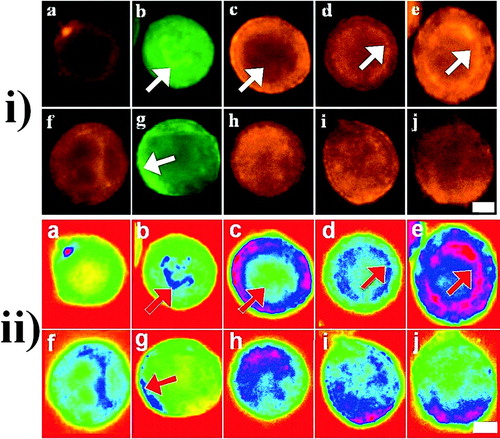
F-actin: The F-actin cytoskeleton of PZ-HPV-7 cells was prominent near the nuclear region of the cells ( and , arrow), whereas strong cortical F-actin signal was observed in DU-145 cells ( and , arrow).
α-, β-, and γ-catenins: α-catenin in PZ-HPV-7 cells was distributed around the rim of the cells, resulting in what Mitchell et al. (Citation2000) has described as a perinuclear halo, while less staining of the cytoplasm was observed ( and , arrow). β-and γ-catenins were distributed in small discrete intracellular regions 1–2 μ m from the cell surface, in a pattern that led to the formation of an intracellular ring ( and , , arrows). In contrast, α-, β-, and γ-catenins were quite diffuse throughout DU-145 cells ( and ).
Immunolabeling of Sonicated Samples
The distributions of all molecules (E-cadherin, F-actin, α-, β-, and γ-catenins) of cell aggregates levitated in the trap for 1 and 60 min were based on observations from separate experiments performed 4times.
E-cadherin: After 1 min of levitation in the trap, E-cadherin in PZ-HPV-7 cells exhibited a clear (in 93% of the cells examined) homogeneous ring-type distribution around the surface of the cells with little cytoplasmic staining (), while in DU-145 cells it had (in 97% of the cells examined) a granulated ring-type distribution at the surface of the cells and clearly showed the cytoplasmic staining () already shown in non-sonicated PZ-HPV-7 and DU-145 cells ( and and and ). After 1 h, E-cadherin in PZ-HPV-7 cells had accumulated at the cell–cell interface in a granular pattern (), suggestive of adherens junction formation. In contrast, in DU-145 cells E-cadherin had retained the ring-type pattern at the periphery of the cells, while a more intense staining was often not confined to a cell–cell contact region (); no indication (i.e., observation of grainy interface) of the formation of adherens junctions was observed in DU-145 cells. χ2-tests showed significant difference (P < 10− 5) between the frequencies of the different E-cadherin distributions in the two cell lines at 1 and 60 min.
Figure 4 Distribution of E-cadherin and F-actin in PZ-HPV-7 (a and b, respectively) and DU-145 (c, d) cells exposed to ultrasound for 1 min. PZ-HPV-7 cells showed a ring-type distribution of E-cadherin (a) and internal regions of high phalloidin stain (b, arrows). In contrast, DU-145 cells displayed a granulated ring-type E-cadherin distribution (c), while no high phalloidin internal regions were observed (d). Zoom-in images highlight the distribution pattern. Scale bar is 50 μ m.
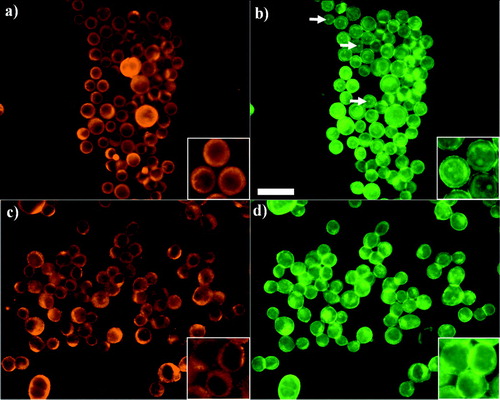
Figure 5 Distribution of E-cadherin and F-actin in aggregated PZ-HPV-7 (a and b, respectively) and DU-145 (c, d) cells levitated for 1 h. E-cadherin in PZ-HPV-7 cells has accumulated at the cell–cell interface in a granular pattern (a), possibly associated with the formation of adherens junctions, whereas the internal regions of high phalloidin stain, shown in the 1 min samples () are still present (b). DU-145 cells retained the ring-type pattern at the periphery of the cells, while a more intense staining was often not confined to a cell-cell contact region (c), while F-actin had clearly concentrated at the cell–cell interface (d) with no evidence of internal high phalloidin stain regions. Zoom-in images highlight the distribution pattern. Scale bar is 50 μ m.
F-actin: After 1 min in the trap, F-actin in both cell types had concentrated in a thin and short region at the cell–cell contact region (), and diffuse cytoplasmic staining was observed for both cell types. However, PZ-HPV-7 cells exhibited some internal regions of high phalloidin stain (, arrows), as was the case for control non-sonicated cells ( and , arrow). No difference was observed between non-sonicated cells and cells levitated in the trap for 1 min for both cell lines.
Following 1 h in the trap, F-actin in both cell types had clearly accumulated at the cell–cell interface, while the internal F-actin staining regions remained in PZ-HPV-7 cells (). The F-actin integral intensity at the cell–cell interface of PZ-HPV-7 and DU-145 cells increased by factors of 2.7 and 1.7, respectively. The increases at 1 and 60 min were significantly different for each line (P < 0.05) ().
α-, β-, and γ-catenins: After 1 min of ultrasound exposure, α-catenin in both cell types exhibited a diffuse distribution throughout the cells with some accumulation at the cell–cell interface (, ). After 1 h, α-catenin in both cell types had accumulated at the cell–cell interface, while an α-catenin-free nuclear region was clearly defined (, , arrows), as was the case for control non-sonicated PZ-HPV-7 ( and ) but not for control DU-145 cells ( and ). χ2-test showed no significant difference (P > 0.05) between the frequencies of the α-catenin distribution patterns in the two cell lines at 1 or 60 min. In contrast, the amount of α-catenin recruited at the cell–cell interface over 1 hr of ultrasound exposure was higher for the PZ-HPV-7 than the DU-145 cell line.
Figure 6 i) Distribution of α-catenin in PZ-HPV-7 (a, b) and DU-145 (c, d) cells aggregated for 1 (a, c) and 60 min (b, d). α-catenin in both cell types showed progressive accumulation at the contact interface. The arrows (c, d) show the cytoplasmic/nuclear α-catenin-free region in both cell types. Scale bar is 50 μ m. ii) Integral intensity measurements of α-catenin at the cell–cell interface of 20 randomly selected pairs of cells from a slide of each of quadruplicate experiments after 1 and 60 min of levitation in the trap, for both cell lines (error bars represent one standard error of the mean).
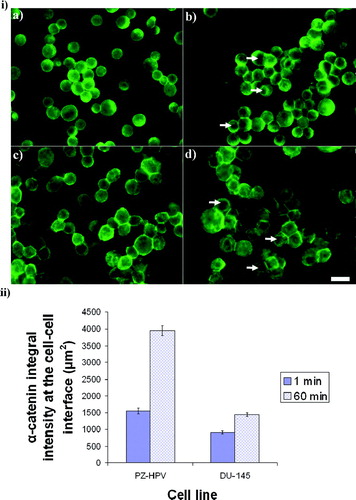
α-catenin in PZ-HPV-7 cells increased by a factor of 2.3 within 1 h of levitation in the trap, while in DU-145 cells it increased by a factor of 1.6. (These increases were significantly different (P < 0.05)) ().
β-and γ-catenins in PZ-HPV-7 cells exposed to ultrasound for 1 min were distributed around the rim of the cells, while the intracellular ring observed in non-sonicated samples ( and , , arrows) remained ( and ). A clear β-/γ-catenin-free nuclear/cytoplasmic region was observed ( and , arrows). After 1 h, β-and γ-catenins had accumulated at the cell–cell interface with little cytoplasmic staining; the intracellular ring was still present ( and ). In contrast, in DU-145 cells a diffuse cytoplasmic staining of β-and γ-catenins was observed after 1 min and 1 h of exposure (, and , ). Accumulation of labels at the cell–cell interface was also observed for both time points (, and , ). χ2-tests showed significant difference (P < 0.001) between the frequencies of the different β-and γ-catenins distributions in the two cell lines at 1 and 60 min.
Figure 7 i) Distribution of β-catenin in PZ-HPV-7 (a, b) and DU-145 (c, d) cells levitated for 1 min (a, c) and 1 h (b, d). β-catenin in PZ-HPV-7 cells was distributed around the rim of the cells (a), with progressive accumulation at the contact interface (b). The arrows in (a) show the cytoplasmic/nuclear β-catenin-free region. In contrast, in DU-145 cells a diffuse cytoplasmic staining of β-catenin was observed (c, d), also with some accumulation at the cell–cell interface over time (d). ii) Distribution of γ-catenin in PZ-HPV-7 (a, b) and DU-145 (c, d) cells exposed to ultrasound for 1 (a, c) and 60 min (b, d). No difference could be detected between the distribution patterns of γ-and β-catenins for both cell lines examined. Arrows in (a) show the cytoplasmic/nuclear γ-catenin-free region. iii) Integral intensity measurements of β-and γ-catenins at the cell–cell interface of 20 randomly selected pairs of cells from a slide of each of quadruplicate experiments after 1 and 60 min of levitation in the trap, for both cell lines (error bars represent one standard error of the mean). Scale bars are 50 μ m.
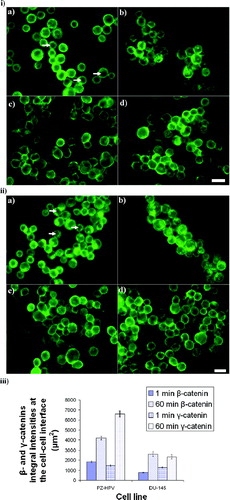
The integral intensity increased by factors of 2.3 and 3.3 for β-catenin and by factors of 4.5 and 2.6 for γ-catenin in PZ-HPV-7 and DU145 cells, respectively, as time increased from 1 to 60 min. (The increases of β and γ-catenins integral intensities with time for the two cell lines were significantly different (P < 0.05)) ().
DISCUSSION
Aggregate Morphology
Microscopic observations of aggregate growth in the trap showed no detectable difference in the production of closely-packed aggregates () for both cell lines. Strong interaction on contact might be expected here as both cell lines express E-cadherin ( and , ) (Bazou et al. Citation2004).
Measurements of Membrane Spreading and Actin Reorganization
Differences in the ability of the two cell types to spread over neighboring cells were reflected in the greater values of θ and amount of F-actin observed in ‘normal’ PZ-HPV-7 cells compared with malignant DU-145 cells after 1 h in the trap (). While both cell lines showed progressive accumulation of F-actin at the cell–cell interface within 1 h of levitation in the trap, PZ-HPV-7 cells exhibited strong localized intracellular regions of F-actin staining (as for control, non-sonicated cells), possibly associated with the perinuclear region (Ñeco et al. Citation2003). In other studies, single human breast cancer cells have shown 30% less F-actin and increased deformability compared to normal cells (Gück et al. Citation2005), while increased G-to F-actin ratios have been reported in malignant human keratinocytes (Katsantonis et al. Citation1994) and in tissue sections of malignant prostate glands (Hemstreet et al. Citation2000). summarizes the prostate cell line results together with data obtained from earlier studies of neural (Bazou et al. Citation2005a) and chondrocyte (Bazou et al. Citation2006) cell–cell adhesion in an ultrasound trap. We note that higher void index values reflect a more open aggregate structure that results from a greater likelihood of rapid strong contact formation on initial contact of a cell with an aggregate (Bazou et al. Citation2005a). The neural and DU-145 cell contact seams spread most and least extensively, respectively. Similarly, F-actin staining intensity at the cell–cell interface was highest for neural cells and least for DU-145 cells and chondrocytes (). The difference in the integral intensities of the latter two systems is small but statistically significant different (two-tailed two sample t-test P < 0.005). Increased recruitment of F-actin to the cell–cell contact interface coincides with a strengthening of cadherin-mediated adhesion (Tepass, Citation2002); therefore, the lower amount of F-actin at the cell–cell contact interface, shown here for DU-145 cells, is consistent with the reduced capacity of these cells to increase the length of the interfacial contact region. In general, shows that the different indices of cell adhesion employed here are internally consistent and suggest a hierarchy of cell adhesiveness.
Table 2 Differences in the angle θ (± standard error of the mean) made by the cell–cell interface ‘chord’, F-actin integral intensity (μ m2) of Phalloidin-Alexa Fluor 488 (± standard error of the mean) and void index (Bazou et al. Citation2004) of various cell systems (Bazou et al. Citation2005a, Citation2006) analysed after 1h* of cell–cell contact initiation in the ultrasound trap
The overall cytoskeleton and cell shape remodeling results presented here for both cell lines are consistent with the recent report of Chu et al. (Citation2004). These authors showed that (i) after 30 min, F-actin had strongly accumulated at the linear interface of doublets of sarcoma 180 cells formed in suspension and (ii) that the force required to separate cells in a doublet formed by bringing cells, each supported by a micropipette, into contact for a period of 60 min increased rapidly over the first 30 min and more slowly thereafter. This force was primarily determined by the amount of E-cadherin expressed at the cell surface. A calculation, by the present authors, of the mean value (n = 3) of θ of the cell–cell ‘chord’ of E-cadherin-expressing cells in the work of Chu et al. (Citation2004) was on average 91 (n = 3), in agreement with the value reported above in for the highly E-cadherin expressing PZ-HPV-7 cells.
Intracellular Distribution of the Cadherin/Catenin Complex
Published studies conducted in many different tissue sections and confluent monolayers of cancer cells, including prostate cancer cells, have reported an increased diffuse cytoplasmic and reduced membranous distribution of E-cadherin (Sarrio et al. Citation2004; Torres et al. Citation2005), α-(Buda and Pignatelli, Citation2004; Winjhoven et al. Citation2004; Aaltoma et al. Citation2004), β-, and γ-(Davies et al. Citation2000; Winjhoven et al. Citation2004; Aaltoma et al. Citation2004; Shiina et al. Citation2005; Misaki et al. Citation2005) catenins. The results reported here on E-cadherin ( and ), α-(), β-() and γ-catenins () distributions in DU-145 cells levitated in the trap are in agreement with the above studies. Since the distribution of the cadherin/catenin complex observed here for PZ-HPV-7 and DU-145 cells is as that described elsewhere for tissue sections or confluent monolayers, it is reasonable to assume that the molecular distributions here have reached their equilibrium states within 60 min of initiation of contact in the ultrasound trap.
Differences in the amounts of catenins in the two cell lines were clear even in samples recovered from the trap after 60 s of initiation of cell–cell contact (i.e., 150 s to cell fixation). The 2.7-fold greater amount of α-catenin at the plasma membrane in 1 h for PZ-HPV-7 compared to DU-145 cells is similar to the 2.0-fold difference in F-actin at the same time point ( and ). This agreement might be expected as α-catenin performs the F-actin binding role in the cadherin/catenin complex. The amounts of β-and γ-catenins at the cell–cell interface of PZ-HPV-7 cells () at 1 h were 1.6 and 2.8 times higher than those of DU-145 cells. The β-catenin at the cell membrane, as shown here for PZ-HPV-7 cells (, ), reflects the function of cell adhesion, whereas that found in the cytoplasm and nucleus, as shown for DU-145 cells (, ), functions as a mediator of wnt signal transduction (Ferlicot et al. Citation2004; Misaki et al. Citation2005). Cytoplasmic and nuclear γ-catenin can interact with the same transcriptional factors as β-catenin (Gooding et al. Citation2004; Shiina et al. Citation2005).
The high incidence (a 2-D aggregate with a diameter of 1 mm contains approximately 3,500 cells) of synchronously occurring cell–cell interactions in the trap provided statistically well-defined measures of process development (e.g., the progression of the length of cell–cell contact in monolayers or the distribution of F-actin or E-cadherin and catenins). The high number of interactions also allowed representative molecular distributions to be identified. Analysis of the differences in incidence of these patterns in the two cell lines gave values of χ2 (one degree of freedom) of 427 and 160 for E-cadherin and β-catenin, respectively. The probabilities associated with these high values of χ2 are vanishingly small since, for example, P = 10− 5 when χ2 = 20. The results show that aggregation in an ultrasound trap can detect the rapid transition from pre-contact intracellular molecular distributions to those typical of cells in the post-contact state. In future work we intend to continuously monitor the temporal changes of localization of adhesion molecules by, for example, expression of fluorescently tagged proteins, thus identifying the kinetics of the progression to final equilibrium states.
In conclusion, the ability of the different cell types to spread over neighboring cells was greater for the PZ-HPV-7 than for the DU-145 cells. PZ-HV-7 cells recruited more α-, β-, and γ-catenins, as well as F-actin, compared to DU-145 cells during 60 min of levitation in the trap. These results are consistent with a conclusion that DU-145 cells are less adhesive than PZ-HPV-7 cells. The ultrasound trap allowed the clear identification of differences in the amounts and distributions of molecules of the cadherin/catenin complex in the two cell types as early as 150 s following cell–cell contact.
REFERENCES
- Aaltomaa S, Lipponen P, Karja V, Lundstedt S, Lappi J, Kosma V M. The expression and prognostic value of alpha-, beta-, and gamma-catenins in renal cell carcinoma. Anticancer Res 2004; 24: 2407–2413, [INFOTRIEVE], [CSA]
- Soft Imaging System GmbH, MunsterGermany, analySIS 3.1 user's guide
- Bazou D, Coakley W T, Meek K M, Yang M, Pham D T. Characterisation of the morphology of 2-D particle aggregates in different electrolyte concentrations in an ultrasound trap. Colloid Surface A 2004; 243: 97–104, [CROSSREF], [CSA]
- Bazou D, Dowthwaite G P, Khan I M, Archer C W, Ralphs J R, Coakley W T. Gap junctional intercellular communication and cytoskeletal organisation in chondrocytes in suspension in an ultrasound trap. Mol Membr Biol 2006, in press[CSA]
- Bazou D, Foster G A, Ralphs J R, Coakley W T. Molecular adhesion development in a neural cell monolayer forming in an ultrasound trap. Mol Membr Biol 2005a; 22: 229–240, [INFOTRIEVE], [CROSSREF], [CSA]
- Bazou D, Kuznetsova L A, Coakley W T. Physical environment of 2-D animal cell aggregates formed in a short pathlength ultrasound standing wave trap. Ultrasound Med Biol 2005b; 31: 423–430, [INFOTRIEVE], [CROSSREF], [CSA]
- Bremnes R M, Veve R, Hirch F R, Frankli W A. The E-cadherin cell–cell adhesion complex and lung cancer invasion, metastasis, and prognosis. Lung Cancer 2002; 36: 115–124, [INFOTRIEVE], [CROSSREF], [CSA]
- Buda A, Pignatelli M. Cytoskeletal network in colon cancer: from genes to clinical application. Int J Biochem Cell Biol 2004; 36: 759–765, [INFOTRIEVE], [CROSSREF], [CSA]
- Chesire D R, Isaacs W B. β-catenin signalling in prostate cancer: an early perspective. Endocr Relat Cancer 2003; 10: 537–560, [INFOTRIEVE], [CROSSREF], [CSA]
- Chu Y S, Thomas W A, Eder O, Pincet F, Perez E, Thiery J P, Dufour S. Force measurements in E-cadherin-mediated cell doublet reveal rapid adhesion strengthened by actin cytoskeleton remodelling through Rac and Cdc42. J Cell Biol 2004; 167: 1183–1194, [INFOTRIEVE], [CROSSREF], [CSA]
- Coakley W T, Bazou D, Morgan J, Foster G A, Archer C W, Powell K, Borthwick K AJ, Twomey C, Bishop J. Cell–cell contact and membrane spreading in an ultrasound trap. Colloid Surface B: Biointerfaces 2004; 34: 221–230, [CROSSREF], [CSA]
- Davies G, Jiang W G, Mason M D. Cell–cell adhesion molecules and signalling intermediates and their role in the invasive potential of prostate cancer cells. J Urol 2000; 163: 985–992, [INFOTRIEVE], [CROSSREF], [CSA]
- Ferlicot S, Vincent-Salomon A, Medioni J, Genin P, Rosty C, Sigal-Zafrani B, Freneaux P, Jouve M, Thiery J P, Sastre-Garau X. Wide metastatic spreading in infiltrating lobular carcinoma of the breast. Eur J Cancer 2004; 40: 336–341, [INFOTRIEVE], [CROSSREF], [CSA]
- Gooding J M, Yap K L, Ikura M. The cadherin-catenin complex as a focal point of cell adhesion and signalling: new insights from three-dimensional structures. BioEssays 2004; 26: 497–511, [INFOTRIEVE], [CROSSREF], [CSA]
- Graff J R, Herman J G, Lapidus R G, Chopra H, Xu R, Jarrard D F, Isaccs W B, Pitha P M, Davidson N E, Baylin S B. E-cadherin expression is silenced by DNA hypermethylation in human breast and prostate carcinomas. Cancer Res 1995; 55: 5195–5199, [INFOTRIEVE], [CSA]
- Gück J, Schinkinger S, Lincoln B, Wottawah F, Ebert S, Romeyke M, Lenz D, Erickson H M, Ananthakrishnan R, Mitchell D, Kas J, Ulvick S, Bilby C. Optical deformability as an inherent cell marker for testing malignant transformation and metastatic competence. Biophys J 2005; 88: 3689–3698, [CROSSREF], [CSA]
- Hemstreet G F, Bonner R A, Hurst R E, Bell D, Bane B L. Abnormal G-actin content in single prostate cells as a biomarker of prostate cancer. Cancer Detect Prev 2000; 24: 464–472, [INFOTRIEVE], [CSA]
- Ireton R C, Davis M A, van Hengel J, Mariner D J, Barnes K, Thoreson M A, Anastasiadis P, Matrisian L, Bundy L M, Sealy L, Gilbert B, van Roy F, Reynolds A B. A novel role for p120 catenin in E-cadherin function. J Cell Biol 2002; 159: 465–476, [INFOTRIEVE], [CROSSREF], [CSA]
- Jaggi M, Rao P S, Smith D J, Wheelock M J, Johnson K R, Hernstreet G P, Balaji K C. E-cadherin phosphorylation by protein kinase D1/protein kinase Cμ is associated with altered cellular aggregation and motility in prostate cancer. Cancer Res 2005; 65: 483–492, [INFOTRIEVE], [CROSSREF], [CSA]
- Jiang W G, Hiscox S, Hallett M B, Horrobin D F, Mansel R E, Puntis M CA. Regulation of the expression of E-cadherin on human cancer cells by gamma-linoleic acid. Cancer Res 1995; 55: 5043–5048, [INFOTRIEVE], [CSA]
- Katsantonis J, Tosca A, Koukouritaki S B, Theodoropoulos P A, Gravanis A, Stournaras C. Differences in the G/total actin ratio and microfilament stability between normal and malignant human keratinocytes. Cell Biochem Funct 1994; 12: 267–274, [INFOTRIEVE], [CROSSREF], [CSA]
- Khanna S, Amso N N, Paynter S J, Coakley W T. Contrast agent bubble and erythrocyte behaviour in a 1.5 MHz standing ultrasound wave. Ultrasound Med Biol 2003; 29: 1463–1470, [INFOTRIEVE], [CROSSREF], [CSA]
- Lozano E, Betson M, Braga V VM. Tumour progression: small GTPases and loss of cell–cell adhesion. BioEssays 2003; 25: 452–463, [INFOTRIEVE], [CROSSREF], [CSA]
- Lu Q, Dobbs L J, Gregory C W, Lanford G W, Revelo M P, Shappell S, Chen Y H. Increased expression of delta-catenin/neural plakophillin-related armadillo protein is associated with the down-regulation and redistribution of E-cadherin and p120(ctn) in human prostate cancer. Hum Pathol 2005; 36: 1037–1048, [INFOTRIEVE], [CROSSREF], [CSA]
- Misaki K, Marukawa K, Hayashi Y, Fukusato T, Minamoto T, Hasegawa M, Yamashita J, Fujisawa H. Correlation of gamma-catenin expression with good prognosis in medulloblastomas. J Neurosurg 2005; 102: 197–206, Suppl. S[INFOTRIEVE], [CSA]
- Mitchell S, Abel P, Stamp M, Lalani E N. Phenotypic and genotypic characterisation of commonly used human prostatic cell lines. Br J Urol 2000; 85: 932–944, [CSA]
- Ñeco P, Giner D, Frances M D, Viniegra S, Gutierrez L M. Differential participation of actin-and tubulin-based vesicle transport systems during secretion in bovine chromaffin cells. Eur J Neurosci 2003; 18: 733–742, [CROSSREF], [CSA]
- Nollet F, Kools P, van Roy F. Phylogenetic analysis of the cadherin superfamily allows identification of six major subfamilies besides several solitary members. J Mol Biol 2000; 299: 551–572, [INFOTRIEVE], [CROSSREF], [CSA]
- Sarrio D, Perez-Mies B, Hardisson D, Moreno-Bueno G, Suarez A, Cano A, Martinez-Perez J, Gamallo C, Palacios J. Cytoplasmic localization of p120ctn and E-cadherin loss characterize lobular breast carcinoma from preinvasive to metastatic lesions. Oncogene 2004; 23: 3272–3283, [INFOTRIEVE], [CROSSREF], [CSA]
- Shiiina H, Breault J E, Basset W W, Enokida H, Urakami S, Li L C, Okino S T, Deguchi M, Kaneuchi M, Terashima M, Yoneda T, Shigeno K, Carroll P R, Igawa M, Dahiya R. Functional loss of the γ-catenin gene through epigenetic and genetic pathways in human prostate cancer. Cancer Res 2005; 65: 2130–2138, [CROSSREF], [CSA]
- Spengler J F, Coakley W T. Ultrasonic trap to monitor morphology and stability of developing microparticle aggregates. Langmuir 2003; 19: 3635–3642, [CROSSREF], [CSA]
- Tepass U. Adherens junctions: new insight into assembly, modulation, and function. BioEssays 2002; 24: 690–695, [INFOTRIEVE], [CROSSREF], [CSA]
- Torres L N, Matera J M, Vascocellos C H, Avanzo J L, Hernandez-Blazquez F J, Dagli M LZ. Expression of connexins 26 and 43 in canine hyperplastic and neoplastic mammary glands. Vet Pathol 2005; 42: 633–641, [INFOTRIEVE], [CROSSREF], [CSA]
- Wheelock M J, Soler A P, Knudsen K A. Cadherin junctions in mammary tumours. J Mammary Gland Biol Neoplasia 2001; 6: 275–285, [INFOTRIEVE], [CROSSREF], [CSA]
- Winjhoven B PL, Tucker E T, Dinjens W NM, Tilanus H W, Pignatelli M. Biochemical analysis and subcellular distribution of E-cadherin-catenin in adenocarcinomas of the gastro-oesophageal junction. Anticancer Res 2004; 24: 1369–1376, [CSA]
- Yang X Z, Chen M W, Terry S, Vacherot F, Chopin D K, Bemis D L, Kitajewski J, Benson N C, Guo Y L, Buttyan R. A human-and male-specific protocadherins that acts through the Wnt signalling pathway to induce neuroendocrine transdifferentiation of prostate cancer cells. Cancer Res 2005; 65: 5263–5271, [INFOTRIEVE], [CROSSREF], [CSA]
- Zhang J K, Betson M, Erasmus J, Zeikos K, Bailly M, Cramer L P, Braga V MM. Actin at cell–cell junctions is composed of two dynamic and functional populations. J Cell Sci 2005; 118: 5549–5562, [INFOTRIEVE], [CROSSREF], [CSA]