
ABSTRACT
We have developed a new device called the dynamic cell, whereby the twist angle and cell thickness of a liquid crystal cell can be dynamically varied. For a twist angle larger than 90°, there occurs a breaking of anchoring at a certain threshold cell thickness. This structural transition converts the super-twisted state to a normal twisted state by flipping the surface director by 180°. A disclination loop separates the normal twisted region from the super-twisted region. By controlling the twist and thickness, we can stabilize this loop and calculate its line tension.
KEYWORDS:
Introduction
Disclination lines have been studied since soon after the discovery of liquid crystals Citation[1]. However, there is still much to learn about them, particularly the structure of the defect core. Although there have been theories as to the structure of the core Citation[2], they are difficult to verify experimentally. One way to probe this structure is by measuring the line tension of a disclination line. Previously, the line tension has been deduced from the thermal fluctuation of disclinations Citation[3] and by observing the restoring force of a stretched disclination line Citation[4]. However, in order to study disclination lines at equilibrium, we must be able to create them in a controlled way. In a nematic, one way to create a twist disclination is by preparing a planar cell whose substrates' easy axes are twisted by 90° with respect to each other Citation[5]. We build on this idea by adding control of the thickness of the cell. Also, by using a curved substrate, we are able to generate disclination loops and control their size. By balancing the twist elastic energy of the liquid crystal with the line tension of the disclination, we can stabilize the loop. We can then calculate the line tension of the disclination. Probing the line tension of the disclination near the nematic-isotropic transition may help to shed some light on the structure of the defect core.
Materials and methods
The dynamic cell is a homemade cell with variable twist angle and cell thickness. The thickness can be varied by a motorized translating stage with a precision of 100 nm. The relative thickness is measured using a capacitance sensor with a resolution of 100 nm. The absolute thickness is obtained by measuring transmission through the cell with crossed polarizers while increasing the thickness from ∼1 µm to ∼20 µm Citation[6]. The twist angle is varied using a motorized rotating stage attached to the lower substrate holder. The angle can be changed with an absolute precision of 1° and a resolution of 0.001°. The absolute twist angle is found by measuring the transmission through the cell. The angle of alignment is marked on the substrates prior to installation in the dynamic cell, and the substrates are aligned by eye as close as possible. Then, the crossed polarizers are rotated until the transmission is minimized. Then the bottom substrate is rotated, also until transmission is at a minimum. This process is repeated until there is no detectable change in transmission. At this point, the twist angle is 0°, with a precision of 1°, due to the resolution of the polarizer angle Citation[6].
The temperature is controlled using a water heating system. Water at controlled temperature is pumped through channels in two aluminum holders, one for each substrate. The substrates were treated with two different kinds of materials, both of which yield planar anchoring. The flat substrate is 25 mm × 25 mm square. The curved substrate is 25 mm in diameter, with a focal length of 1300 mm. The curvature is 1.919 × 10⁻⁶ m−1. The curved substrate was spin coated with PI-2555, a polyimide. This substrate was then aligned by manual rubbing. This substrate has ‘strong’ anchoring. The flat substrate was spin coated with SD1 Citation[7], an azo-dye which was photoaligned by exposure to linearly polarized UV light of intensity 6 mW/cm2 for 5 minutes. Since this substrate has ‘weak’ anchoring, compared to the PI coated curved substrate, the anchoring will break on this substrate as shown below.
We assume a uniformly twisted cell with thickness d and the natural twist angle ψ (by which the easy axes of the substrates are rotated). Assuming the photoaligned substrate has anchoring energy W and denoting the angular deviation at the surface from the easy direction by φ in the Rapini-Papoular form, we can write the free energy per unit area as
(1)
As the thickness decreases, the deviation angle increases. The equilibrium angle satisfies
(2)
(3) which indicates the balance of bulk torque and the torque due to the surface anchoring. Eq.(3) is rewritten in a dimension-less form as
(4) with de = K2/W being the extrapolation length.
When , there is only one solution for all de/d, but when
, there are up to three solutions depending on the value of de/d. For large enough de/d, there are three solutions, of which the smallest φ gives the most stable solution. As d decreases, it reaches a threshold thickness where φ makes a jump from the smallest to the largest. This is the anchoring breaking. The threshold thickness satisfies
(5)
Substituting this equation in the above, we obtain
(6)
Solving this equation for a given twist angle, and using the solution, one obtains de/dth. Since the right hand side is always negative, φth must be larger than π/4.
After the substrates were installed in their holders, the cell was filled with 5CB. To break the anchoring, first the cell is twisted past 90°. Then the cell thickness is decreased until the anchoring breaks. The curved geometry causes the anchoring to break at the center of the cell, where the thickness is at a minimum. When the anchoring breaks, a normal twisted region forms in the super-twisted cell. The break can be seen due to the formation of a rapidly growing disclination loop around the normal twisted region. The disclination loop energy is found by stabilizing the loop. A stable loop is obtained by setting the twist angle to 92° and increasing the thickness until the loop is stable.
The disclination line tension I can be calculated from the stable loop radius Citation[8]. The total free energy in the broken surface anchoring state with a disclination loop can be written as the sum of the elastic energies from the twisted domains, separated by the disclination, and the energy due to the disclination line
(7) where Fe(R, ψ) denotes the twist elastic energy for a circular domain of radius R and the twist angle ψ. Rm is the size of the entire system, Rl is the radius of the loop, ψS, R are the super twist angle and normal twist angle and I is the line tension. Assuming the radius of curvature of the curved cell is much larger than the cell thickness, the elastic energy can be approximately written as
(8) where γ is the curvature of the curved substrate and d0 is the minimum thickness of the cell at the center.
We can then take set the derivative to zero to find the stable radius
(9)
(10)
Let . Substituting, we obtain
(11)
Finally, we obtain the stable loop radius
(12)
The loop radius can yield the line tension by the equation
(13)
Results and discussion
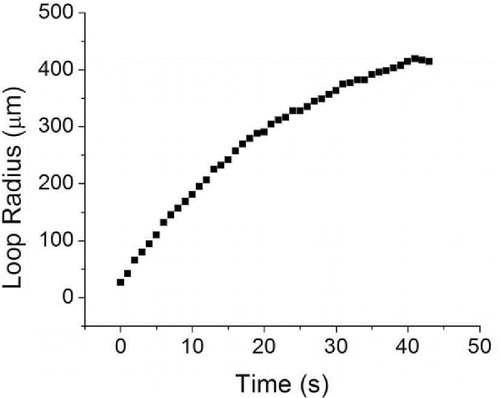
We measured the growth of a disclination loop upon nucleation, as shown in .
Figure 1. Schematic diagram of the dynamic cell. Motorized translating and rotating stages hold the top and bottom substrates. White light is used to observe the cell, while a HeNe laser is used to measure transmission.
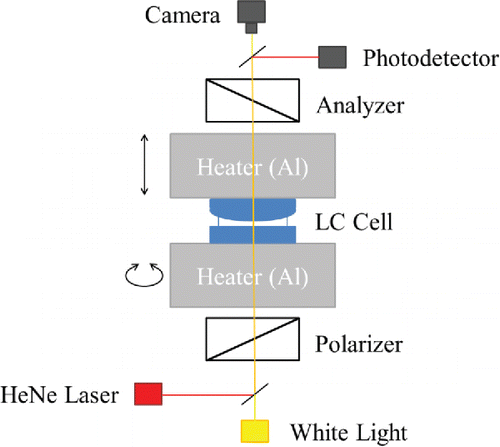
Figure 2. The dynamic cell (a) with and (b) without a defect loop. The colored rings are due to the curved geometry of the cell. The black marks were drawn on the substrates as a guide for monitoring the twisted states.
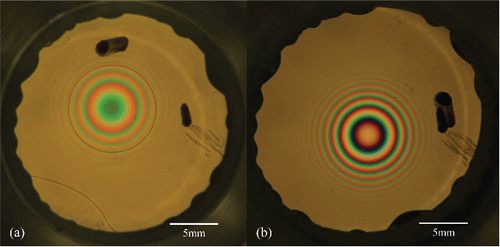
Figure 3. Growth of a disclination loop after nucleation.
The initial radius is the radius of nucleation, which can be calculated by the equation:
(14) where φS, R are the deviations from the easy axis in the super twisted and normal twisted states. This growth can be reversed by increasing the thickness. and show the nucleation and growth of a defect loop at about 1 µm, followed by the loop shrinking after the thickness is increased to about 20 µm. By finding an equilibrium thickness between 1 and 20 µm, the loop can be brought to a stable radius.
Figure 4. Nucleation and shrinking of a defect loop at different cell thickness.
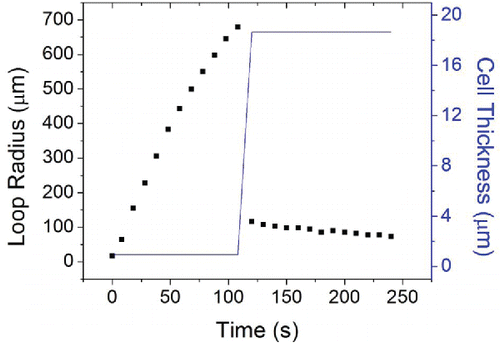
Figure 5. Growth and shrinking of a defect loop: (a) before increasing the thickness; (b) immediately after increasing the thickness, the loop shrinks due to flow; (c) loop shrinks due to the line tension.
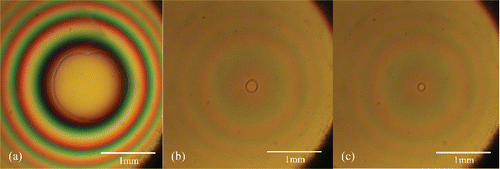
Figure 6. Disclination line tension as a function of temperature.
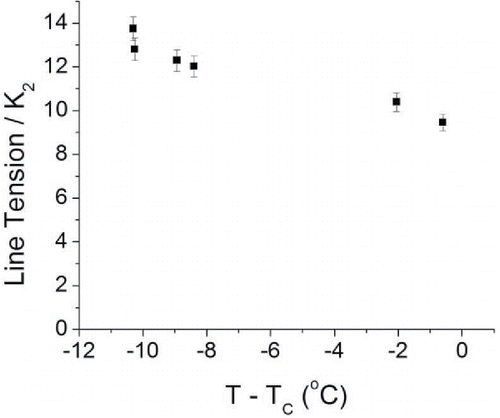
We measured the disclination line tension as a function of temperature, up to the nematic-isotropic transition. The line tension approximately scales as the twist constant, and is of the same order as the twist elasticity for 5CB. This agrees with the equation derived by de Gennes Citation[9] for the line tension of a disclination:
where m is the defect charge (|m| = 1/2 here), R is roughly the cell thickness, rc is the radius of the defect core and σc is the energy of the core. The line tension decreases a little faster than the twist constant as it approaches the transition temperature. Provided that the core can be viewed as a region of depressed orientation order, this behavior can be considered as coming from the contribution of the core.
Conclusion
We were able to create disclination loops by breaking the surface anchoring of 5CB aligned by SD1. By stabilizing these loops, we were able to measure their line tension. We measured the line tension at temperatures near the nematic-isotropic transition. We found that the line tension is of the same order as the elasticity, and that it decreases as the temperature approaches the nematic-isotropic transition. Both of these results agree with a simple model of the line tension. In future experiments, we will conduct a more thorough investigation, enabling a comparison to more subtle theories of line tension, especially of the structure of the defect core.
References
- Friedel, G. (1922). Ann. Phys. (Paris), 18, 273.
- Schopohl, N., & Sluckin, T. J. (1987). Phys. Rev. Lett., 22, 2582.
- Mertelj, A., & Čopič, M. (2004). Phys. Rev. E, 69, 021711.
- Smalyukh, I. I., Kuzmin, A. N., Kachynski, A. V., Prasad, P. N., & Lavrentovich, O. D. (2005). Appl. Phys. Lett., 86, 021913.
- Geurst, J. A., Spruijt, A. M., & Gerritsma, C. J. (1975). J. Phys. (Paris), 36, 653.
- Yeh, P., & Gu, C. (1999). In: Optics of Liquid Crystal Displays, Chapter 4, Page 215, John Wiley and Sons: New York.
- Chigrinov, V., Muravski, A., & Kwok, H. S. (2003). Phys. Rev. E, 68, 061702.
- Culbreath, C. (2015). Ph.D. thesis, Kent State University.
- de Gennes, P. G., & Prost, J. (1974). The Physics of Liquid Crystals, Oxford: Clarendon.