
ABSTRACT
Fringe-field switching (FFS) liquid crystal displays (FFS-LCDs) have excellent properties such as a wide viewing angle, high definition, and a low voltage drive. However, FFS-LCDs have a problem, wherein, the display quality deteriorates easily. Even though the asymmetrical electrode structure in an FFS-LCD is considered to be the cause, this problem is not completely understood. Finite-element-method (FEM) simulation studies show that the resistivities of all the materials (a liquid crystal layer, an alignment layer, an insulating layer) that constitute the LCD have an influence.
1. Introduction
Fringe-field switching (FFS) [Citation1, Citation2] mode is a display mode with a homogeneous alignment that is used in high-value-added liquid crystal (LC) displays (LCDs) including smart phones and high definition monitors. FFS-LCDs have excellent properties including a wide viewing angle and aperture ratio, and a low voltage drive compared to the in-plane switching(IPS) LCDs [Citation3] or the other LCDs. However, FFS-LCDs have a problem, wherein, the display quality deteriorates easily.
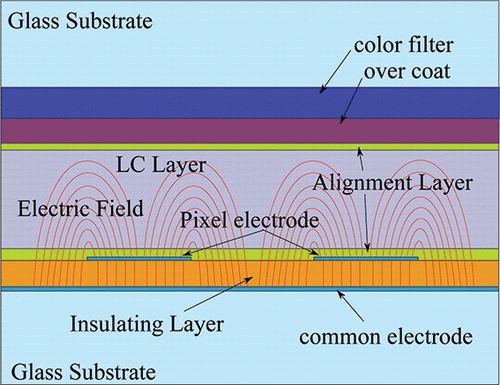
As illustrated in , a layered structure in which a pixel electrode (PE) and a common electrode (CE) sandwich an insulating layer is a structural feature of the FFS-LCD. The insulating layer and the alignment layer are made of SiNx and polyimide (PI), respectively. The PE is patternized in a comb shape and the area of the CE is large. An electric field applied to the liquid crystal layer (LC-L) of this asymmetrical structure causes electrical asymmetry between the PE and the CE; i.e., as the electrode areas of the PE and the CE differ, the field strengths near the electrodes also differ. Further, the paths of the electrical flux lines vary in the areas of the PE and the CE, and an electric potential arises owing to the differences in the chemical potentials of the materials. As a result of the differences in the chemical potentials of the materials, the interface forms an electric double layer. In accordance with the electrical double layer, a residual DC (RDC) is caused and the electrical stress owing to the RDC affects the driving forces of the various chemical and physical changes such as the oxidation-reduction reactions or the diffusion phenomena, in the material. Thus, this electrical asymmetry is considered to be one of the causes for the deterioration of the display quality of the FFS-LCD.
Figure 1. Schematic of the FFS-LCD.
The polarization of an electric charge occurs in the LCD, if a DC bias voltage (DCV) is applied to the LC-L between the PE and CE. An asymmetrical DCV causes a flicker phenomenon owing to the RDC, which degrades the display quality. The flicker phenomenon is an LCD failure owing to periodical transmittance changes. LCD manufactures often consider this flicker phenomenon as a serious problem and it is often called a flicker RDC or a DC-type image sticking. However, the relationship between the deterioration of the display quality and the electrical properties is not known, thus far. A study of the relationship between the polarization by a flexoelectric effect [Citation5] and the flicker phenomenon has been reported [Citation4, Citation6–8]. However, in an FFS-LCD, polarization is caused by various factors.
We conducted an (finite-element-method)FEM simulation study on the electrical properties of the FFS-LCD in order to study the relationship between the material properties and the deterioration of the display quality, such as the flicker phenomenon. We used COMSOL Multiphysics for the FEM simulation study. For the material properties, the resistivities of the LC-L, the PI layer (PI-L), and the SiNx layer (SiNx-L) was taken into consideration. We analyzed the polarization, charge density, and the current density for the electrical properties.
2. Simulation method and procedure
The simulation software for the LCD optical design is unsuitable for the study of the electrical properties of the FFS-LCD. Hence, it is difficult for this software to calculate the resistivity of a material. The FEM solver of COMSOL Multiphysics that it used for solving a partial differential equation (PDE) is suitable for solving the Maxwell equations of electromagnetism for the FFS-LCDs, considering the resistivity of the material. We carried out a two-dimensional simulation study considering the structural symmetry in the FFS-LCD.
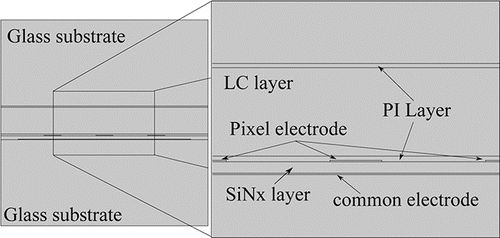
As shown in , the geometry of the FFS-LCD structure was created for the simulation study. The relative dielectric constants and resistivities of the material and the parameters of the FFS-LCD structure have the following values:
Figure 2. Two-dimensional geometric structure of the FFS-LCD created for FEM simulations using COMSOL Multiphysics.
ϵ R [Ω ·cm]
LC 3.5 1E12∼1E16
PI 3.2 1E12∼1E16
SiNx 7.5 1E12∼1E16
PE width: 2 [μm]
PE space: 4 [μm]
Electrode thickness: 50 [nm]
LC-L thickness: 3.1 [μm]
PI-L thickness: 100 [nm]
SiNx-L thickness: 400 [nm]
One static study and two types of dynamic studies were conducted. In the static study, it was assumed that a fixed voltage was applied to the PE. In the 1st dynamic study, it was assumed that a DCV was applied to the CE. In the 2nd dynamic study, it was assumed that a 30 Hz square wave alternating voltage (SQV) was applied to the PE. For understanding the electrical properties of the FFS-LCD, we analyzed the field strength, polarization density, charge density, and current density. In almost all the studies, the LC is treated as a homogeneous dielectric layer. Towards the end of the dynamic studies in 3.2.3, a simple study on the orientation distribution of the LC was carried out. The orientation distribution of a real LC is proposed to be studied in future.
3. Results and discussion
3.1. Static study
In order to explain the electrical features, a typical result is shown in . depicts the electrical properties of the FFS-LCD simulated using typical resistivity conditions. The polarization density becomes significant and electric charge is accumulated in the interface between the LC-L and the PI-L (LC/PI interface) close to the PE edge. The influence of the orientation angle of the LC is considerable with the applied voltage at a position close to the edge of the PE. The electric field strength at this point is significant. Therefore, the accumulated electric charge turns into a residual electric charge, which is one of the causes of the flicker phenomenon.
Figure 3. Enlarged view close to the electrode for the static study (a) polarization (b) charge density and current density.
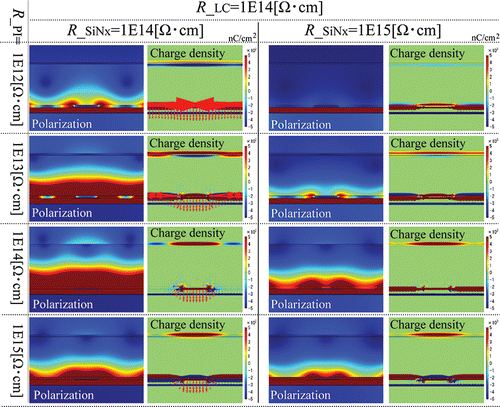
In order to understand the electrical properties of the combination of the various material resistivities, such as the resistivities of the LC-L, the PI-L, and the SiNx-L, a simulation study with a combination (5 × 5 × 5 = 125) of all the conditions from 1E12∼1E16 Ω ·cm was carried out. We explain the typical results only.
In order to understand the results of the simulation of the combination of all the various material resistivities, the polarization and the charge density of the LC/PI interface is shown in . We can determine some characteristic results: The charge density becomes significant, if the resistivity of the PI-L is larger than that of the LC-L. The charge density becomes considerably small, if the resistivities of the LC-L and the PI-L are the same.
Figure 4. Charge density of the LC/PI interface.
3.2. Dynamic studies
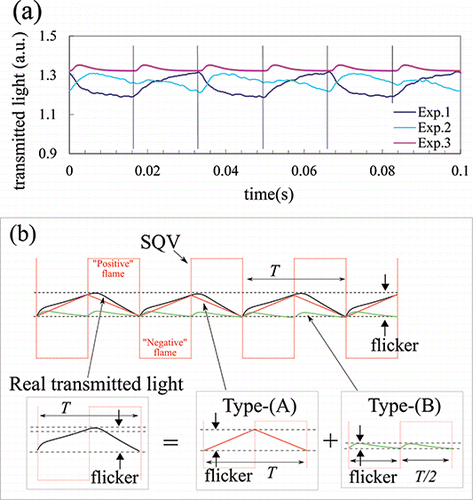
If the transmitted light is detected by a photodetector and monitored using measuring instruments such as an oscilloscope, as illustrated in , two types of transmitted light changes are observed in the wave. In order to understand the relationship between the charge density and the flicker phenomenon, we carried out the dynamic studies of the two types of transmitted light changes. Type-(A) has the same period as that of the driving frequency, whereas, type-(B) has half the period of the driving frequency and the causes of these flicker phenomena differ. Type-(A) has a drive, wherein, an asymmetrical voltage is applied to the LC. Type-(B) has the same behavior, when a “positive” flame or a “negative” flame of an SQV is applied to the LC. This is because the behavior of this type of LC is dependent on the absolute value of the electric field strength. In many cases, as the transmittance change in type-(A) is greater than that of type-(B), if type-(A) is not improved, it becomes difficult to detect type-(B). If the drive voltage applied to the LC-L is asymmetrical, an RDC is caused and a type-(A) transmitted light change results periodically. Further, type-(A) can be cancelled by applying the reverse polarity DCV of an RDC; however, type-(B) is non-cancellable; i.e., type-(A) and type-(B) are different phenomena.
Figure 5. (a) Typical flicker wave observed in the experiments. (b) Diagrammatic illustration of the transmitted light change leading to the flicker phenomenon. Type-(A) has the same period as the driving frequency. Type (B) has half the period as the driving frequency, “Exp. 1” has a dominant type-(A), “Exp. 2” contains type-(A) and type-(B), and “Exp. 3” has a dominant type-(B).
In several cases, in order to observe this flicker phenomenon experimentally, LCD manufactures apply a DCV to the CE, observe the absorption and relaxation process of behavior of the DCV and discuss the flicker phenomenon. This method is often called as a flicker RDC or a DC-type image sticking method (). We performed the dynamic studies of the electrical properties in order to understand the causes of the type-(A) and type-(B) transmitted light changes.
Figure 6. Typical experimental result, when a DCV (0.3 V DC, 600∼1800[s]) is applied to the CE and an SQV is applied to the PE, to enable a 20% transmittance. It is determined by the behavior of the amplitude of the flicker caused by the DCV.
![Figure 6. Typical experimental result, when a DCV (0.3 V DC, 600∼1800[s]) is applied to the CE and an SQV is applied to the PE, to enable a 20% transmittance. It is determined by the behavior of the amplitude of the flicker caused by the DCV.](/cms/asset/6d22f96e-830f-4b5e-8b1e-43a6c49bfb34/gmcl_a_1289430_f0006_oc.gif)
3.2.1. Type-(A) dynamic study
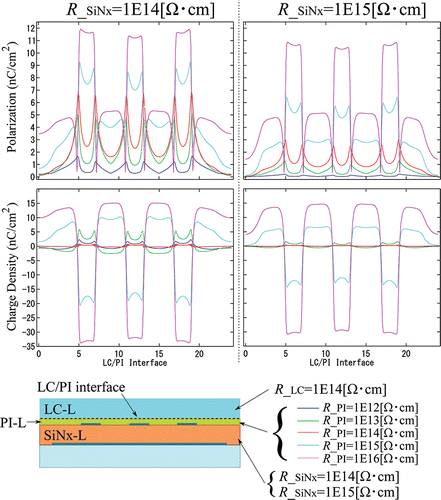
As shown in , a DCV was applied to the CE for a definite period of time for the dynamic study of the type-(A). The typical experimental results of the absorption and release behavior of the DCV are shown in . The simulation results of the time dependency of the charge density are shown in . As shown in , for all the materials (the LC-L, PI-L and the SiNx-L), the dependency of the charge density on the resistivity is significant, similar to the results of the static study in and . The tendencies of the simulation results, thus far, are almost similar to the typical experimental results, : Exp. 1∼ -(a) and : Exp. 3∼ -(c). If the charge density is significant, the transmitted light change is considerable and the flicker problem becomes severe. On the contrary, if the charge density is low, the type-(A) transmittance change is less and does not cause a serious flicker problem.
Figure 7. DCV applied to the CE: 0.3 V DC, 600∼1800[s], results of the dynamic study of the time evolution of the polarization and charge density. When the resistivity of (a) the LC-L is smaller than that of the PI-L, (b) the PI -L is the same as that of the LC-L and (c) the PI-L is smaller than that of the LC-L.
![Figure 7. DCV applied to the CE: 0.3 V DC, 600∼1800[s], results of the dynamic study of the time evolution of the polarization and charge density. When the resistivity of (a) the LC-L is smaller than that of the PI-L, (b) the PI -L is the same as that of the LC-L and (c) the PI-L is smaller than that of the LC-L.](/cms/asset/bd26347b-df83-4279-82a2-dd7d48091270/gmcl_a_1289430_f0007_oc.gif)
As shown in -(a), the charge density becomes less, if the resistivity of the PI-L is smaller than that of the LC-L. As shown in -(b), the charge density is scarcely generated, if the resistivity of the PI-L is the same as that of the LC-L. As depicted in -(c), the charge density becomes significant, if the resistivity of the LC-L is smaller than that of the PI-L.
3.2.2. Type-(B) dynamic study
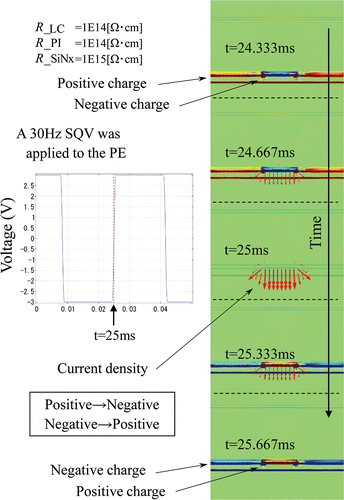
This transmitted light change is caused, when an SQV is applied and the polarity of the applied voltage is reversed. Reversing the polarity of the applied voltage implies a “negative to positive” or a “positive to negative” change. In the dynamic study of the type-(B), a 30 Hz SQV is applied to the PE. In , a typical snapshot of the charge density and current density is shown, when the polarity of the applied voltage is reversed from “negative to positive”. The flow of the electric current is indicated by an arrow in the figure. When the polarity of the charge density of the LC/PI interface is reversed, an electric current flows from the PE to the CE across the SiNx-L. The amount and the tendency of the electric current depicted by the arrow are indicated by the results of the static study in . From the results of the static study, it can be seen that the amount and tendency of the current density are dependent on the magnitude correlation of each material‘s resistivity; i.e., the electric current tends to flow to a lower resistance material from the PE.
Figure 8. Snapshots of the charge density and current density, when the polarity of the SQV is reversed from negative to positive.
3.2.3. Dynamic study of the equation of motion of the LC orientation
The electric current affects the orientation angle of the LC and is considered to affect the transmitted light of the LCD. With the SQV, the electric current change affects the transmitted light periodically and this is considered as a flicker phenomenon.
We adopted the equation of motion of the LC and carried out the simulation study of the orientation angle change of the LC.
We described the PDE of the equation of motion of the LC orientation with the PDE solver of COMSOL Multiphysics and conducted the FEM simulation study. In this study, perpendicular conditions were assumed for the field strength of the substrate for the equation of motion, for a qualitative study. As the electric field distribution in a real FFS-LCD is complicated, this assumption is insufficient for a quantitative study.
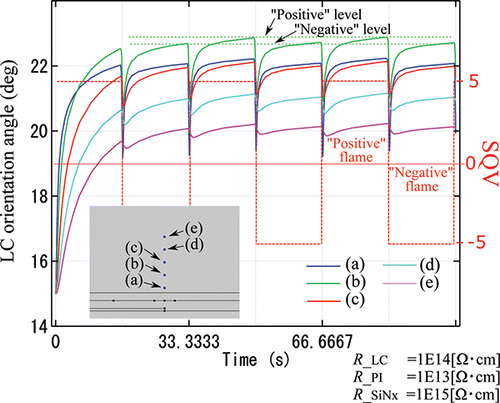
As shown in , an SQV is applied at a time = 0 and the orientation angle of the LC is rotated from the initial angle value to the driving state. Qualitatively, with the polarity reversals of the applied voltage, it was observed that the orientation angle of the LC is affected periodically. Further, it appears that the levels of the orientation angle of the LC for a “positive” and a “negative” of the SQV flame differ. A detailed quantitative study is intended in future.
Figure 9. Time dependency of the LC molecular orientation.
4. Conclusion
For FFS-LCDs, it was shown that the electrical properties such as the charge density and polarization density are considerably dependent on the material resistivity. The relationships between these electrical properties and the flicker phenomenon were also explained. From the results of this simulation study, it is understood that that the resistivities of the LC-L and PI-L are similar, and that they can be used to reduce the flicker problem in FFS-LCDs.
The causes for the flicker phenomenon in FFS-LCDs have not been understood well, thus far. Hence, in order to understand the display failures in FFS-LCDs, the availability of a simulation study was also demonstrated. The resistivity relationships of the materials, obtained by the static study and the dynamic studies are almost the same. The results of the static study are effective for understanding the final results of the dynamic study.
However, a quantitative study of the flicker phenomenon does not suffice. In order to investigate the causes for display failures in FFS-LCDs, in future, we intend to study not only the dependencies of the material properties but the influence of the flexoelectric effect as well.
References
- Lee, S. H., Lee, S. L., & Kim, H. Y. (1998). Appl. Phys. Lett., 73, 2881.
- Lee, S. H., Lee, S. L., & Kim, H. Y. (1998). Proc. 18th Int. Display Research Conf. (Asia Display), 371.
- Oh-e, M., & Kondo, K. (1995). Appl. Phys. Lett., 67, 3895.
- Jeong, I. H., Jang, I. W., Kim, D. H., Han, J. S., Kumar, B. V., & Lee, S. H. (2013). SID Int. Symp. Dig. Tech. Pap., 44, 1368.
- Meyer, R. B. (1969). Phys. Rev. Lett., 22, 918.
- Oh, S-W., Baek, J-M., Kim, J-W., & Yoon, T-H. (2016). Jap. J. Appl. Phys., 55, 094101.
- Lee, H., Kim, H., Kim, J., & Lee, J-H. (2016). Jap. J. Appl. Phys., 49, 075501.
- Hong-Yu, X., Wen-Jiang, Y., Zhi-Dong, Z., & Li, X. (2011). Commun. Theor. Phys., 56, 939.