
 ?Mathematical formulae have been encoded as MathML and are displayed in this HTML version using MathJax in order to improve their display. Uncheck the box to turn MathJax off. This feature requires Javascript. Click on a formula to zoom.
Abstract
The photorefractive effect of flexoelectric smectic liquid crystal blends was investigated. Smectic liquid crystal blends, composed of smectic-C liquid crystals, photoconductive chiral compounds and a sensitizer, are known to exhibit a large photorefractive effect. The chiral compound plays a critical role in the exhibition of large photorefractivity in smectic liquid crystals. The concentration of the chiral compound was varied and the photorefractive properties of the liquid crystal blend were examined. It was found that smectic-C liquid crystals containing small amounts of a chiral compound show a large photorefractivity even though they do not possess spontaneous polarizations.
1. Introduction
The photorefractive properties of ferroelectric liquid crystal (FLC) blends composed of smectic-C (SmC) liquid crystal (LC) compounds and photoconductive chiral compounds have been reported [Citation1–4]. When laser beams interfere in a photorefractive material, a refractive index grating is formed [Citation5–7]. The photorefractive effect induces a change in the refractive index by a mechanism that involves both photovoltaic and electro-optic effects (). The directions of dipole moments of molecules are changed by the space-charge field that formed between the bright and the dark positions of the interference fringe. FLCs possess spontaneous polarization and show large photorefractive effect because the spontaneous polarization responds to the space-charge field. The most characteristic phenomenon of the photorefractive effect is an asymmetric energy exchange, in which the energy of one of the interfering laser beams transfers to the other [Citation8, Citation9]. This asymmetric energy exchange can be utilized in optical signal amplification, and the amplification of moving optical signals by photorefractive FLC blends has been demonstrated [Citation4]. The FLCs used for practical applications are mixtures of several liquid crystalline compounds and chiral compounds [Citation10, Citation11]. To obtain a photorefractive FLC, a photoconductive compound is also added to the FLC mixture. However, in most cases, the photoconductive compounds are not liquid crystalline materials and the addition of the photoconductive compound to the FLC mixture disturbs the alignment of the FLC molecules. Thus, light scattering in the FLC medium increases. Light scattering in the photorefractive material is not desirable, because the light scattering distorts the interference fringes. To avoid this problem, photoconductive compounds that also possess a chiral structure have been synthesized [Citation12, Citation13]. A photorefractive FLC can be obtained by mixing of a photoconductive chiral compound with a smectic LC mixture. We have reported that photorefractive FLC blends containing photoconductive chiral compounds exhibit large photorefractivity and a fast response [Citation1]. However, when the concentration of a photoconductive chiral compound is changed, the concentrations of both the photoconductive moiety and the chiral moiety are changed. The present study investigates the effect of the concentration of chiral moiety on the photorefractive effect of smectic LC blends. A terthiophene photoconductive chiral compound and a terthiophene compound that does not possess a chiral structure were synthesized (). These compounds were mixed without changing the concentration of the terthiophene unit. The photoconductive chiral mixtures are then added to smectic LCs. The effect of the chiral concentration on the photorefractive effect of the smectic LC blends was then investigated.
Figure 1. Schematic illustration of the photorefractive effect mechanism. (1) Two laser beams interfere in the photorefractive material, (2) charge generation occurs in the light areas of the interference fringes, (3) electrons are trapped at the trap sites in the light areas, holes migrate by diffusion or drift in the presence of an external electric field and generate an internal electric field between the light and dark positions and (4) the refractive index of the corresponding area is altered by the internal electric field that is generated.
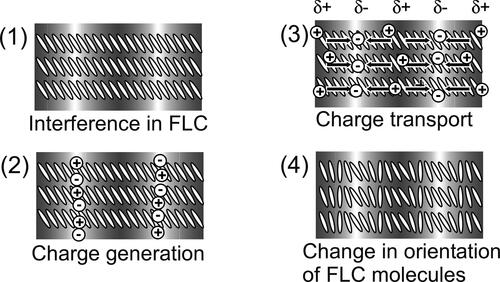
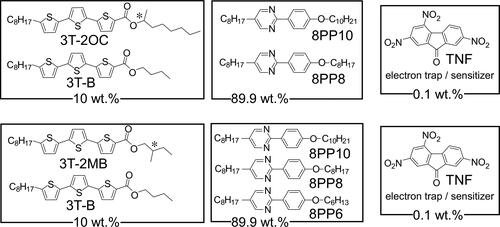
Figure 2. Structures of the photoconductive chiral compounds (3 T-2MB and 3 T-2OC), achiral photoconductive chiral compound 3 T-B, electron trap reagent TNF and smectic LC compounds.
2. Methods
2.1. Samples
The structures of the compounds used in this study are shown in . Terthiophene-type photoconductive chiral compounds, 3 T-2MB and 3 T-2OC, were synthesized as previously reported [Citation12]. 3 T-B was used as a photoconductive compound without a chiral structure. The photoconductive chiral compounds were mixed with 3 T-B, keeping the concentration of the terthiophene moiety constant. Mixtures of photoconductive chiral compounds and 3 T-B with mixing ratios of 9:1, 8:2, 7:3, 6:4, 5:5, 4:6, 3:7, 2:8 and 1:9 were prepared. The terthiophene mixtures were blended with an LC mixture. The concentration of the terthiophene moiety was set to 10 wt.%. Mixtures of phenylpyrimidine-type smectic liquid crystalline compounds, 8PP8, 8PP10 and 8PP6, were used as host liquid crystals (base-LCs). The miscibility of the photoconductive chiral compound differs due to the combination of the base-LC and the compound. The composition of the base-LC had to be optimized. Two types of LC mixtures were incorporated in order to keep the SmC phase of the samples at room temperature. When 3 T-2MB was used as a photoconductive chiral compound, a ternary mixture of 8PP6, 8PP8 and 8PP10 (2:2:1 weight ratio) was used as the base-LC. While 3 T-2OC was used as a photoconductive chiral compound, a binary mixture of 8PP8 and 8PP6 (1:1) was used as the base-LC. The base LCs exhibited a phase sequence of Crystal ↑ SmC ↑ SmA ↑ Nematic ↑ Isotropic. The phase transition temperatures of these base-LCs are listed in . In order to confirm that the base-LC is SmC phase, homeotropic sample was prepared and observed under polarizing microscope. The base-LC was injected into a 5 µm gap glass cell with homeotropic alignment layer (cetyltrimethylammonium bromide). The base LC takes nematic phase just under isotropic temperature, the homeotropic orientation of the smectic phase was easily obtained by slow-rate cooling (0.2 °C/min). shows the texture of the base-LC sample observed under polarizing microscope. Schlieren texture with fourfold brushes were observed. The result shows that the LC molecules tilt from the layer normal and the structure of the base-LC is smectic C phase. The tilt angles of the base-LCs were determined by polarizing microscope observation. The base-LCs were injected into 2-µm gap LC cells and bright domains and dark domains were observed. The angle between the extinction direction of these domains was measured and the tilt angle of the base-LC was determined. The tilt angle was almost same for the binary and ternary mixture base-LCs, with a value of 6 degrees at room temperature. Trinitrofluorenone (TNF, Tokyo Kasei Co.) was used as an electron trap reagent. A blend of the base-LC (89.9 wt.%), TNF (0.1 wt.%) and a mixture of terthiophene compounds (3 T-2MB + 3T-B or 3 T-2OC + 3T-B, 10 wt.%) was injected into a glass-cell equipped with an ITO electrode and a polyimide alignment layer (). The thickness of the LC was adjusted to 10 µm.
Figure 3. Texture of the homeotropically oriented base-LC (1:1:2 mixture of 8PP10, 8PP8 and 8PP6) observed under polarized microscope at room temperature (27 °C). A 5 µm gap glass cell with homeotropic alignment layer (cetyltrimethylammonium bromide) was used. The base-LC was injected to the cell at isotropic temperature and gradually cooled to room temperature.
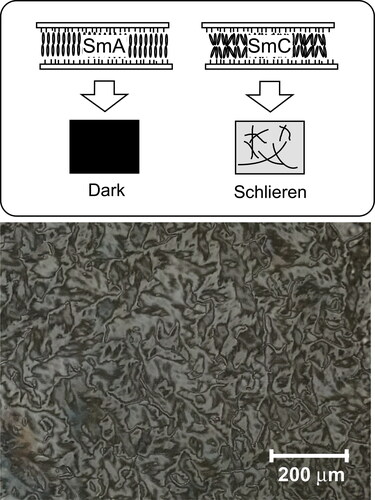
Figure 4. Schematic illustration of the beam incidence in the two-beam coupling experiment and the structure of the LC cell used in this study.
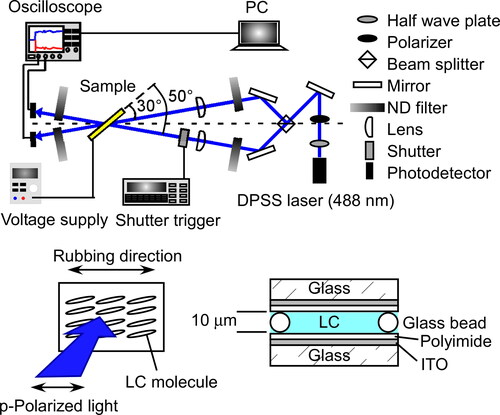
Table 1. Phase transition temperatures of base-LCs.
2.2. Measurements
The phase transition temperatures were determined using differential scanning calorimetry (DSC; DSC822, Mettler) and microscopic observations (FP-80, FP-82, Mettler; DM2700 polarizing microscope, Leica). The spontaneous polarization (Ps) was measured by the triangular waveform voltage method (10 Vp-p, 50 Hz) using a current to voltage converter (Toyo Co. Model 6254 C). Dielectric measurements were made using an impedance/gain-phase analyzer (Solartron SI1260, 100 mV, from 10 mHz to 32 MHz) with a 1296 dielectric interface. The photorefractive effect was examined via two-beam coupling experiments (). In these experiments, a linearly polarized beam from a diode-pumped solid-state laser (DPSS laser, 488 nm, continuous wave) was divided in two by a beam splitter, and these two beams interfered within the sample. A p-polarized beam was used in the experiments. The laser intensity was 2 mW for each beam and each had a 0.5 mm diameter. The beam angles incident to the glass plane were 30° and 50° and the interference fringe interval was 1.87 µm. An electric field of 2 V/µm was applied to the sample from a regulated DC power supply (Kenwood DW36-1) while the change in the transmitted beam intensities were monitored by silicon PIN detectors (ET-2040, Electro-Optics Technology, Inc., response time: 30 ns) and the data recorded on a computer. The experimental conditions are identical to the conditions previously reported [Citation1, Citation3, Citation4]. The time required to form the refractive index grating in the LC was determined based on the simplest single-carrier model of photorefractivity, in which the gain transient is exponential. The rising signal of the diffracted beam was fitted using a single exponential function:
(1)
(1)
where γ(t) represents the transmitted beam intensity at time t divided by the initial intensity (γ(t) = I(t)/I0), and τ is the formation time. The two-beam coupling gain coefficient Γ was calculated assuming Bragg diffraction: [Citation7]
(2)
(2)
where D = L/cos(θ) is the interaction path for the signal beam (L = sample thickness, θ = propagation angle of the signal beam in the sample), g is the ratio of the signal beam intensities behind the sample with and without a pump beam, and m is the ratio of the beam intensities (pump/signal) in front of the sample.
3. Results and discussions
3.1. Photorefractive effect of the smectic LC blends containing photoconductive chiral dopants
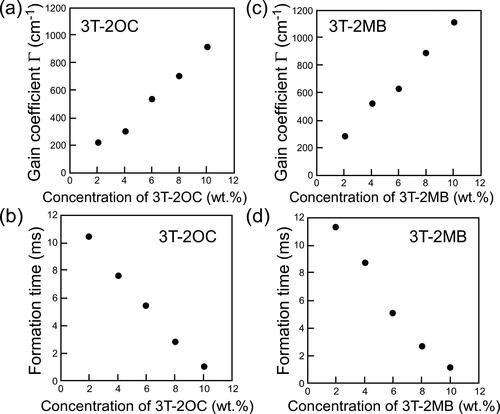
The photorefractive properties were evaluated by a two-beam coupling experiment. A 488-nm laser beam was split into two and directed to interfere within a sample. A typical example result of a two-beam coupling experiment (asymmetric energy exchange) is shown in . The transmitted intensity of one beam through the sample decreases and that of the other beam increases because of the formation of a phase-shifted grating. The photorefractive effect was evaluated by gain coefficients (Γ) and refractive index grating formation times (τ) obtained from the data of the two-beam coupling experiments. The magnitude of the gain coefficients and the formation times of the LC blends containing photoconductive chiral dopants (3 T-3OC and 3 T-2MB, not containing 3 T-B) and TNF are shown in . A very large gain coefficient of over 1000 cm−1 was obtained in the LC blend with the application of a 2 V/µm external electric field. As the concentration of the photoconductive chiral compound was increased, the gain coefficient increased and the formation time decreased. It was considered that the increased photoconductivity and the spontaneous polarization contributed to the fast and large photorefractivity. However, in this case, as the concentration of the photoconductive compound was changed, both the photoconductivity and the concentration of the chiral moiety changes.
Figure 5. Typical result of two-beam coupling experiments for an LC blend measured at 30 °C for a mixture of 8PP10, 8PP8 and 8PP6 (1:1:2), TNF (0.1 wt.%) and 3 T-2MB (10 wt.%). An electric field of 2 V/µm was applied to the sample.
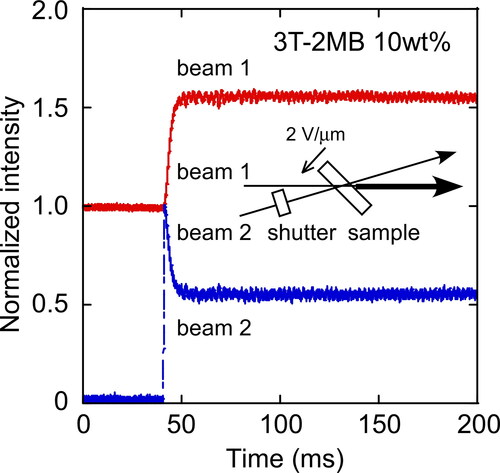
Figure 6. (a) Dependence of the magnitude of the gain coefficient on the concentration of the photoconductive chiral compound 3 T-2OC (without 3 T-B). (b) Dependence of the refractive index grating formation time on the concentration of 3 T-2OC. (c) Dependence of the magnitude of the gain coefficient on the concentration of the photoconductive chiral compound 3 T-2MB (without 3 T-B). (d) Dependence of the refractive index grating formation time on the concentration of 3 T-2MB. An electric field of 2 V/µm was applied to the sample. The measurement was conducted at room temperature.
3.2. Dependence of the photorefractive effect of the smectic LC blends on the concentration of chiral moiety
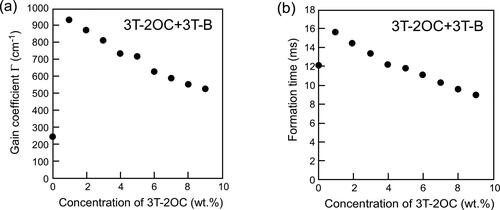
In order to distinguish the contribution of the concentration of the chiral moiety, LC blends that contain different concentrations of the chiral moiety while maintaining a constant concentration of the photoconductive moiety were prepared. The photoconductive chiral compounds were mixed with the achiral photoconductive compound 3 T-B. The mixing ratio was varied to prepare mixtures with different concentrations of the chiral moiety while keeping a constant concentration of the photoconductive moiety (terthiophene). shows the gain coefficient and refractive index grating formation times of LC blends containing 3 T-2OC and 3 T-B as a function of the concentration of the chiral unit keeping the concentration of the photoconductive moiety at 10 wt.%. As the concentration of the chiral unit (3 T-2OC) is increased, the gain coefficient decreases and the response time decreases. The decrease in response time is due to the increase in spontaneous polarization. The decrease in gain coefficient is considered to be related to the change in dielectric properties of the LC. The origin of the decrease in the gain coefficient will be discussed in the later section after the measurements of dielectric properties and the switching angles of the LC blends.
Figure 7. Gain coefficients and refractive index grating formation times of LC blends containing a photoconductive mixture (3 T-2OC and 3 T-B). (a) Dependence of the magnitude of the gain coefficient on the concentration of the chiral unit (3 T-2OC). (b) Dependence of the refractive index grating formation time on the concentration of the chiral unit. The concentration of the photoconductive chromophore (terthiophene) was kept constant (10 wt.%). An electric field of 2 V/µm was applied to the sample. The measurement was conducted at room temperature.
shows the gain coefficient and refractive index formation times of LC blends containing 3 T-2MB and 3 T-B as a function of the concentration of the chiral unit keeping the concentration of the photoconductive moiety at 10 wt.%. At chiral concentrations higher than 3 wt.%, the gain coefficient increased linearly and the formation time decreased as the concentration of the chiral unit increased. However, at chiral concentrations lower than 3 wt.%, large gain coefficients and a fast response was obtained. The gain coefficient and the formation time obtained for the ternary mixture base-LC mixed with 10 wt.% of 3 T-B (without chiral compound) and 0.1 wt.% of TNF were 220 cm−1 and 8.7 ms, respectively (). The values are close to the extensions of the curves for higher concentrations. This result means that the SmC phase with chiral dopant concentrations lower than 3 wt.% shows anomalously large and fast response photorefractive effect.
Figure 8. Gain coefficients and refractive index grating formation times of LC blends containing a photoconductive mixture (3 T-2MB and 3 T-B). (a) Dependence of the magnitude of the gain coefficient on the concentration of the chiral unit (3 T-2MB). (b) Dependence of the refractive index grating formation time on the concentration of the chiral unit. The concentration of the photoconductive chromophore (terthiophene) was kept constant (10 wt.%). An electric field of 2 V/µm was applied to the sample. The measurement was conducted at room temperature.
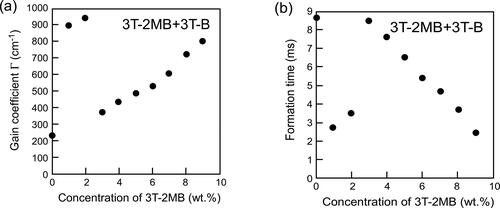
The concentration of the chiral compound affects the properties of the LC phase. It was considered that the mechanism of the photorefractive effect observed at the 3 T-2MB concentrations lower than 3 wt.% was different from that of the photorefractive effect at higher chiral concentrations. The behavior of the LC blends containing 3 T-2MB is quite different from that of the blends containing 3 T-2OC. Although the response time of the photorefractive effect was fast, the LC blends containing 3 T-2MB were not considered to be ferroelectric. At 3 T-2MB concentration of 0 wt%, where both the ferroelectric polarization and the electroclinic effect are absent, the mechanism of the photorefractive effect is considered to be induced through flexoelectricity. The electro-optical response and the photorefractive response were made faster through the flexoelectric effect.
3.3. Effect of the chiral concentration on thermal and electrical properties of the smectic LC blends
3.3.1. Phase transition temperatures and spontaneous polarizations of the LC blends
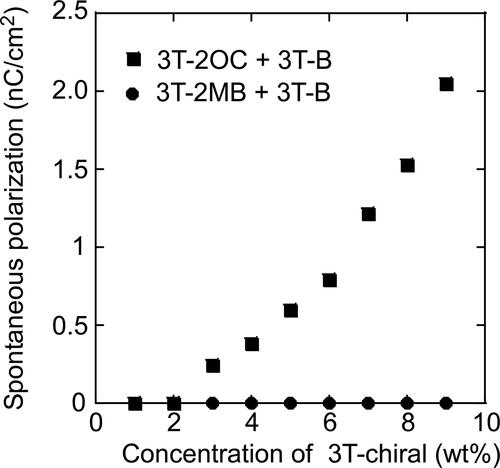
shows the dependence of the phase transition temperatures of the LC blends on the concentration of the chiral compound. The concentration of the terthiophene moiety was kept constant. The phase transition temperatures were almost independent of the concentration of the chiral compound. shows the dependence of the spontaneous polarizations of the LC blends on the concentrations of the chiral compounds. The LC blend containing 3 T-2OC and 3 T-B exhibited a clear spontaneous polarization. The magnitude of the spontaneous polarization increased as the concentration of the chiral compound 3 T-2OC increased. No spontaneous polarization of the LC blend containing 3 T-2MB and 3 T-B was observed in the present apparatus.
Figure 9. Phase diagrams of base LC mixtures and photoconductive chiral compounds. The concentration of the photoconductive chromophore (terthiophene) was kept constant (10 wt.%) using an achiral photoconductive compound 3 T-B. (a) Phase-transition temperatures of the LC blend of a binary mixture of base-LC (1:1 mixture of 8PP10 and 8PP8), 3 T-2OC and 1 wt.% of TNF as a function of the concentration of 3 T-2OC. (b) Phase-transition temperatures of the LC blend of a ternary mixture of base-LC (1:1:2 mixture of 8PP10, 8PP8 and 8PP6), 3 T-2MB and 1 wt.% of TNF as a function of the concentration of 3 T-2MB.
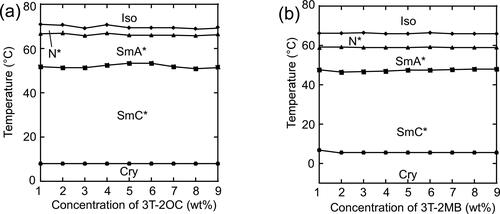
Figure 10. Spontaneous polarization of LC blends measured by a triangular waveform voltage method. A triangular waveform voltage of +10 V and -10 V with a frequency of 50 Hz was applied to 10-mm thick samples. •: Mixture of 8PP10, 8PP8 and 8PP6 (1:1:2), TNF (0.1 wt.%) and 3 T-2MB. ▪: Mixture of 8PP10 and 8PP8 (1:1), TNF (0.1 wt.%) and 3 T-2OC. The concentration of the photoconductive chromophore (terthiophene) was kept constant (10 wt.%). The measurement was conducted at room temperature.
3.3.2. Dielectric properties of the LC blends
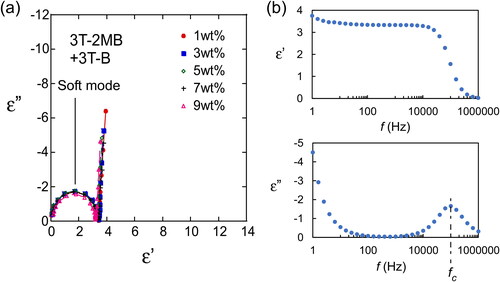
Smectic LCs show two response modes to an applied alternating electric field [Citation10], a soft mode and a Goldstone mode (). The soft mode is a response of the tilt angle of the LC molecules to the applied electric field, namely the directions of the LC molecules change in accordance with the magnitude of the applied electric field. The Goldstone mode is a ferroelectric response of the LC phase, where an LC molecule rotates forming a cone shape. The tilt angles of the LC molecules do not change significantly in this mode. These two modes can be distinguished by measuring the dielectric relaxation spectra. The dielectric relaxation spectroscopy profiles of LC blends containing 3 T-2OC and 3 T-B are shown in through Cole–Cole plots. The samples containing the chiral compound (3 T-2OC) at concentrations higher than 3 wt.% exhibited the Goldstone mode, indicating that these LC blends can be attributed as being ferroelectric. The dielectric relaxation spectra of LC blends containing 3 T-2MB and 3 T-B () are different from those containing 3 T-2OC. Goldstone-mode relaxation was not observed in LC blends containing 3 T-2MB and 3 T-B, and only soft-mode relaxation was observed, indicating that LC blends containing 3 T-2MB are not FLCs and the large gain coefficient and fast response observed in LC blends containing small amounts of 3 T-2MB () are not brought by a response of spontaneous polarization. The flexoelectric effect is observed in a dielectric material whereby it exhibits a bulk polarization of the material induced by a strain gradient. The photorefractive effect of the flexoelectric liquid crystal cells has been reported [Citation14]. A bulk polarization was induced in the LC blends by the external/internal electric field and a photorefractive effect appeared.
Figure 11. Soft mode and Goldstone mode.
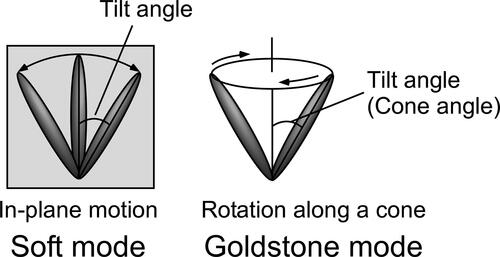
Figure 12. (a) Cole–Cole plots of LC blends containing various concentrations of 3 T-2OC, showing the variation of the loss (ε”) with the permittivity (ε’). The concentrations of the photoconductive chiral compound (3 T-2OC) are shown in the figure legend. The total concentration of the photoconductive chromophore (terthiophene) was kept at 10 wt.%. The measurement was conducted at room temperature. (b) Frequency dependence of the loss (ε”) and the permittivity (ε’). The concentration of 3 T-2OC was 7 wt.%.
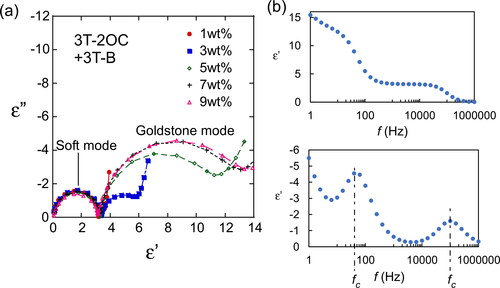
Figure 13. Cole–Cole plots of LC blends containing various concentrations of 3 T-2MB showing the variation of the loss (ε”) with the permittivity (ε’). The concentrations of the photoconductive chiral compound (3 T-2MB) are shown in the figure legend. The total concentration of the photoconductive chromophore (terthiophene) was kept at 10 wt.%. The measurement was conducted at room temperature. (b) Frequency dependence of the loss (ε”) and the permittivity (ε’). The concentration of 3 T-2MB was 7 wt.%.
The photorefractive effect of LCs is comprised of two processes: building up of the space-charge field and the change in orientations of LC molecules. The response time is affected both of the processes. The response of the LC to the electric field can be estimated from the dielectric relaxation measurement. The dielectric relaxation time τ is calculated from the following equation [Citation15]:
where fc is a critical frequency at which ε’’ reaches its maximum ( and Citation13b). The dielectric relaxation time for Goldstone mode was measured to be 4.0 × 10⁻³ s, and that of soft mode was 1.6 × 10⁻⁶ s. The response time of asymmetric energy exchange of the LC blends containing 3 T-2OC was 8–16 ms and that of the LC blend containing 3 T-2MB was 2–9 ms. The response was faster in LCs with 3 T-2MB than those with 3 T-2OC. Since the formation rates of the space-charge field are the same in LCs with 3 T-2OC and 3 T-2MB, the results imply that the change in orientations of LC molecules occurs instantaneously as the formation of space-charge field.
3.3.3. Helical structures of the LC phase
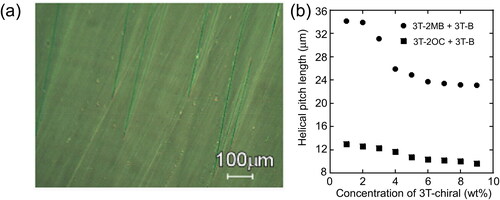
A helical structure is often induced in SmC* phase. The chiral unit induces asymmetric interactions between the LC molecules and the achiral SmC phase turns into SmC* phase. When a SmC* LC is injected into a thin gap LC cell (), the helical structure of the SmC* phase is unwound by the interactions between the LC molecules and the surface of the glass and the homogeneously aligned surface-stabilized state (SS-state) appears. For display applications, typically a 2 µm gap cell is used for obtaining a SS-state sample. However, thickness of 2 µm is too thin for obtaining a sufficient photorefractive effect. The cell-gap of the LC cell used in this study was 10 µm, which is too thick to form a complete SS-state. The textures of the LC blend were observed under a polarizing microscope (). Both zig-zag defects and stripe patterns were observed in the samples. The zig-zag defects show the formation of an SS-state, and the stripe patterns show the existence of a helical structure in the LC phase. The helical pitch length was measured from the stripe pattern (). The helical pitch of the LC blend containing 3 T-2OC and 3 T-B was 9–12 µm, and slightly decreased as the concentration of the chiral compound 3 T-2OC increased. The LC blend containing 3 T-2OC and 3 T-B was considered to be ferroelectric from the results shown in and , and the blend is in the SmC* phase. However, no spontaneous polarization of the LC blend containing 3 T-2MB and 3 T-B was observed in our apparatus. These results indicate that the LC blend containing 3 T-2MB and 3 T-B is not ferroelectric. The helical pitch of the LC blend containing 3 T-2MB and 3 T-B was 23–34 µm, which is much longer than that of the blends containing 3 T-2OC. A phase transition-like change in the helical pitch was observed at a 3 T-2MB concentration of 3 wt.%. The helical pitch was 34 µm in the LCs with a chiral unit concentration lower than 2 wt.%. Although the helical pitch is long, the LCs with 1–2 wt.% of the chiral unit exhibit a helical structure. As the concentration of the chiral unit increases above 3 wt.%, the helical pitch decreases and reaches a constant value of 23 µm. This result indicates that the LC phase transitioned to a SmC* phase from a smectic phase with a loose helical structure.
Figure 14. (a) Texture of the LC blend containing 3 T-2MB (2 wt.%) in a 10 µm thick cell observed under polarizing microscope at room temperature (27 °C). (b) Dependence of the helical pitch length on the concentration of the photoconductive chiral compounds. The concentration of the photoconductive chromophore (terthiophene) was kept at 10 wt.%. The measurement was conducted at room temperature.
3.3.4. Switching angles of the LC molecules
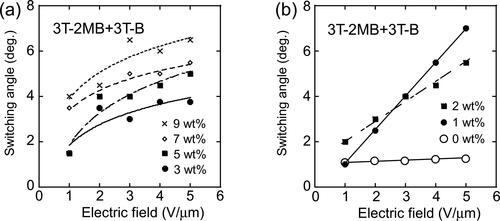
In the SmC phase, the LC molecules tilt from the layer normal. It is difficult to measure the exact tilt angle however, the switching angle in the electrooptical switching can be obtained by applying a positive and negative electric field to the liquid crystal and examining the angle of the extinction position. The switching angle reflects the tilt angle to some extent. The switching angles of the optical axis of the LC blends in 10 µm gap cells were measured using a polarizing microscope. The electric field dependences of the switching angle of the LC molecules in the LC blends containing 3 T-2OC and 3 T-B are shown in . The base-LC containing 10 wt.% of 3 T-B (not containing a chiral compound) showed weak electrooptical switching and the switching angle was measured to be 1 ∼ 2 degrees although the tilt angle of the pure base-LC was measured to be 6 degree in 2 µm gap cell (as described in section 2.1). The addition of 3 T-B and the thicker cell gap lead to smaller switching angle. When the chiral concentration was 1 wt.%, the switching angle changed significantly by the application of the electric field. It was considered that the LC phase is not the ferroelectric phase at this concentration and that the tilt angle (thus the switching angle) changed with the electric field through the soft-mode response. However, at chiral concentrations higher than 3 wt.%, the dependence of the switching angle on the electric field was small. The response of the LC molecules to the electric field at this concentration is that of the Goldstone mode. The Goldstone mode response is normally observed in the SmC* phase and the switching angle (corn angle) of the LC molecules is almost constant in this mode. These results coincide with the results of the dielectric relaxation measurements (). On the other hand, when 3 T-2MB was used as the chiral compound, the electric field dependence of the switching angle was quite different. As shown in , at chiral concentrations higher than 3 wt.%, the change in the switching angle caused by the electric field was small and nonlinear. However, at chiral concentrations lower than 3 wt.% (), the switching angle increased linearly with the strength of the applied electric field. This is a typical electroclinic effect often observed in smectic LCs [Citation16, Citation17]. The electroclinic effect is a change in switching angle of the optical axis of an LC in the plane perpendicular to an applied electric field. The photorefractive effect of the smectic liquid crystals that show electroclinic effect has been reported [Citation17, Citation18]. The results in support that the photorefractive effect of LC mixtures observed at 3 T-2MB concentrations higher than 3 wt.% was based on the flexoelectric effect, while that observed at concentrations lower than 2 wt.% was based on the combination of flexoelectric effect and electroclinic effect in which the switching angle of the LC molecules was changed linearly by the photoinduced internal electric field. shows that as increasing the concentration of the 3 T-2OC, the gain coefficient decreases. The photorefractive effect of the 3 T-2OC sample is based on the response of the ferroelectric SmC* phase in which the LC molecules rotate along the alignment axis. In that case the switching angles of the LC molecules are almost constant and the change in birefringence induced by space-charge field is small. As increasing the concentration of the chiral dopant, the contribution of the ferroelectric phase increases and that of the electroclinic effect is reduced so that the gain coefficient decreased as increasing the concentration of 3 T-2OC. It is obvious that the contribution of the flexoelectric effect exist in the photorefractive effect of the 3 T-2OC sample since the effect was observed at chiral concentration of 0 wt.%. However, the extent of the contribution of the flexoelectric effect cannot be estimated from the present data.
Figure 15. Dependence of the switching angle of LC molecules on the applied electric field. The switching angles were measured on LC blends containing 3 T-2OC and 3 T-B. The concentration of 3 T-2MB is given in the figure legend. The concentration of the photoconductive chromophore (terthiophene) was kept constant (10 wt.%).
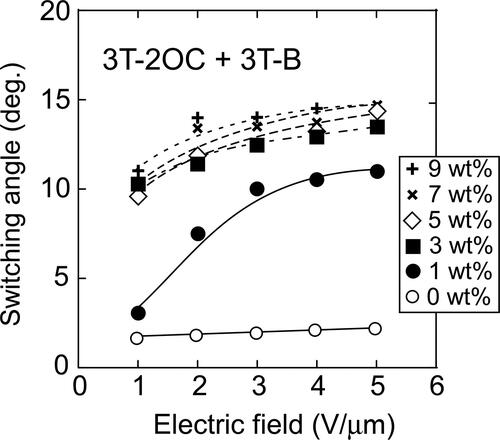
Figure 16. Dependence of the switching angle of LC molecules on the applied electric field. (a) Switching angles measured on LC blends containing 3 T-2MB and 3 T-B. (b) Switching angles measured on LC blends with 3 T-2MB concentrations lower than 2 wt.%. The concentration of 3 T-2MB is given in the figure legend. The concentration of the photoconductive chromophore (terthiophene) was kept constant (10 wt.%).
4. Conclusions
The effect of the concentration of the chiral unit on the photorefractive effect of an LC blend containing a photoconductive chiral compound was investigated. The photorefractive effect in LC blends containing various concentrations of the chiral unit was evaluated by a two-beam coupling experiment. A large photorefractive effect was observed in LC blends containing small amounts of 3 T-2MB. It can be concluded that the LC blends containing 3 T-2MB concentrations lower than 3 wt.% are not FLCs. The large photorefractive effect can be attributed to an electro-clinic effect and a flexoelectric effect induced in the SmC phase containing a small amount of chiral compound.
Notes
The authors declare no competing financial interest.
References
- T. Sasaki, and Y. Naka, Opt. Rev. 21 (2), 99 (2014). doi:10.1007/s10043-014-0016-y
- R. Termine, and A. Golemme, Springer Ser. Mater. Sci. 240, 187 (2016).
- T. Sasaki et al., RSC Adv. 6 (74), 70573 (2016). doi:10.1039/C6RA12231K
- T. Sasaki, S. Kajikawa, and Y. Naka, Farad. Discuss. 174, 203 (2014). doi:10.1039/C4FD00068D
- B. Lynn, P. A. Blanche, and N. Peyghambarian, J. Polym. Sci. Part B: Polym. Phys. 52 (3), 193 (2014). doi:10.1002/polb.23412
- S. Köber, M. Salvador, and K. Meerholz, Adv. Mater. 23 (41), 4725 (2011). doi:10.1002/adma.201100436
- O. Ostroverkhova, and W. E. Moerner, Chem. Rev. 104 (7), 3267 (2004). doi:10.1021/cr960055c
- A. Goonesekera, D. Wright, and W. E. Moerner, Appl. Phys. Lett. 76 (23), 3358 (2000). doi:10.1063/1.126647
- N. Koukourakis et al., Opt. Express. 19 (22), 22004 (2011). doi:10.1364/OE.19.022004
- K. Skarp, and M. A. Handschy, Mol. Cryst. Liq. Cryst. 165, 439 (1998).
- P. Oswald, and P. Pieranski, 2006 Smectic and Columnar Liquid Crystals (Taylor & Francis, New York).
- T. Sasaki et al., J. Mater. Chem. 21 (24), 8678 (2011). doi:10.1039/c1jm10405e
- T. Sasaki et al., Appl. Phys. Lett. 102 (6), 063306 (2013). doi:10.1063/1.4792735
- V. Y. Reshetnyak et al., Phys. Rev. E. 81 (3), 031705 (2010). doi:10.1103/PhysRevE.81.031705
- W. Haase, and S. Wrobel, 2003 Relaxation Phenomena (Springer-Verlag, Berlin, Heidelberg).
- I. Adbulhalim, and G. Moddel, Liq. Cryst. 9, 493 (1991).
- R. Termine, B. C. De Simone, and A. Golemme, Appl. Phys. Lett. 78 (6), 688 (2001). doi:10.1063/1.1345824
- R. Termine, and A. Golemme, J. Phys. Chem. B. 106 (16), 4105 (2002). doi:10.1021/jp013567q