
 ?Mathematical formulae have been encoded as MathML and are displayed in this HTML version using MathJax in order to improve their display. Uncheck the box to turn MathJax off. This feature requires Javascript. Click on a formula to zoom.
ABSTRACT
Contrast between marker-assisted backcross (MABC) and doubled haploid (DH) methods in transferring genes for resistance to maize lethal necrosis (MLN) in maize (Zea mays L.) is not well understood. The MLN is caused by co-infection of maize plant by maize chlorotic mottle virus and sugarcane mosaic virus. Two maize panels consisting of four BC3F2 and six DH populations, separately developed through marker-assisted selection from crosses between susceptible CIMMYT lines and MLN-resistant donor parent (KS23-6), were used in the current study. The two populations were of different population structures with unequal sizes. Experiments were conducted under artificial MLN inoculations for two seasons in 2018. Analyses of variance revealed significant variations among genotypes in both panels (p ≤ 0.001). Levene’s and Welch’s tests found that variances and means of the BC3F2 and DH populations were highly unequal (p ≤ 0.001). The study identified genotypes with reduced MLN infections in both populations; however, lower means for MLN severity and area under disease progress curve (AUDPC) values, and higher heritability estimates were obtained in the DH populations than in the BC3F2 populations. Additionally, the DH populations showed higher relative genetic gains for resistance to MLN compared with the BC3F2 populations. The current study detected superiority of DH over MABC populations for breeding for resistance to MLN. Nevertheless, the results observed in the present study warrant further investigations using the same genetic materials with identical population sizes.
1. Introduction
Maize is a cross-pollinated plant and breeding for improvement of traits of interest has been successful by making crosses between two contrasting (donor and recipient) parents. Main idea is always to transfer a specific portion (quantitative trait locus/loci; QTL) from the donor into the genome of the recipient parent. The task is accomplished by backcross methods, wherein the F1 hybrid is repeatedly crossed to the recipient parents until a desired characteristic is obtained. Backcross requires 6–8 generations to get recombinant progeny with over 96% resemblance to the recipient parent, except for the introgressed trait (Ye, Ogbannaya, and Giinket Citation2009; Hospital Citation2005). However, with the incorporation of molecular marker techniques, selection of progeny for favorable alleles can begin as early as BC1, where introgression of favorable alleles into the background of adapted genotypes can be obtained within 2–3 generations (Hasan et al. Citation2015; Hospital and Charcosset Citation1997). The method is widely adopted for improvement of crops for traits of economic importance, such as resistance to diseases, tolerance to low soil fertility and yield performance. Advances in breeding have seen the utilization of the DH populations in improving crops, in which genotype can be fixed for traits of interest in only 1–2 generations (Longin et al. Citation2007). The DH method is widely used in maize breeding as well as in many other crops (Cegielska-Taras et al. Citation2015; Prasanna, Chaikam, and Mahuku Citation2012).
Two panels of BC3F2 and DH maize lines were selected using single nucleotide polymorphism (SNP) markers linked to major QTL associated with resistance to MLN. The BC3F2 panel was selected for two SNPs separately developed by CIMMYT for resistance to MLN, whereas DH populations were selected for six MLN resistance-associated SNPs developed by LGC Genomics, UK. The two panels were evaluated for two seasons under artificial MLN inoculations in Naivasha, Kenya, in 2018, and the best BC3F2 and DH lines were identified.
The choice of breeding tools to be adopted is equally important as identification of the breeding objectives. Use of suitable techniques contributes to reliable breeding results and informative decisions. Both marker-assisted backcross (MABC) and DH populations are extensively used in plant breeding. These techniques have huge advantages in time required to generate breeding lines because favorable alleles can be fixed within the susceptible backgrounds in 2–3 generations (Hasan et al. Citation2015; Hospital and Charcosset Citation1997). Although MABC and DH techniques are extensively adopted, knowledge of comparative effectiveness of MABC and DH techniques in fixation of genes for resistance to MLN is not well understood in maize. However, superiority of DH method over other techniques for breeding for traits of economic importance has been reported. Dicu and Cristea (Citation2016) compared DH and synthetic populations in maize and reported that DH populations outperformed synthetic populations for all the traits investigated. The authors attributed the performances of the DH lines to complete homozygosity and phenotypic uniformity. Lazaridou et al. (Citation2013) compared DH lines produced from superior F3 plants and corresponding F6 lines produced from the same cross in barley. The authors reported that some advanced pedigree lines (F6) yielded significantly higher than the best DH line, which could be attributable to the small number of DH lines evaluated. The authors suggested that the superiority of F6 over DH lines could be attributable to a lower level of recombination events experienced in DH lines compared to the advanced lines where the number of recombinations was higher because of repeated crossing. Bordes et al. (Citation2006) evaluated doubled-haploid lines versus single-seed descent (SSD) lines and S1-family for testcross performance in a maize population. They observed that genetic variance among SSD lines was only 1.5 times higher than the genetic variance of S1 families. The authors suggested that the lower variance could be attributable to a selection bias in the method of production of SSD lines. Information on the comparative effectiveness of MABC and DH methods in breeding for resistance to MLN is not available. Therefore, the objectives of the current study were to (i) determine the genetic variances and (ii) assess the equality of means of some population that were developed via marker-assisted selection and DH populations under MLN infections.
2. Materials and methods
2.1 Plant materials
Plant materials used in the current study included four BC3F2 and six DH populations developed by CIMMYT through marker-assisted selection from crosses between susceptible elite CIMMYT lines (recipients) and an MLN-resistant donor parent (KS23-6) (). The recipient parents are known for resistance to various diseases and tolerance to drought and low nitrogen and for good agronomic performances. The donor parent was developed by Kasetsart University (Thailand) for resistance to MLN and was obtained from CIMMYT.
Table 1. List of parental lines used for development of marker-assisted backcross (MABC) and doubled-haploid (DH) populations for resistance to maize lethal necrosis (MLN)
2.2 Phenotypic evaluation of BC3F2 and DH lines for resistance to MLN
Four BC3F2 and six DH populations were evaluated under artificial MLN inoculations in a confined MLN facility in Naivasha, Kenya (36°26E; 0°43S; 1896 masl; 677 mm/year rainfall and 9.5–24.9°C mean temperature (Odiyo et al. Citation2014; Ziyomo and Bernardo Citation2013) for two seasons in 2018. Trials were planted using an alpha lattice design with two replications. The interrow spacing was 0.75 m and interrow spacing 0.3 m. Two seeds were planted per hill and seedlings were thinned to 1 seedling per hill 3 weeks after germination, making a total of 10 plants per row. Standard agronomic practices were used as described elsewhere (Gowda et al. Citation2015; Mahuku et al. Citation2015). The MLN-inoculation procedures and collection of data for MLN incidence were according to Gowda et al. (Citation2015). To maintain moisture requirements for the experimental units, water was supplied to the experiments via drip irrigation whenever rainfall shortage was experienced during the growing season.
2.3 Statistical analyses
Analysis of variance was conducted and best linear unbiased estimates (BLUEs) were generated for each group of the populations using R software (R Core Team Citation2016). Populations were considered fixed effects, whereas seasons were regarded as random effects. We used single-stage analysis with weighted means calculated across seasons so that adjusted genotype means representing the BLUEs were obtained assuming fixed effects for genotypes (Piepho et al. Citation2012). The mixed model was fitted as follows (Damesa et al. Citation2019):
where Y ijhkm = phenotypic observation (yield) for the ith genotype in the jth season, hth site, kth replicates, and mth block; μi = expected value of the ith genotype and it is regarded as fixed effect; t jh = random effect of the hth site nested within jth season with var(t jh) = σ2t(jh); r jhk = random effect of the kth replicate nested within the jth season, hth site with var(r jhk) = σ2r(jhk); b jhkm = random effect of the mth block nested within the jth season, hth site and kth replicate with var(b jhkm) = σ2b(jhkm); Sj = random main effect of the jth season with var(s j) = σ2s; ah = random main effect of the hth site with var(a h) = σ2a; gs ij = random interaction effect of the ith genotype and the jth season; ga ih = random interaction effect of the ith genotype and hth site with var(ga ih) = σ2ga; sa jh = random interaction effect of the jth season and hth site; sag jhi = random interaction effect of the jth season, hth site and ith genotype with var(sag jhi) = σ2 sag; and e ijhkm = residual plot error associated with Yijhkm var(e ijhkm) = σ2 e(jh). Genotype means were visualized using histogram, boxplot and quantile-quantile (Q-Q) plot with fitted linear regression, as established in SAS 9.4 (SAS institute 2016), as follows:
where Yi = dependent variable of the ith genotype; a = y-intercept; b = slope; xi = independent variable of the ith genotype; and εi = error term.
Outputs from the descriptive statistics showed entry means of the two populations computed from their mixed model to have unequal variances. However, similarities were observed between means and medians of the populations, suggesting that the distribution was symmetric. Homogeneity of means of the two populations was not detected using the classical Student’s t-test since the two groups compared in the present study had different population sizes. We, therefore, used Levene’s test (Levene Citation1960) to detect the homogeneity of variance of the two populations based on the hypotheses below:
where H0 = null hypothesis, HA = alternative hypothesis, σ21 = variance for population 1, and σ22 = variance for population 2. Levene’s test gives the best power for symmetric, moderate tailed distributions. However, such distributions tend to be rather rare in biological data. In the current study, we used the F-statistic for Levene’s test modified by Brown and Forsythe (Citation1974) and was computed as follows (Gastwirth, Gel, and Miao Citation2009):
where ni = number of observations in each group, k = number of groups, N = total number of observations, Zij = absolute deviations either from the median of group i () or from the 10% trimmed mean of group i (
), Z. = mean of all the absolute deviations (Zij), and Zi = mean of the absolute deviations (Zij) for group i. The modified Levene’s t-test is regarded as more robust because instead of conducting ANOVA on absolute deviations from the mean of each group, it is based on the absolute deviations of observations from either the median or the 10% trimmed mean of each population.
In a situation where the populations have different variances (σ21 ≠ σ22), Student t-test is not appropriate since the null distribution of its statistic depends on the ratio of the unknown variances (σ21/σ22). Similarly, likelihood ratio test is statistically weak when sample sizes are different (n1 ≠ n2), variance heterogeneity is increased and sample size is small. A simulation study by Ferreira and Ferreira (2009) showed that Welch’s t-test controlled Type I error rate for all sample sizes and for all heterogeneity degree of variances. Additionally, the authors found that modified likelihood ratio test was as good as the t-test only when the degrees of freedom were corrected by Welch/Satterthwaite’s procedure. Derrick, Toher, and White (Citation2016) observed that Welch’s approximate degrees of freedom were more conservative than the degrees of freedom used in the independent samples t-test, particularly when the smaller sample size was associated with the larger variance. After detecting the significant difference (p ≤ 0.05) between the variances of the two populations and the assumption of homogeneity of variances had been violated; and because population sizes were different, we employed Welch’s t-test (Welch, Citation1974) of unequal variances. Welch’s t-test or unequal variances t-test is a modification of Student’s t-test (Derrick, Toher, and White Citation2016). The test is typically used when the statistical units underlying the two samples being compared have unequal variances and/or unequal sample sizes (Welch, Citation1974; Ruxton Citation2006; Derrick, Toher, and White Citation2016). We tested the two population means based on the following assumptions: (1) data follow continuous distribution; (2) data are randomly selected; (3) data are normally distributed (or close enough); (4) population sizes are large; and (5) variances among the groups are equal. These assumptions were tested based on the following two-tailed hypotheses:
The Welch’s t-test was formulated from estimators of parameters as shown below (Derrick, Toher, and White Citation2016):
and
where = estimated standard error (
) for unequal variances;
and
= estimators of variances for populations 1 and 2, respectively; and n1 and n2 = sizes of population 1 and population 2, respectively. Since the population sizes were different, the degrees of freedom (df) for unequal variances were approximated and rounded to the nearest integer as follows (Derrick, Toher, and White Citation2016):
where and
= estimators of variances for population 1 and population 2, respectively; and
and
= number of individuals in population 1 and population 2, respectively. Estimate of mean difference was calculated as the difference between two population means, as shown below:
Lower and upper limits of 95% confidence interval for –
were computed using the following formula:
Cullis’ broadsense heritability was assumed to account for generalized measure of heritability for the unbalanced data and the genetic effect. The method employs the square of the standard error of the genetic estimates across seasons (Cullis, et al., Citation2006; Piepho and Möhring,). The formula for computing broadsense heritability is as follows:
Table
where H2Cullis = Cullis’ broadsense heritability, BLUP = average standard error of the genotypic BLUPs, and σ2g = genetic variance.
When data are unbalanced or when genetic effects are correlated or heteroscedastic, the classical equation for calculating response to selection is irrelevant because standard heritability measure will not relate to response to selection (R). This occurs mainly because correlation between phenotype and response to selection differs among genotypes, and thus there is no simple linear relationship between R and selection differential (S), as in the balanced case (Piepho and Möhring, Citation2006; Cullis, et al., Citation2006). Therefore, in the current study, we used selection intensity (i), which is the mean of the deviations from the population mean. The selection intensity (i) was measured in units of the phenotypic standard deviation of the population and was calculated as follows:
where S = selection differential; σp = phenotypic standard deviation of the population; yi = ith selected observation; = population mean; and n = number of selected observations. Expected genetic gain (EGG) for 10% of selected lines for each population was computed from the generalized measure of heritability as follows (Cullis, 2006):
where i = selection intensity corresponding to mean of the top 10% of selected lines for each population, σp = phenotypic standard deviation of the population, and hg = generalized measure of heritability.
3. Results and discussion
3.1 Analysis of variance of BC3F2 and DH populations under MLN infections
Results for analyses of variance and genetic components generated across seasons revealed significant variations (p ≤ 0.001) among genotypes within the BC3F2 and DH populations for resistance to MLN infections (). The results for genetic components and heritability estimates across two seasons were significant for MLN severity and AUDPC. Broadsense heritability estimates were relatively high for all traits and management options. The high broadsense heritability estimates observed in this study indicated the importance of recurrent selection for improvement of resistance to MLN. The significant variability observed in the current study indicates that the genotypes responded differently under MLN infections, implying the diversity of the genetic backgrounds of the genotypes used.
Table 2. Mean squares and variance components for maize lethal necrosis (MLN) infections obtained from 1010 doubled-haploid (DH) and 62 BC3F2 lines developed via marker-assisted backcross (MABC) evaluated under artificial MLN inoculations for two seasons in 2018
3.2 Mean performances of BC3F2 and DH populations under MLN infections
The CIMMYT lines used for developing these BC3E2 and DH populations were of different gene pools, belonging to heterotic groups “A” and “B”. Therefore, the phenotypic variations observed among the genotypes could imply that the lines within each population were genetically different. Materials with diverse genetic backgrounds are useful in breeding to select for various traits, including resistance to MLN. In both BC3F2 and DH populations, some lines showed lower MLN severity and AUDPC values than the population mean, indicating the availability of some tolerant lines within each population for resistance to MLN. All the populations used in the current study were introgression lines with QTL for MLN resistance donated by KS23-6. Therefore, these superior lines could provide good sources for breeding for resistance to MLN. The DH lines had population means of 5.3 for MLN severity and 101.4 for AUDPC values, which were significantly different (p ≤ 0.01) from the means of BC3F2 lines (6.0 and 133.3, respectively). This could suggest that DH methods could be more efficient than MABC method for introgression breeding for resistance to MLN. The degree of homozygosity of BC3F2 = 93.5%, whereas that of DH lines = 100% (Prasanna, Chaikam, and Mahuku Citation2012). Therefore, the superiority of DH lines over BC3F2 performances could be attributable to their homozygosity and uniformity. Literature on comparative study between BC3F2 and DH lines for fixation of genes for resistance to MLN is lacking. Elsewhere, Beyene et al. (Citation2017) used a cross-validation procedure to evaluate the efficiencies of general combining ability (GCA)-based prediction and hybrid performance to select for grain yield and resistance to MLN. The authors observed that GCA-based prediction efficiency for MLN resistance and grain yield accounted for 67% to 90% of the variation in the hybrid performance, suggesting that GCA-based prediction can be proposed for MLN resistance and grain yield prior to field evaluation.
Table 3. Mean performances for maize lethal necrosis (MLN) severity and area under disease progress curve (AUDPC) values for four BC3F2 maize populations developed by marker-assisted backcross (MABC) method and evaluated under artificial MLN inoculations for two seasons in 2018
3.3 Test for normality of mean distribution and population standard deviations
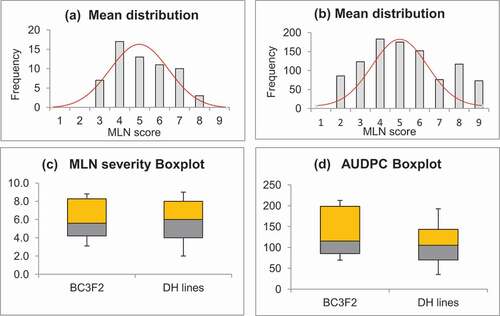
Means and standard deviations for all traits under study in the BC3F2 and DH populations were tested for normal distribution. The box plots indicated that means were normally distributed for MLN severity in both populations (). The populations exhibited normal distributions of means and variances, as revealed by the positions of the median lines and lengths of the whiskers. This implies that variances and means within populations were normally distributed, making them homogeneous genetic materials for the present study. The DH lines showed more symmetric distributions for both MLN severity and AUDPC values than BC3F2 lines, which exhibited moderate skewness, with median lines and whiskers approaching the lower quartiles (25th percentiles) for MLN severity and AUDPC values, suggesting that the DH genotypes had means close to one another.
Figure 1. Histograms and Box-and-Whisker plots of mean distributions: (a) MLN severity in BC3F2 populations; (b) MLN severity in DH populations; (c) Box-and-Whisker plots for MLN severity in BC3F2 and DH populations; and (d) AUDPC values in BC3F2 and DH population; the box bottom (yellow/orange) and top (gray) represent the first and third quartiles, with the line inside the box representing the median; the ends of the whiskers extending from the box is the range of minimum and maximum values
Further, Q-Q plots of error terms showed data points for MLN severity and AUDPC values to be on the straight lines, along the diagonals (). This indicated that the data used were from normally distributed populations and the error terms were normally distributed. Though the data points congregated along straight lines in both populations, the data showed bending off of the MLN severity and AUDPC values at the extremes. The bend extremes imply kurtosis with heavy tails, which could be attributable to the different values of data, resulting from the nature of the data in which some lines had low MLN infection scores, whereas other scores were extremely high, especially for the susceptible lines. Das and Imon (Citation2016) showed that heavy kurtosis tails had been implicated in number of genotypes falling at the tails (acceptance regions). Therefore, in the current study, superior BC3F2 and DH lines were located within the acceptance regions. Simple linear regression, performed to check for the assumptions that the residuals were normally distributed, revealed relatively high R2 values of 0.89 and 0.92 for MLN severity, and 0.94 and 0.95 for AUDPC in the BC3F2 and DH populations, respectively. The high R2 values indicate strong linear association between predicted values and the residuals within the populations used. This means that the data met the assumptions of linear regression, implying normality of distribution of error terms within the populations. Generally, the normality test and mean distribution plots indicated that the data met the assumptions of normality and randomness for the t-test. Based on the confidence intervals, we can suggest that the mean MLN resistance for BC3F2 lines (Population 1) was much less than that for the DH lines (Population 2). The DH populations had reduced MLN severity and AUDPC values. This showed that the two groups did not belong to the same maize population; hence, they were genetically different.
Figure 2. Q-Q plots of standard deviation distributions of MLN severity and AUDPC values in BC3F2 and DH populations: (a) and (b) show standard deviations of MLN severity for BC3F2 and DH populations; (c) and (d) represent standard deviations of AUDPC scores
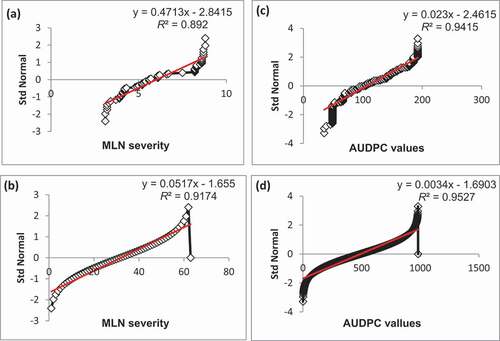
Table 4. Mean performances for maize lethal necrosis (MLN) severity and area under disease progress curve (AUDPC) values for six maize populations developed by doubled haploid (DH) method and evaluated under artificial MLN inoculations for two seasons in 2018
3.4 Independent two-sample t-test for equality of variances and means of MLN severity and AUDPC values in BC3F2 and DH populations
To check for the equality of means and variances of the two groups, population means and variances of MLN severity and AUDPC values for the BC3F2 and DH populations were compared using a two-sample t-test. The results showed variation between variances and means of the two groups was significant (p ≤ 0.001) (). Average performances of BC3F2 populations were 6.7 for MLN severity and 153.6 for AUDPC values. Mean performances of DH populations were 5.9 for MLN severity and 107.2 for AUDPC. In addition, the analyses revealed that variation between the means of the two populations was significant (p ≤ 0.001). Mean differences between the responses of BC3F2 and DH populations was 0.8 for MLN severity, with a standard error difference (SED) of 0.1 and confidence interval (CI) of 0.5 (lower) and 1.0 (upper). The difference for mean AUDPC values between the two populations was 46.4, with an SED of 1.5 and CI of 43.5 (lower) and 49.3 (upper).
Table 5. Welch t-test statistics for equality of means and variances of maize lethal necrosis (MLN) severity and area under disease progress curve (AUDPC) values for BC3F2 and DH lines evaluated for two seasons under artificial MLN infections in 2018
The significant difference (p ≤ 0.001) observed between means and variances of MLN severity and AUDPC values in both populations strongly suggested that means and variances of the two groups of populations were not equal. Mean difference between the two populations was related to standard deviations of the two populations in detecting population equality. If mean difference between the two populations is greater than the standard deviation (SD) of the population, then the two populations are not considered equal (Ott and Longnecker Citation2010). In the current study, mean differences for MLN severity and AUDPC values were greater than the SD differences between the two populations. This confirms that the two populations had different mean performances for resistance to MLN infections.
Unequal mean performances, observed in this study, between BC3F2 and DH populations for response to MLN infections could be attributable to the efficiency and superiority of DH method in breeding for resistance to MLN in maize. The DH population being homozygous at 100% loci, has enhanced additive genetic variance (2× additive variance). At such a high level of additive variance, the level of success is greater than that via MABC method. The BC3F2 populations were generated using foreground selection for two SNP markers on chromosome 3, whereas DH populations were selected using six SNP markers on chromosome 6. The difference in the number of QTL targeted per population might have caused the variation in MLN response in favor of populations containing many QTL for resistance to MLN. Unlike DH populations, which were 100% homozygous, the BC3F2 population still had donor parent’s genetic complement = 6.5%. Therefore, the proportions of donor and recurrent parents were 0.065 and 0.935, respectively. This donor proportion might still contain some undesirable chromosomal segments, which might have resulted in the under performance of the BC3F2 populations for resistance to MLN, as a result of interactions between QTL from different genomic components (epistasis). Therefore, further selfing of the BC3F2 populations to advanced levels (e.g., BC4F7) could allow a significant decrease in heterozygosity; hence minimizing epistatic effects (QTL × QTL interactions). In addition, the BC3F2 and DH lines used in the present study were from different genetic backgrounds. These might have contributed to their differential performances under MLN conditions. The population size for the BC3F2 used was comparatively smaller than that for the DH populations; hence the low population size might have affected selection within the BC3F2 populations.
3.5 Genetic gains for resistance to MLN from populations developed using marker-assisted backcross (MABC) and doubled haploid (DH) methods
For both BC3F2 and DH populations, which were developed using marker-assisted selection, response to selection per cycle and expected genetic gains for resistance to MLN are presented in . The response to selection for marker-assisted BC3F2 populations was 1.6 and 23.2 for MLN severity and AUDPC, respectively. In marker-assisted DH populations, response to selection was 1.7 for MLN severity and 31.1 for AUDPC. Generally, DH populations had an expected genetic gain of 2.2% higher for MLN severity and 14.7% higher for AUDPC than for theBC3F2 populations. A total of 14 superior lines were identified for resistance to MLN in BC3F2 populations. Proportionally, 22.58% of the total 62 BC3F2 lines were selected for resistance to MLN under artificial inoculations. Some of the selected BC3F2 lines were BCL2, BCL11, BCL28, and BCL32. Similarly, 1010 DH lines were phenotyped under artificial MLN infection and 334 DH lines, representing 33.07% of the total population, showed resistance to MLN (). Some of the selected resistant DH lines were DH4, DH90, DH103 and DH121 (data not shown).
Table 6. Comparison of expected genetic gains for maize lethal necrosis (MLN) severity and area under disease progress curve (AUDPC) values between BC3F2 population developed via marker-assisted backcross (MABC) and doubled-haloid (DH) populations evaluated for two seasons under artificial MLN infections in 2018
Table 7. Proportions of maker assisted BC3F2 and doubled-haploid (DH) lines selected for resistance to maize lethal necrosis (MLN) using single nucleotide polymorphism (SNP) markers
Overall, relative genetic gains were 2.3% and 14.6% higher for MLN severity and AUDPC values in DH populations, respectively, than in BC3F2 populations. The higher relative genetic gains observed for the DH population could be attributable to the high heritability estimates and reduced genetic variances for the MLN resistance observed in the population. Elsewhere, a comparative study of genetic gains (Rutkoski et al. (Citation2015) from genomic selection and phenotypic selection for resistance to stem rust of wheat showed that genomic selection led to significantly lower genetic variance. Proportionally, many DH lines were selected per population compared to BC3F2 population. The reason for this variability could be that DH technique is more accurate in selection for fixed alleles than BC method. In the current study, many more lines were screened for DH populations than for BC populations and this might have increased the chances of obtaining lines fixed for the resistance alleles for MLN.
4. Conclusions
The DH lines were superior to BC3F2 lines and had minimal average MLN severity and AUDPC values. The DH lines had comparatively higher heritability estimates for resistance to MLN than BC3F2 lines. Additionally, DH lines had higher genetic gain for reduction of MLN severity and AUDPC values compared to BC3F2. The findings of the present study indicate that the DH method is an appropriate technique for breeding for resistance to MLN.
Author contributions
Luka A.O Awata: Conceptualization, Methodology, Investigation, Formal analysis, Writing-Original draft, Visualization. Beatrice E. Ifie: Review and editing, Supervision. Eric Danquah: Review and editing, Supervision. Philip W. Marchelo-Dragga: Review and editing, Supervision. Chelang’at Sitonik: Data curation, Visualization. Manje Gowda: Review and editing. Suresh L. M: Resources, Supervision, Review and editing. Michael Olsen: Review and editing. Boddupalli M. Prasanna: Review and editing. McDonald B. Jumbo: Resources, Supervision, Review and editing.
Conflicts of interest/Competing interests
The authors declare that they have no conflict of interest.
Acknowledgments
The authors thank The Global maize Program, CIMMYT for providing genetic materials, technical support, and access to MLN facilities for conducting the experiments, with support from the Bill and Melinda Gates Foundation. They also thank the reviewers for their valuable suggestions and corrections and the active role of the editor(s) during the revision of our manuscript. This research was part of the PhD thesis of the first author, funded by Intra-ACP CSAA Mobility Schemes at West Africa Center for Crop Improvement (WACCI), University of Ghana, Legon, Ghana.
Availability of data and material
The datasets generated during and/or analysed during the current study are available from the corresponding author on reasonable request.
Disclosure statement
No potential conflict of interest was reported by the author(s).
References
- Beyene, Y., M. Gowda, L. M. Suresh, L. M. Suresh, M. Olsen, S. Oikeh, C. Juma, A. Tarekegne, and B. Prasanna. 2017. “Genetic Analysis of Tropical Maize Inbred Lines for Resistance to Maize Lethal Necrosis Disease.” Euphytica 213 (9): 1–13. doi:https://doi.org/10.1007/s10681-017-2012-3.
- Bordes, J., G. Charmet, R. Dumas De Vaulx, M. Pollacsek, M. Beckert, and A. Gallais. 2006. “Doubled Haploid versus S1 Family Recurrent Selection for Testcross Performance in a Maize Population.” Theoretical and Applied Genetics 112 (6): 1063–1072. doi:https://doi.org/10.1007/s00122-006-0208-3.
- Brown, M.B. and Forsythe, A.B. 1974. “Robust Tests for Equality of Variances”. Journal of the American. Statistical Association 69: 364–367.
- Cegielska-Taras, T. B., L. Szalla, D. B. Skowronska, and K. Milolajczyk. 2015. “Doubled Haploids as a Material for Biotechnological Manipulation and as a Modern Tool for Breeding Oilseed Rape (Brassica Napus L .).” Journal of Biotechnology, Computational Biology and Bionanotechnology 96 (1): 7–8.
- Cullis, B. R., A. B. Smith, and N. E. Coombes. 2006. “On the Design of Early Generation Variety Trials with Correlated Data.” Journal of Agricultural, Biological, and Environmental Statistics 11 (4): 381–393. doi:https://doi.org/10.1198/108571106X154443.
- Damesa, T. M., J. Hartung, M. Gowda, Y. Beyene, B. Das, K. Semagn, and H.-P. Piepho. 2019. “Comparison of Weighted and Unweighted Stage-wise Analysis for Genome-wide Association Studies and Genomic Selection.” Crop Science 59 (6): 2572–2584. doi:https://doi.org/10.2135/cropsci2019.04.0209.
- Das, K., and A. Imon. 2016. “A Brief Review of Tests for Normality.” American Journal of Theoretical and Applied Statistics 5 (1): 5. doi:https://doi.org/10.11648/j.ajtas.20160501.12.
- Derrick, B., D. Toher, and P. White. 2016. “Why Welch’s Test Is Type I Error Robust.” The Quantitative Methods for Psychology 12: 30–38. doi:https://doi.org/10.20982/tqmp.12.1.p030.
- Dicu, G., and S. Cristea. 2016. “The Eficiency Use of Doubled-hapoid Technology in Maize Breeding-obtaiing DH Parent Lines and Hybrids.” Scientific Papers Series A. Agronomy LIX: 273–278.
- Gastwirth, J. L., Y. R. Gel, and W. Miao. 2009. “The Impact of Levene’s Test of Equality of Variances on Statistical Theory and Practice.” Statistical Science 24 (3): 343–360. doi:https://doi.org/10.1214/09-STS301.
- Gowda, M., B. Das, D. Makumbi, R. Babu, K. Semagn, and B. M. Prasanna. 2015. “Genome-wide Association and Genomic Prediction of Resistance to Maize Lethal Necrosis Disease in Tropical Maize Germplasm.” Theoretical and Applied Genetics 128 (10): 1957–1968. doi:https://doi.org/10.1007/s00122-015-2559-0.
- Hasan, M. M., M. Y. Rafii, M. R. Ismail, M. Mahmood, H. A. Rahim, M. A. Alam, S. Ashkani, M. A. Malek, and M. A. Latif. 2015. ““Marker-assisted Backcrossing: A Useful Method for Rice Improvement.” Biotechnology & Biotechnological Equipment 29 (2): 237–254. doi:https://doi.org/10.1080/13102818.2014.995920.
- Hospital, F. 2005. “Selection in Backcross Programmes”. Accessed 4 February 2021 http://rstb.royalsocietypublishing.org/cgi/doi/10.1098/rstb.2005.1670.
- Hospital, F., and A. Charcosset. 1997. “Marker-assisted Introgression of Quantitative Trait Loci.” Genetics 147 (3): 1469–1485. doi:https://doi.org/10.1093/genetics/147.3.1469.
- Lazaridou, T., A. Lithourgidis, S. Kotzamanidis, and I. Sistanis. 2013. “Evaluation of DH Lines Produced from Superior F 3 Plants and Corresponding Breeding Lines in Barley.” Australian Journal of Crop Science 7: 1430–1435.
- Levene, H.1960. “Robust tests for equalityof variances”. In Ingram Olkin; Harold Hotelling; et al. (eds.). Contributions to Probability and Statistics: Essays in Honor ofHarold Hotelling. Stanford University Press. pp. 278–292.
- Longin, C. F. H., H. F. Utz, J. C. Reif, W. Schipprack, and A. F. Melchinger. 2007. “Hybrid Maize Breeding with Doubled Haploids: III. Efficacy of Early Testing Prior to Doubled Haploid Production in Two-stage Selection for Testcross Performance.” Theoretical and Applied Genetics 112 (5): 903–912. doi:https://doi.org/10.1007/s00122-007-0585-2.
- Mahuku, G., B. Lockhart, B. Wanjala, M. Jones, J. Kimunye, L. Stewart, J. Bryan, et al. 2015. “Maize Lethal Necrosis (MLN), an Emerging Threat to Maize-Based Food Security in Sub-Saharan Africa.” Phytopathology 105 (7): 956–965. doi:https://doi.org/10.1094/PHYTO-12-14-0367-FI.
- Odiyo, O., K. Njoroge, G. Chemining, and Y. Beyene. 2014. “Performance and Adaptability of Doubled Haploid Maize Testcross Hybrids under Drought Stress and Non-stress Conditions.” International Research Journal of Agriculture and Soil Science 4 (8): 150–158. doi:https://doi.org/10.14303/irjas.2014.055.
- Ott, R., and M. Longnecker. 2010. Introdution to Statistical Methods and Data Analysis. 6th ed. Belmont, CA, USA: Macmillan Publishing Solutions.
- Piepho, H. P., J. Möhring, T. Schulz‐Streeck, and J. O. Ogutu. 2012. “A Stage-wise Approach for the Analysis of Multi-environment Trials.” Biometrical Journal 54 (6): 844–860. doi:https://doi.org/10.1002/bimj.201100219.
- Piepho, H. P. and Möhring, J. 2006. “Selection incultivar trials—Is it ignorable?” Crop Science 146: 193–202.
- Prasanna, B. M., V. Chaikam, and G. Mahuku. 2012. Doubled Haploid Production: Theory and Practice. Mexico, D.F.: CIMMYT.
- R Core Team. 2016. R: A Language and Environment for Statistical Computing. Vienna, Austria: R Foundation for Statistical Computing. http://www.r-project.org/.
- Rutkoski, J., R. P. Singh, J. Huerta-Espino, S. Bhavani, J. Poland, J. L. Jannink, and M. E. Sorrells. 2015. “Genetic Gain from Phenotypic and Genomic Selection for Quantitative Resistance to Stem Rust of Wheat.” The Plant Genome 8 (2). doi:https://doi.org/10.3835/plantgenome2014.10.0074.
- Ruxton, G. D. 2006. “The Unequal Variance T-test Is an Underused Alternative to Student’s T-test Giovanny E. Covarrubias-Pazaran “Accelerated Generation of Selfed Pure Line Plants for Gene Identification and Crop Breeding.” Frontiers in Plant Science 8. doi:https://doi.org/10.3389/fpls.2017.01786.
- Welch, B.L. 1974.“The generalization ofStudent’s problem when several different population variances areinvolved. Biometrika 32(1/2): 28-35.
- Ye, G., F. Ogbannaya, and M. V. Giinket. 2009. “Marker-assisted Recurrent Backcrossing in Cultivar Deelopment.” In Molecular Plant Breeding: Principle, Method and Application, 295–319. Houston, USA: Studium Press LLC.
- Ziyomo, C., and R. Bernardo. 2013. “Drought Tolerance in Maize: Indirect Selection through Secondary Traits versus Genomewide Selection.” Crop Science 52: 1269–1275. doi:https://doi.org/10.2135/cropsci2012.11.0651.