
 ?Mathematical formulae have been encoded as MathML and are displayed in this HTML version using MathJax in order to improve their display. Uncheck the box to turn MathJax off. This feature requires Javascript. Click on a formula to zoom.
ABSTRACT
Seed oil and seed protein contents are commercially important components of soybean (Glycine max (L.) Merr.) that are inversely correlated. The objectives of this study were to identify novel quantitative trait loci (QTL) and validate existing QTL associated with seed oil, seed protein, and seed weight in soybean. Two mapping populations, Pop 201 and Pop 202, consisting of 180 and 170 recombinant inbred lines (RILs), respectively, were used in this study. The phenotypic data for each population were collected from four environments. The linkage maps of Pop 201 and Pop 202 consisted of 421 and 416 polymorphic single nucleotide polymorphism (SNP) markers, respectively. Multiple QTL Mapping (MQM) analyses identified a total of 13 QTL for seed oil, 7 QTL for seed protein, and 6 for seed weight (SDWT). QTL for seed oil content not co-located with protein QTL were found on chromosomes 17 and 18 in multiple environments in Pop 201 and Pop 202, respectively. These QTL can be useful in reducing the inverse correlation between seed protein and seed oil contents. Most QTL found in this study are in previously reported genomic regions, and thus provide additional evidence for the stability of those QTL across genetic and environmental backgrounds. The findings of this study provide additional insight into the genetic control of these traits and potentially enable breeders to utilize the QTL-linked SNPs in marker-assisted selection (MAS).
Introduction
Soybean seed protein and oil are valuable traits because of the extensive use of soybean in the production of vegetable oil and meal. In 2019, soybean accounted for 59% of the total oilseed production worldwide and 56% of the total vegetable oil consumption in the USA (ASA Citation2019). Soybean meal is used extensively in feed as the main source of protein for poultry, livestock, and farmed fish (Patil, et al., Citation2017). In 2019, soybean comprised 69.3% of the total worldwide production of meal (ASA Citation2019). Cultivars with optimal protein and oil contents will add value by increasing efficiency in soybean meal and oil production. Additionally, it is important that an improvement in these seed composition traits does not compromise the overall yield of the crop.
Improving seed protein and yield simultaneously has been difficult because of a negative correlation that exists between seed protein and yield (Burton Citation1987). These two traits are quantitative in nature and are controlled through the simultaneous action of many genes, known as quantitative trait loci (QTL) (Li et al. Citation2019; Gupta et al. Citation2017; Patil, et al., Citation2017). The positions of these genes in the soybean genome, and how much of the variation in each trait they explain can be estimated through QTL mapping (Zeng Citation1994). The QTL indicate genomic regions which are associated with one or more of the quantitative traits (Zeng Citation1994). Genetic markers linked to these regions can then be utilized by breeders in MAS (Thomson et al. Citation2010; Collard and Mackill Citation2008) schemes to efficiently pyramid multiple valuable traits into a cultivar to be grown by farmers. To be effective in MAS, it is important that the effects of QTL linked to genetic markers have a substantial impact on the targeted phenotype and are stable across both environments and genetic background (Hospital et al. Citation1997).
Seed oil, seed protein, and yield have been extensively studied through QTL analyses in soybean. However, relatively few studies have identified QTL with reliable effects across environments and breeding populations. Multiple studies have identified large-effect QTL for protein content on chromosomes 15 (Patil, et al., Citation2017; Kim et al. Citation2016) and 20 (Mian et al. Citation2017; Bolon et al. Citation2010). QTL that are reliably found across different environments and genetic backgrounds are given the “confirmed” designation in the USDA-ARS Soybean genetics and genomics database (www.soybase.com). At the time of writing, 258 QTL for seed oil and 209 for seed protein have been reported. Of these QTL, only 16 for seed oil and 16 for seed protein have been confirmed.
The objectives of this study were to identify QTL and confirm previously reported QTL for seed oil, seed protein, and seed weight using two recombinant inbred line (RIL) soybean mapping populations. These two populations were grown in three environments to assess the stability of QTL across environments and genetic background.
Materials and methods
Plant materials and experimental design
Two RIL populations were utilized in this study. These populations are designated as Pop 201 and Pop 202. Each population was derived from crosses of inbred lines, which were observed to consistently differ in seed protein and seed oil content. Pop 201 was derived from a cross of the high-protein breeding line LMN09-119 and the high-oil breeding line N09-09 in 2015 (see additional information about parent pedigrees in figure S1). Pop 202 was developed from a cross of the high protein breeding line LMN09-19 and the high oil breeding line N13-47 also in 2015 (see additional information about parent pedigrees in figure S2). The RILs of the two mapping populations were advanced to F5 generation by single-seed descent (SSD) method of selection.
Ultimately, Pops 201 and 202 consisted of 224 and 197 F5-derived RILs, respectively. Each population was grown in a randomized complete block design with two replications at three locations. The locations used for the evaluations were the Central Crops Research Station in Clayton, NC, USA (CLA), the Tidewater Research Station in Plymouth, NC, USA (PLY), and the Caswell Research Farm in Kinston, NC, USA (CAS) in 2019.
Phenotypic data collection and statistical analysis
Seed protein and seed oil contents were measured using a Perten DA 7250 NIR spectrometer (AB, Perten Instruments Citation2016) and reported on a dry basis. Seeds were sifted and cleaned of debris, cracked seeds, and off-color seeds prior to measurement with the instrument. The seed weight (SDWT) was measured by manually counting and weighing 100 seeds from each plot.
Phenotypic data were analyzed at each location by a mixed model using the lme4 (Bates et al. Citation2015) package in the R statistical computing environment (Core Team Citation2013). In the statistical model, genotypes are treated as a fixed effect and replication as a random effect. Least square means were then obtained for each genotype with the emmeans (Lenth Citation2019) package in R. Phenotypic data were averaged across the three environments to create a fourth combined environment, where environment was considered a fixed effect.
Phenotypic correlation coefficients were calculated with Pearson’s correlation coefficient (EquationEquation 1(Eq. 1)
(Eq. 1) ). Calculations were made using the correlation (Makowski et al. Citation2020) package in R.
Phenotypic distributions for seed protein, seed oil, and SDWT were expressed as histograms and QQ plots to visually assess the normality of the phenotypic distributions and check for extreme outliers prior to QTL analysis (Figures S3, S4, S5, and S6).
SNP analysis
Whole-genome DNA was extracted from the youngest trifoliate leaf obtained from each F5 RIL using a Qiagen DNEasy Plant Mini kit following the manufacturer’s protocol. The extracted DNA quality was checked through visualization on a 2% agarose gel. DNA was sent to the USDA-ARS Soybean Genomics and Improvement Laboratory in Beltsville, Maryland, for SNP genotyping. RILs were genotyped using 5,403 SNP markers on the SoySNP6k Illumina Beadchip (Song et al. Citation2014). Genotype clusters were visualized and manually adjusted where appropriate, using the GenomeStudio (Illumina Citation2011) software following manufacturer’s guidelines.
Linkage mapping
SNPs were filtered within each population to remove monomorphic markers and markers with greater than 20% missing data. The RILs were filtered to retain only those lines with less than 25% missing data. Genetic clones within each population were identified and only one RIL from each clone set was kept. Filtering operations were performed using custom R scripts developed using the ASMap package (Taylor and Butler, Citation2017) in R. After filtering, each population consisted of 180 and 170 RILs for Pops 201 and 202, respectively.
Linkage maps were constructed for each population using the ASMap package in R. Marker positions were generally in good agreement with their expected positions in the Wm82.a2 genome assembly (Song et al. Citation2013).
QTL mapping
Least square means for seed protein, seed oil, and SDWT for each environment and the combined environment were used for QTL mapping. The qtl package (Broman et al. Citation2003) in the R programming environment was used to perform QTL mapping. MQM mapping was performed with 100 cofactors and a cofactor significance of 0.05. QTL significance thresholds were determined following an LOD threshold obtained from a genomewide permutation test (Churchill and Doerge Citation1994) using 1000 permutations. Identified QTL for seed oil, seed protein, and SDWT were named as Oil, Pro, and SDWT, followed by a number to designate individual QTL ().
Table 1. Phenotype trait values for the parents LMN09-119 and N09-09 and the derived RILs of mapping population 201 evaluated in three environments and averaged across environments. Values represent the means of parents and RILs, and the minimum, maximum, and standard deviation of the RILs
Table 2. Phenotype trait values for the parents LMN09-19 and N13-47 and the F2-derived RILs of mapping population 202 evaluated in three environments and averaged across environments. Values represent the means of parents and RILs, and the minimum, maximum, and standard deviation of the RILs
Table 3. Quantitative trait loci (QTL) detected for seed oil in the soybean recombinant inbred line Population 201 and Population 202 grown in multiple locations in North Carolina
Results
Linkage maps
The linkage map for Pop 201 had an average marker spacing of 6.24 cM, and an average of 21.1 markers per linkage group (Table S1). The number of markers per linkage group for the Pop 201 map ranged between 6 on chromosome 11 (LG B1) and 37 on chromosome 14 (LG B2). The map for Pop 202 had an average spacing of 5.76 cM and an average of 20.8 markers per linkage group (Table S2). The number of markers per linkage group for the Pop 202 linkage map ranged between four markers on chromosome 4 (LG C1) and 40 on chromosome 15 (LG E).
Phenotypic distributions and correlations
Seed protein, seed oil, and SDWT were approximately normally distributed in all environments and in both populations, indicating that these traits were suitable for QTL mapping analysis.
Seed oil content ranged from 185 g kg−1 to 252 g kg−1, with an average of 213 g kg−1 in Pop 201 (, ) and from 179 g kg−1 to 258 g kg−1, with an average of 218 g kg−1 in Pop 202 (, ). Seed protein content ranged from 342 g kg−1 to 517 g kg−1, with an average of 453 g kg−1 in Pop 201 (, ) and from 362 g kg−1 to 511 g kg−1, with an average of 455 g kg−1 in Pop 202 (, ). SDWT ranged from 10.8 g to 20.9 g, with an average of 15.62 g in Pop 201 (, ) and from 9.60 g to 22.50 g, with an average of 16.44 g in Pop 202 (, ).
Figure 1. Frequency histograms for the distribution of (A) seed oil (g/Kg−1), (B) seed protein (g/Kg−1), and (C) seed weight (grams per 100 seeds) of 180 RILs of LMN09-119 (P1) x N09-09 (P2) (Pop 201) and 170 RILs of LMN09-19 (P3) x N13-47 (P4) (Pop 202). Measurements are averaged over three environments from the Central Crops Research Station in Clayton, NC, the Tidewater Research Station in Plymouth, NC, and the Caswell Research Farm in Kinston, NC
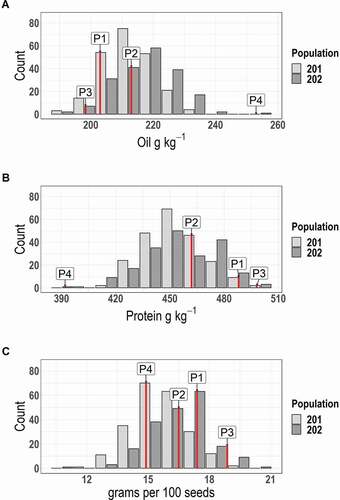
Transgressive segregation was observed for seed oil, seed protein, and SDWT in Pop 201 (, ). Few cases of segregation distortion were observed for seed oil and seed protein in Pop 202, but significant transgressive segregation was observed for SDWT in Pop 202 (, ). The inbred parents of Pop 201 were on average more like each other in their protein and oil contents when compared with the parents of Pop 202, which tended to have extreme scores in seed protein and seed oil (; ).
Pairwise correlation coefficients for each population were calculated with the mean phenotype data across environments. In Pop 201, seed protein and seed oil were negatively correlated (R2 = 0.66), SDWT and seed protein had a negligible positive correlation (R2 = 0.03) and there was no significant correlation between SDWT and seed oil (Table S3). Seed protein and seed oil were also negatively correlated in Pop 202 (R2 = 0.74) Neither seed oil nor seed protein were significantly correlated with SDWT in Pop 202 (Table S4).
Seed oil QTL
Thirteen total QTL for seed oil were discovered and mapped to chromosomes 2, 4, 8, 14, 15, 17, 18, and 20 (). These QTL explained between 0.24% and 42.9% of the phenotypic variation explained (PVE) in seed oil content and had additive effects between 0.04 and 0.60 (, Figure S7, Figure S8, Figure S9, and Figure S10). Among these QTL were Oil1, Oil2, and Oil3, which were found in both populations and in multiple environments. Oil1 was found on chromosome 14 (LG B2) in the PLY environment for Pop 201 and in the combined environment and in PLY environment for Pop 202. Oil2 was found on chromosome 15 (LG E) in the CAS and combined analyses for both populations. Oil3 was found on chromosome 20 (LG I) in the CAS, CLA and combined environments for Pop 201; and the CLA and combined environments for Pop 202. Oil1 and Oil3 were co-located with seed protein QTL Pro1 and Pro2. The Oil4, Oil5, and Oil6 QTL were each found in a single population, but in multiple environments. Oil4 was found on chromosome 2 (LG D1b) in the combined and PLY environments for Pop 202, Oil5 was found on chromosome 17 (LG D2) in the combined and CLA environments for Pop 201, and Oil6 was found on chromosome 18 (LG G) in the CAS, CLA, and combined environments for Pop 201. The remaining QTL, designated as Oil7-Oil13, were only found in a single environment and population.
Seed protein QTL
Seven QTL for seed protein were found on chromosomes 2, 4, 14, 15, and 20 (, Figure S9, Figure S10, Figure S11, and Figure S12). These QTL explained between 0.16% and 44.0% of the PVE and had additive effects, which ranged between −1.53 and 0.41 (). The Pro1 and Pro2 QTL were found on chromosomes 14 and 20 and were co-located with Oil1 and Oil3, respectively (). Like Oil1 and Oil3, these QTL were observed in multiple populations and environments. Pro1 was found in the CAS and PLY environments in Pop 201 and in the PLY and combined environments in Pop 202. Pro2 was found in all environments in Pop 201, and in CAS, CLA, and combined environments in Pop 202. QTL Pro3 and Pro4 were found in multiple environments only in Pop 202. Pro3 was found on chromosome 2 (LG D1b), and was co-located with the Oil4 QTL, and was found in the CLA, PLY, and combined environments in population 202. Pro4 was found on chromosome 15 (LG E) in the CAS and combined environments in population 201. This QTL is co-located with the Oil2 QTL. The Pro5, Pro6, and Pro7 QTL each was found in a single environment and population.
Table 4. Quantitative trait loci (QTL) detected for seed protein in the soybean recombinant inbred line Population 201 and Population 202 grown in multiple locations in North Carolina
SDWT QTL
Six SDWT QTL were discovered on chromosomes 9, 12, 13, 14 15, and 20. These QTL explained between 1.84 and 14% of the PVE for SDWT, with additive effects ranging between −0.64 and 0.66 (, Figure S9, and Figure S10, Figure S13, and Figure S14). No SDWT QTL were found in both populations and multiple environments. However, SDWT1 was found in multiple environments in Pop 202, SDWT2 was found in a single environment in both Pop 201 and Pop 202, and SDWT3 was found in three environments in Pop 201. SDWT1 was found on chromosome 13 (LG F) in the CAS and combined environments in Pop 202. SDWT2 was found on chromosome 15 (LG E) and was co-located with the Oil2 and Pro4 QTL. SDWT2 was also found in Pop 201 in the combined and the PLY environments in Pop 202. SDWT3 was found on chromosome 20 (LG I) and was co-located with the Oil3 and Pro3 QTL, and was also found in the CAS, PLY, and combined environments in Pop 201. The remaining SDWT QTL, SDWT4, SDWT5, and SDWT6 were each found in a single environment and population.
Table 5. Quantitative trait loci (QTL) detected for seed weight in the soybean recombinant inbred line Population 201 and Population 202 grown in multiple locations in North Carolina
QTL stability
Three QTL for seed oil content and two QTL for seed protein were mapped to similar genetic regions in both populations. Each QTL was detected in multiple environments as well. An oil QTL (Oil1) was found at approximately 14 cM on chromosome 14 (LG B2) in the PLY environment in Pop 201, and in the PLY and combined environments in Pop 202 (). This QTL was co-located with a protein QTL (Pro1, ), which was detected in the CAS and PLY environments in Pop 201, and the combined and PLY environments in Pop 202. The QTL explained between 9.07% and 19.29% of the variation in oil content, with additive effects between 0.30 and 0.52, and between 3.4% – 24.6% of the variation in protein content, with additive effects between −1.53 and 0.41. A second QTL for oil content (Oil2) was found at approximately 74 cM on chromosome 15 (LGE). This QTL was detected in the Caswell and combined environments in both populations and explained between 3.5% and 7.4% of the variation in oil content, with additive effect ranging between 0.16 and 0.30. An additional QTL was detected for both oil and protein (Oil3, Pro2) on chromosome 20 (LG I). The QTL for protein and oil was detected at approximately 30 cM for both traits in Pop 201, and at approximately 53 cM in Pop 202. This QTL explained between 10.6% and 42.9% of the variation in seed oil content, with additive effect ranging between 0.31 and 0.60, and between 6.8% and 44.0% of the variation in seed protein content, with additive effect ranging between −1.06 and −0.52.
Discussion
To be effective in a marker-assisted breeding program, there should be evidence that the QTL under consideration will have a significant effect on a phenotype under diverse environments and genetic backgrounds (Singh and Singh Citation2015; Brummer et al. Citation1997; Hospital et al. Citation1997; Lande and Thompson Citation1990). Many of the QTL found in this study were found in only one of the mapping populations but were detected in multiple environments. These QTL have been found in similar genetic regions in many previous mapping studies and, as such, would likely still be good considerations for inclusion in a marker-assisted breeding scheme.
In this study, the large-effect QTL on chromosome 20 was detected for both protein and oil traits (Pro2 and Oil3). This QTL has been found in many mapping studies (Bolon et al. Citation2010; Chung et al. Citation2003; Sebolt, Shoemaker, and Diers Citation2000; Diers et al. Citation1992) for oil and protein content and its validation in the current study is further evidence of its stability. This is a large-effect QTL, which is known to have a large additive effect for both seed oil and seed protein content that has been observed across different genetic backgrounds and environments (Patil, et al., Citation2017). In the current study, this QTL had an exceptionally high PVE and additive effect for both seed oil and seed protein traits (, ). Previous studies have also focused on this QTL because of its observed large additive effect with respect to seed protein content, and its negative correlation with seed oil content (Patil, et al., Citation2017). A fine mapping study successfully mapped this QTL to a 3 cM interval and designated this QTL as a “confirmed” QTL, (cqOIL-004), following the rules of the Soybean Genetics Committee (Nichols et al. Citation2006). The findings of these previous studies were confirmed by our study, which observed a QTL in a similar genetic region with a large additive effect for seed protein content that exhibited an inverse correlation with seed oil content, as indicated by the opposite signs on the additive effects for the protein and oil QTL at this site. The observed inverse correlation with oil content indicates that the markers linked with this QTL in this study are unlikely to be useful to break the inverse correlation between seed protein and seed oil contents when used in MAS. However, the findings of this study further validate the importance of this genetic region for the control of seed protein and seed oil content in soybean.
The Oil2 QTL found in this study on chromosome 15 (LG E) was found near only a single previously reported QTL for oil content (Mao et al. Citation2013) and no previously reported QTL for protein content. The authors of this previous study were able to detect the QTL in multiple mapping populations and environments. The PVE and additive effect of the QTL reported in this previous study were also comparable with our findings. The QTL in this previous study had a PVE of 5% to 7% and an additive effect between 0.06 and 0.14, which is comparable to the PVE and additive effect observed for Oil2 in this study (). Oil2 was found in both populations and in multiple environments in this study. Furthermore, QTL Pro4 and SDWT2 were found in the same region as Oil2 but were only found in Pop 201, which would suggest that the QTL underlying this site is more strongly associated with seed oil than seed protein or seed weight. Oil2 represents a potentially new and stable QTL for oil content that merits further investigation as a candidate for MAS. The localization of Oil2 in a genetic region with few previously reported protein QTL, and a seed oil QTL with similar effects makes this particularly valuable for MAS.
The Oil6 QTL was also detected in multiple environments and was found on chromosome 18 at a region with relatively few previously reported seed protein QTL and was not associated with protein content in the current study (). Previous studies have identified QTL for seed protein, seed oil, and seed yield within 10 cM of Oil6 (Reinprecht et al. Citation2006). The oil QTL in this region reported in the previous study had an additive effect of 1.81 g.kg−1 and a PVE of 8.0%. Although Oil6 was not found in Pop 201 in the current study, the presence of seed oil QTL in a similar genetic region in previous mapping studies provides additional evidence of the presence and stability of a seed oil QTL at this site.
The Oil5 QTL found on chromosome 17 (LG D2) was not found to be co-located with a protein QTL in this study and at the time of writing no seed protein QTL have been reported within 20 cM of this position. However, Oil5 is co-located with a previously reported seed linoleic acid QTL (Ha et al. Citation2014). This previous study detected a QTL associated with seed alanine composition in two environments, which explained 7.0% and 8.0% of the phenotypic variation in the linoleic acid composition for the two environments, respectively. The Oil5 QTL found in this study exhibited comparable seed oil PVE to this previous study ().
While Oil5 was not found in both the populations used in this study, the fact that no protein QTL were found in this region in this study or previous studies, coupled with the previous finding of a seed oil QTL at the site, is indicative of a QTL with potential to reduce the inverse correlation between seed oil and seed protein. Such a QTL warrants further investigation with additional populations and environments, as it may represent a rare QTL with the potential to break the inverse correlation between seed oil and seed protein contents.
Many of the QTL found for these three traits were co-located with one another, suggesting some degree of pleiotropy or linkage among the genes that control each of these traits. The evidence for overlap in the genetic control of these traits agrees with the well-documented phenotypic correlation among these traits, which was observed in this study as well. A precise definition of whether this correlation is attributable to pleiotropy or close linkage can only be established using a denser set of markers in a fine mapping strategy using a larger mapping population, which cannot be conclusively determined with the current data.
Conclusions
Many of the QTL found in this study match well with previously found QTL for the same traits, and a tentative novel QTL on chromosome 15 (LG E) was found for seed oil in multiple environments and populations. QTL for seed oil content, which were not co-located with protein QTL, were found on chromosomes 17 and 18 in a single mapping population and in multiple environments. The utilization of these QTL may help reduce the inverse relationship between seed oil and protein to produce high-yielding soybean lines with optimal levels of protein and oil contents.
Disclosure statement
No potential conflict of interest was reported by the author(s).
References
- AB, Perten Instruments. 2016. DA 7250 Installation and Operation Manual. Hagersten, Sweden: Perten Instruments AB.
- ASA. 2019. “Soy Stats. A Reference Guide to Important Soybean Facts and Figures.”
- Bates, D., M. Machler, B. M. Bolker, and S. C. Walker. 2015. “Fitting Linear Mixed-Effects Models Using Lme4.” Journal of Statistical Software 67 (1): 1–48. doi:https://doi.org/10.18637/jss.v067.i01.
- Bolon, Y. T., B. Joseph, S. B. Cannon, M. A. Graham, B. W. Diers, A. D. Farmer, G. D. May, et al. 2010. “Complementary Genetic and Genomic Approaches Help Characterize the Linkage Group I Seed Protein QTL in Soybean.” Bmc Plant Biology 10 (1): 24. doi:https://doi.org/10.1186/1471-2229-10-41.
- Broman, K. W., W. Hao, Ś. Sen, and G. A. Churchill. 2003. “R/QTL: QTL Mapping in Experimental Crosses.” Bioinformatics 19 (7): 889–890. doi:https://doi.org/10.1093/bioinformatics/btg112.
- Brummer, E. C., G. L. Graef, J. Orf, J. R. Wilcox, and R. C. Shoemaker. 1997. “Mapping QTL for Seed Protein and Oil Content in Eight Soybean Populations.” Crop Science 37 (2): 370–378. doi:https://doi.org/10.2135/cropsci1997.0011183X003700020011x.
- Burton, J. W. 1987. “Quantitative Genetics: Results Relevant to Soybean Breeding.” Agronomy (USA), 16: 211–47.
- Chung, J., H. L. Babka, G. L. Graef, P. E. Staswick, D. J. Lee, P. B. Cregan, R. C. Shoemaker, and J. E. Specht. 2003. “The Seed Protein, Oil, and Yield QTL on Soybean Linkage Group I.” Crop Science 43 (3): 1053–1067. doi:https://doi.org/10.2135/cropsci2003.1053.
- Churchill, G. A., and R. W. Doerge. 1994. “Empirical Threshold Values for Quantitative Trait Mapping.” Genetics 138 (3): 963–971. doi:https://doi.org/10.1093/genetics/138.3.963.
- Collard, B. C. Y., and D. J. Mackill. 2008. “Marker-assisted Selection: An Approach for Precision Plant Breeding in the Twenty-first Century.” Philosophical Transactions of the Royal Society B-Biological Sciences 363 (1491): 557–572. doi:https://doi.org/10.1098/rstb.2007.2170.
- Core Team, R. 2013. “R: A Language and Environment for Statistical Computing.”
- Diers, B. W., P. Keim, W. R. Fehr, and R. C. Shoemaker. 1992. “Rflp Analysis of Soybean Seed Protein and Oil Content.” Theoretical and Applied Genetics 83 (5): 608–612. doi:https://doi.org/10.1007/bf00226905.
- Gupta, M., P. B. Bhaskar, S. Sriram, and P. H. Wang. 2017. “Integration of Omics Approaches to Understand Oil/protein Content during Seed Development in Oilseed Crops.” Plant Cell Reports 36 (5): 637–652. doi:https://doi.org/10.1007/s00299-016-2064-1.
- Ha, B. K., H. J. Kim, V. Velusamy, T. D. Vuong, H. T. Nguyen, J. G. Shannon, and J. D. Lee. 2014. “Identification of Quantitative Trait Loci Controlling Linolenic Acid Concentration in PI483463 (Glycine Soja).” Theoretical and Applied Genetics 127 (7): 1501–1512. doi:https://doi.org/10.1007/s00122-014-2314-y.
- Hospital, F., L. Moreau, F. Lacoudre, A. Charcosset, and A. Gallais. 1997. “More on the Efficiency of Marker-assisted Selection.” Theoretical and Applied Genetics 95 (8): 1181–1189. doi:https://doi.org/10.1007/s001220050679.
- Illumina, I. 2011. GenomeStudio Software 2011.1. San Diego:: Illumina.
- Kim, M., S. Schultz, R. L. Nelson, and B. W. Diers. 2016. “Identification and Fine Mapping of a Soybean Seed Protein QTL from PI 407788A on Chromosome 15.” Crop Science 56 (1): 219–225. doi:https://doi.org/10.2135/cropsci2015.06.0340.
- Lande, R., and R. Thompson. 1990. “Efficiency of Marker-assisted Selection in the Improvement of Quantitative Traits.” Genetics 124 (3): 743–756. doi:https://doi.org/10.1093/genetics/124.3.743.
- Lenth, R. 2019. “emmeans: Estimated marginal means, aka least-squares means. R package version 1.4. 3.01.”
- Li, S. G., H. F. Xu, J. Y. Yang, and T. J. Zhao. 2019. “Dissecting the Genetic Architecture of Seed Protein and Oil Content in Soybean from the Yangtze and Huaihe River Valleys Using Multi-Locus Genome-Wide Association Studies.” International Journal of Molecular Sciences 20 (12): 18. doi:https://doi.org/10.3390/ijms20123041.
- Makowski, D., M. S. Ben-Shachar, I. Patil, and L. Daniel. 2020. “Methods and Algorithms for Correlation Analysis in R.” Journal of Open Source Software 5 (51): 2306. doi:https://doi.org/10.21105/joss.02306.
- Mao, T. T., Z. F. Jiang, Y. P. Han, W. L. Teng, X. Zhao, and W. B. Li. 2013. “Identification of Quantitative Trait Loci Underlying Seed Protein and Oil Contents of Soybean across Multi-genetic Backgrounds and Environments.” Plant Breeding 132 (6): 630–641. doi:https://doi.org/10.1111/pbr.12091.
- Mian, M. A., L. McHale, L. Zenglu, and A. E. Dorrance. 2017. “Registration of ‘Highpro1’soybean with High Protein and High Yield Developed from a North$\times$ South Cross.” Journal of Plant Registrations 11 (1): 51–54. doi:https://doi.org/10.3198/jpr2016.03.0013crc.
- Nichols, D. M., K. D. Glover, S. R. Carlson, J. E. Specht, and B. W. Diers. 2006. ““Fine Mapping of a Seed Protein QTL on Soybean Linkage Group I and Its Correlated Effects on Agronomic Traits.”.” Crop Science 46 (2): 834–839. Qiagen. 2016. DNEasy Plant Mini Kit. doihttps://doi.org/10.2135/cropsci2005.05-0168.
- Patil, G., R. Mian, T. Vuong, V. Pantalone, Q. J. Song, P. Y. Chen, G. J. Shannon, T. C. Carter, and H. T. Nguyen. 2017. “Molecular Mapping and Genomics of Soybean Seed Protein: A Review and Perspective for the Future.” Theoretical and Applied Genetics 130 (10): 1975–1991. doi:https://doi.org/10.1007/s00122-017-2955-8.
- Reinprecht, Y., V. W. Poysa, K. F. Yu, I. Rajcan, G. R. Ablett, and K. P. Pauls. 2006. “Seed and Agronomic QTL in Low Linolenic Acid, Lipoxygenase-free Soybean (Glycine Max (L.) Merrill) Germplasm.” Genome 49 (12): 1510–1527. doi:https://doi.org/10.1139/g06-112.
- Sebolt, A. M., R. C. Shoemaker, and B. W. Diers. 2000. “Analysis of a Quantitative Trait Locus Allele from Wild Soybean that Increases Seed Protein Concentration in Soybean.” Crop Science 40 (5): 1438–1444. doi:https://doi.org/10.2135/cropsci2000.4051438x.
- Singh, B. D., and A. K. Singh. 2015. Marker-assisted Plant Breeding: Principles and Practices. New Dehli: Springer.
- Song, Q. J., D. L. Hyten, G. F. Jia, C. V. Quigley, E. W. Fickus, R. L. Nelson, and P. B. Cregan. 2013. “Development and Evaluation of SoySNP50K, a High-Density Genotyping Array for Soybean.” Plos One 8: 1. doi:https://doi.org/10.1371/journal.pone.0054985.
- Song, Q., G. Jia, C. V. Quigley, E. W. Fickus, D. Hyten, R. L. Nelson, and P. B. Cregan. 2014. Soybean BARCSoySNP6K Beadchip: A Tool for Soybean Genetics Research. Paper presented at the Poster presented at: plant and animal genome XXII conference, San Diego, CA, USA, 2014//.
- Taylor J, and Butler D. (2017). R Package ASMap: Efficient Genetic Linkage Map Construction and Diagnosis : Efficient Genetic Linkage Map Construction and Diagnosis. Journal of Statistical Software, 79(6), https://doi.org/10.18637/jss.v079.i06
- Thomson, M., Ismail, A., Mccouch, S, and Mackill, D. 2010. Abiotic Stress Adaptation in Plants: Physiological, Molecular and Genomic Foundation. Marker Assisted Breeding. doi:https://doi.org/10.1007/978-90-481-3112-9_20
- Zeng, Z. B. 1994. “Precision Mapping of Quantitative Trait Loci.”.” Genetics 136 (4): 1457–1468. doi:https://doi.org/10.1093/genetics/136.4.1457.