
ABSTRACT
Breeders routinely evaluate many experimental hybrids that may be of different maturities. In maize (Zea mays L.), days to 50% anthesis and percent grain moisture content are used as proxies for relative maturity. The lack of an easy-to-use statistical tool that gives yield potential of all entries in a trial while classifying them into different relative maturity categories in a single visualization makes it difficult to quickly assess superior genotypes. We report on a tool called REMATTOOL-R to aid breeders in visualizing and assessing the relationship between yield and certain agronomic traits, viz., days to anthesis, percent harvest grain moisture content, and number of harvested plants, and help them in advancing experimental hybrids to the next stage. REMATTOOL-R uses either Best Linear Unbiased Estimators (BLUEs) or Best Linear Unbiased Predictors (BLUPs) of yield and agronomic traits from multilocation trials to perform various computations. The various computations produce graphical and tabular visualizations of the relationship between grain yield and days to anthesis, moisture content, and number of harvested plants that can be used to support selection decisions by the breeder. REMATTOOL-R output tables show entries with at least 5% higher yield than the check varieties in the trial. REMATTOOL-R is a robust, simple, user-friendly, and easily comprehensible tool, convenient for identifying superior genotypes during all the trial stages of a maize breeding program. REMATTOOL-R will be useful to breeders and researchers in related disciplines.
Introduction
Maize (Zea mays L.) breeding programs conduct multi-environment trial analyses (META) with the objective of identifying improved high-yielding and stable genotypes for different ecologies and environments targeted by the breeding program. In sub-Saharan Africa, it is common to evaluate maize hybrids with somewhat different maturities in a single trial. In general, grain yield is considered the most important trait in the national performance trials (NPTs) and the preceding evaluation trials. Thus, maize hybrid selections for advancement are made mostly for high grain yield, and often late-maturing varieties can be inadvertently selected for advancement unless a conscious effort is made to get the appropriate variety for the early and medium maturity ranges.
Grain yield is positively correlated with maturity (Pavan et al. Citation2011). Hence, the full justification for advancement of a new hybrid should be made after ensuring that it has been compared with check varieties of the same relative maturity. With no conscious effort to maintain the relative maturity when breeding for high yield levels, there will be a risk of a gradual increase in the number of days to maturity of the new varieties for a given ecology, which, if unchecked, can, in the long run (more than five years), lead to the inadvertent development of high yielding but later-maturing varieties than the original check varieties for the different ecologies. Furthermore, the inadvertent increase in the maturity of varieties would be disadvantageous under the anticipated scenarios of climate change, where the cropping seasons are expected to be abbreviated as desertification and intense droughts are expected to increase in most of the agro-ecologies of sub-Saharan Africa (Boko et al. Citation2007; IPCC Citation2014).
There are several software packages that are used to conduct analyses of variance (ANOVA) and mixed model analysis to generate BLUEs or BLUPs for the different agronomic traits that the breeder/researcher generally uses to identify the highest-yielding varieties for advancement relative to the best check. In extended analyses, the breeders conduct genotype × environment (G × E) interaction analyses to identify genotypes for general or specific adaptation (Yan Citation2001; Gauch Citation2006; Yan et al. Citation2007; Yan Citation2014; Badu-Apraku et al. Citation2020). These extended G × E analyses involve intellectual sophistication that is beyond the level of some of the participants in variety release committees or panels. Furthermore, most of the general statistical analyses are conducted by breeders with much emphasis on high yield levels, and with little emphasis on relative maturity. This emphasis on yield can result in the variety selected as best-yielding not being of the desired or intended maturity, especially in trial sets where there is a wide range of days to relative maturity, and when a proxy for relative maturity is not used as a covariate in the ANOVA for yield.
In the variety-advancement process, commonly followed by public sector breeders in the developing world, first, mean varietal performance for grain yield and other agronomic traits (least square means, BLUEs, BLUPs) from traditional ANOVA is tabulated in columns and rows. Next, the breeder then manually identifies the best entries for each trait. However, this process is repetitive and cumbersome when one is interested in identifying the best-yielding genotypes for each maturity group. The CIMMYT Fieldbook Software (Vivek et al. Citation2007) is commonly used by several public-sector breeding programs in Eastern and Southern Africa to group hybrids according to days to anthesis (which is a proxy for relative maturity) in a summary table of mean values of the traits, as shown in . Next, the best-yielding variety from each maturity set is selected in a manner similar to Vivek, Bänziger, and Pixley (Citation2001), Makumbi (Citation2011) and Setimela et al. (Citation2012).
Figure 1. Extract of results of the 2011/12 CIMMYT Regional Trials for Eastern Africa (Extracted from (Makumbi, Citation2011)).
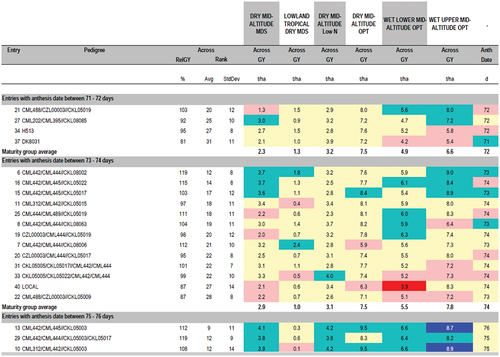
The different maturity classes presented in are meant to manage the variety-advancement process by grouping together varieties of the same relative maturity and ensuring that they are compared against both the corresponding check and among themselves, but it does not present a visualization of the relative yield levels and relative maturities of all the entries in a trial in a single step. However, it would be more informative if the grain yield performances of all the genotypes and the maturity classes in a trial can be visualized in a single step to allow the breeder to select correct entries that meet both selection criteria, i.e. high yield and proper relative maturity.
Another trait that is used as a proxy for relative maturity or harvest time is percent grain moisture content at harvest. Where grain moisture content is used as a proxy for relative maturity, it would be desirable to advance varieties in each relative maturity category, which are not significantly different in maturity from the check variety. It is also important to advance varieties based on genuine genetic yield differences and not biased by differences in factors like plant stand at harvest. Thus, it would be important to explore the relationship between grain yield and plant stand in each trial and visualize how it influences the comparisons between the check variety and the new entries that are to be advanced. This can avoid the erroneous advancement of entries based on advantages stemming from high plant population densities.
However, currently, after compiling tables of trait means, post ANOVA, there is no efficient and effective tool to assist the breeder in speedily conducting variety selection for high-yielding varieties while ensuring that relative maturity of the advanced variety remains the same as the check. Thus, it would be desirable to provide the researcher with a simple tool for quickly identifying high-yielding varieties within each relative maturity category. The main objective of this paper is to describe REMATTOOL-R, a statistical tool that we have developed to allow plant breeders to visualize and utilize the relationship between grain yield, relative maturity proxies (days to 50% anthesis or percent grain moisture content), and plant stand to identify superior varieties in a single step, regardless of whether the trial was conducted at a single location or in multiple environments.
Materials and methods
Implementation
Program description and requirements
REMATTOOL-R, is an R-based Function that can be run via a REMATTOOL Graphic User Interface (GUI) that works in R Studio (R Studio Team, Citation2020) or R (R Core Team, Citation2021). For installation of R, please visit https://cran.r-project.org/bin/windows/base/ and for R Studio, please visit https://www.rstudio.com/products/rstudio/#rstudio-desktop and choose the right option according to your operating system. The steps for preparing R-Studio or R to run REMATTOOL are given in Appendix I. To set up REMATTOOL, the user needs to download the zipped REMATTOOL files from the CIMMYT Dataverse webpage (https://hdl.handle.net/11529/10548413) into the chosen working folder for REMATTOOL. Then, extract the contents of the zipped file to get an executable Windows Batch File named REMATTOOL.bat and a folder named REMATTOOL_Support.
Before the user can successfully use REMATTOOL-R, packages “lattice,“ “latticeExtra,” ”RColorBrewer,” ‘plotly,’ ‘GGally,’ ‘ggplot,’ and ‘xlsx’ should be installed in R Studio or R. The REMATTOOL Windows Batch File and the input data file are kept in the designated working directory for R Studio or R. To use REMATTOOL, one should have a Microsoft Excel Comma Separated Value (CSV) input file with agronomic trait mean summary table of results, such as BLUEs, BLUPs, or least square (LS) means and the relevant statistics (LSD and CV) from ANOVA. The input data file should have the following design variables and measured trait columns: entry, name of entry, pedigree of entry, mean yield, days to anthesis, grain moisture content at harvest, and number of harvested plants. These columns can be named differently, but there should be no empty spaces between any two characters in the column header, and the columns for measured traits should have the LSD values. Other trait means and corresponding statistics can be part of the same CSV input file even though REMATTOOL will not utilize them. Regardless of origin, the CSV input file should be formatted to the same extent as the example file shown in Appendix II.
Example showing the working of REMATTOOL-R
The example data are from the BLUEs and BLUPs result table of agronomic traits from a Stage-II trial named WET16A-EVALIITWC-14. This trial, with 45 entries, was conducted under the International Center for Maize and Wheat Improvement (CIMMYT)’s Water Efficient Maize for Africa (WEMA) project in 2016A (March to May long rains growing season in Kenya) across five locations. The experimental design was an alpha lattice with (5 × 9) blocks, each with two replications and 5-m-long 2-row plots, 75-cm spacing between rows and 25-cm spacing between plants within a row. The trial had five checks (entries 41 to 45). Data on agronomic traits (yield, days to anthesis, grain moisture, and plant stand at harvest) from the five locations were successfully collected and analyzed. The results summarized across locations are presented in Appendix II. The CSV input file for REMATTOOL-R can have BLUEs or BLUPs or LS means from a single location or multiple locations. It is advisable to use REMATTOOL-R on individual-site data prior to producing the combined analyses so that an informed decision can be made on whether or not to include flowering data from some of the sites in across-sites analysis.
Steps to use REMATTOOL-R
Create a Comma-Separated Value (CSV) file of the input data with either LS means or BLUEs and/or BLUPs. The CSV input data file with agronomic trait mean values and statistical parameters of the analyzed traits should be in the working directory for R Studio or R. In this example, the file is WET16A-EVALIITWC-14.csv.
Insert a new column titled “Check” in the CSV file preferably next to the column for variety names or pedigrees or before the yield values column.
Populate the column titled “Check,” by identifying each of the checks with a numeric value of one (1) and each of the experimental varieties with a numeric value of zero (0).
Ensure that the row headers for the statistics (LSD, CV, etc.) are in the name column of the input file. The name column should preferably be the second column.
Ensure that there are no empty spaces among the characters for the headers of each column to be used in the analyses (entry, name of entry, pedigree of entry, mean yield, days to anthesis, grain moisture content at harvest, number of harvested plants). Underscores can be used to eliminate the empty spaces between the characters in the column headers
Save the input data file with means and statistical parameters for either all the trait columns or only for the trait columns of interest.
Launch the application by clicking on the REMATTOOL-R Windows Batch File (REMATTOOL.bat) to get a final screen that appears as shown in .
Figure 2. Homepage of REMATTOOL-R.
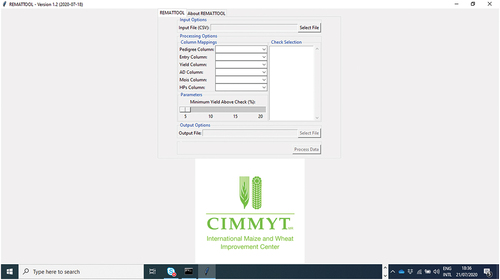
In the REMATTOOL application window shown in , against the “Input File (CSV)” tab, click the “Select File” icon to access and locate the input file.
On the REMATTOOL application screen, under the column mappings section, work through the pull-down windows, selecting the corresponding column in the input file for each of the specified column tabs in the REMATTOOL menu, which are as follows: “Pedigree column” = Pedigree; “Entry Column” = Entry; “Yield Column” = BLUP_Yield; “AD Column” = DAS (days to 50% anthesis); “Mois Column” = Mois (percent moisture content at harvest); “HPs Column” = HPs (plant stand or number of harvested plants). At this stage, the “Check Selection” box of the REMATTOOL screen will be populated with the pedigrees from the “Pedigree” column of the input file.
Select all the check varieties by clicking on each of the check varieties under the “Check Selection” box. If the user wishes to use a mean (or average) value of several check varieties in determining varieties to be advanced, this can be calculated first for all the traits that are mentioned above and are to be used in the column tabs in (9) above.
Use the sliding bar under the “Parameters” tab to indicate the desired “Minimum Yield Above the Check,” which can be 5%, 10%, 15%, or 20% for the minimum yield % above the corresponding check for each of the selected varieties. For simplicity, a minimum yield advantage of 10% was used in this example to select experimental entries for advancement.
Under output options, indicate the prefix that will be used in naming the output files against the “Output File” window by clicking the “Select File” button, and provide a root prefix for naming the output files. Give an appropriate prefix.
When steps 1–12 are completed, click the “Process Data” button to get the output. Depending on the number of selected checks, this can take a few minutes and when processing is successfully done, there will be a message as shown in . The results files will be stored in the specified working directory.
Figure 3. REMATTOOL screen after successfully processing the data.
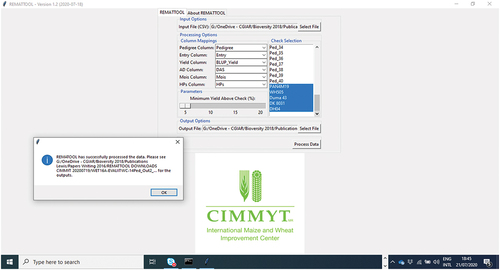
If the background script did not run correctly, there will be a few or no output files saved in the working directory/folder. Also, the output message shown in will not be displayed. Possible reasons for not getting output include empty spaces in the naming of the headers for the trait columns “Column Mappings,” listing the row headers for the statistics (LSD, CV, etc.) in a column other than the “name” column of the input file created above.
The output graphs (x-y graphs) and excel tables of results for each specified check variety will be in the same working directory for R Studio or R and named according to the prefix (root) name specified for the output files.
Results
General description of output
REMATTOOL-R plots and presents individual x-y graphs of mean grain yield against mean days to 50% anthesis, mean grain yield against mean grain moisture content (%), and mean grain yield against mean plant stand at harvest. It also presents an interactive combo of the above-mentioned x-y graphs and the trait correlations. Thus, using data from the tables of agronomic trait means, REMATTOOL presents, in a single visualization, yield and relative maturity (based on days to anthesis or grain moisture content) of all the varieties while showing the best-yielding variety in relation to each of the included checks. In addition, there will be tabulated Excel file outputs corresponding to the number of check entries. Each Excel output file presenting seven different tabs or worksheets is described in detail in the sections after Graph Outputs.
Graph outputs
Yield against days to 50% anthesis x-y graph
The x-y graph of grain yield against days to 50% anthesis is presented in , which shows the relative positions (maturity) of the commercial checks (identified by both their names and entry numbers) with the extra early-maturing ones appearing on the extreme left-hand side, whereas the later-maturing ones on the extreme right-hand side and the medium-maturing ones in between. Thus, before proceeding with the interpretation of the results, there is a need to confirm whether the relative order of the days to 50% anthesis of the different commercial checks conforms to the known expectations.
Figure 4. Graph of yield (t/ha) against number of days to anthesis. The labels are entry numbers and names.
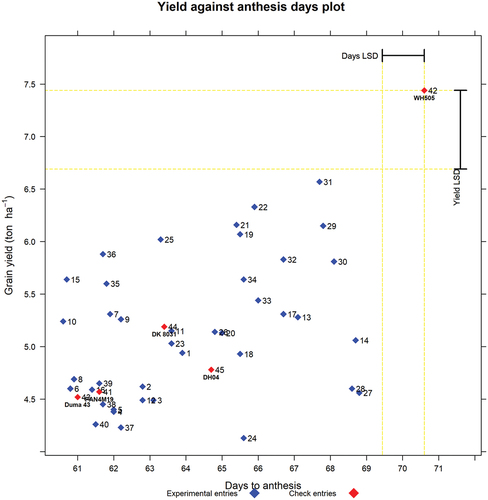
Fortuitously, the x-y graphical output in presents the expected relative order of the commercial check varieties arranged in the ascending order of days to 50% anthesis for check entries Duma 43, PAN4M19, DK8031, DH04, and WH505. Therefore, the flowering data are considered reliable and can be used to identify the higher-yielding experimental varieties that are in the same category as each of the commercial checks. Thus, in a single visualization, new entries that are of the same relative maturity as the chosen check and yield higher than the check can be easily identified. To get more information on the comparisons of the check with the experimental varieties for days to anthesis, we use the output presented for check Duma 43 in Tables that are in the sections that follow. For the sake of brevity, Excel output for checks PAN4M19, DK8031, DH04, and WH505 is presented in the supplementary material file (Supplementary materials for REMATTOOL 20220112_V7).
Yield against grain moisture content (%) at harvest x-y graph
The x-y graph () matched the expected relative order of the check entries in the trial in ascending order for moisture content at harvest for PAN4M19, Duma 43, DK8031, DH04, and WH505. Furthermore, the moisture content at harvest for all the entries was below the threshold of 26% for physiological maturity recommended by Miles (1958) (cited by Hallauer and Russell (Citation1962)) as a good point for harvesting although delaying further would discriminate the varieties better and also make it cheaper to dry the grain to moisture levels suitable for storage.
Figure 5. Graph of yield (t/ha) against grain moisture (%) at harvest. The labels are entry numbers and names.
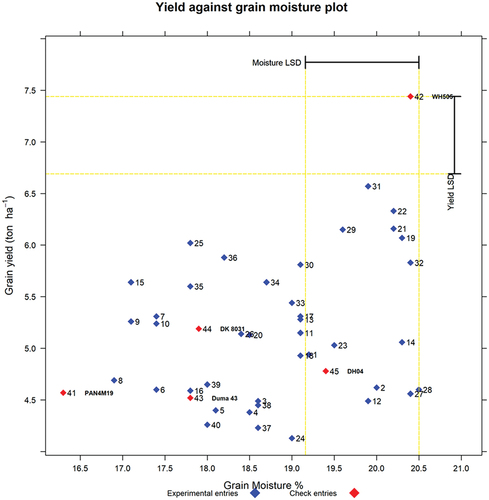
Thus, in a single visualization, one can easily see which new entries are of the same relative maturity as the comparable check (relative to grain moisture content (%)) but with yield higher than the check. To get more information on the selected entries based on grain moisture content (%), the reader is referred to the output for check Duma 43, presented in the Excel output in the sections that follow. Excel tables for checks PAN4M19, DK8031, DH04, and WH505 are presented in the supplementary material file (Supplementary materials for REMATTOOL 20220112_V7).
Yield against number of harvested plants x-y graph
The x-y graph of grain yield against number of harvested plants is presented in , and it helps in visualizing and understanding whether any of the entries were disadvantaged by poor plant stands. Under ideal conditions, all the entries are expected to have the same mean number of plants per plot at harvest.
Figure 6. Graph of yield (t/ha) against number of harvested plants. The labels are entry numbers and names.
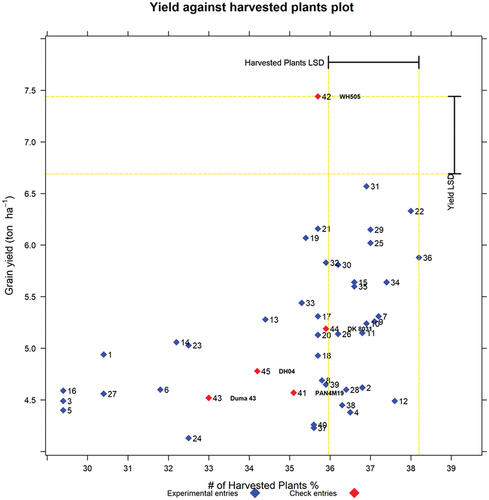
This x-y graph more importantly informs whether the plant stands of the checks were reasonably good to justify fair comparisons to the experimental entries. In this example, the x-y graph () shows that, in general, higher-yielding entries had higher plant stands at harvest than lower-yielding entries. With this information, it would be prudent to compare the plant stands of the entries selected for advancement to the plant stand of the corresponding check based on either days to anthesis or grain moisture content and see whether or not they are significantly different. If they are significantly different, then it would mean that the yield comparisons are not fair. If they are not significantly different, it would still be interesting to know which one had higher plant stands. These comparisons are presented for check Duma 43 in the Excel Tables that are in the sections that follow. For brevity, the Excel output for the other four checks (PAN4M19, DK8031, DH04, and WH505) is presented in the supplementary material file (Supplementary materials for REMATTOOL 20220112_V7).
Interactive x-y graphs and correlations
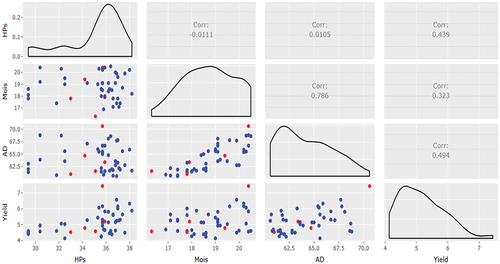
Interactive x-y graphs, density plots along the diagonals and pairwise correlations among the traits are also produced by REMATTOOL (). In this example, yield was positively correlated with the other three traits (days to anthesis, grain moisture content, number of plants harvested), though not very strongly. Furthermore, there was a strong positive correlation (r = 0.79) between days to anthesis and grain moisture content. The other correlations in involving number of plants harvested are not useful, except that for yield (r = 0.44), and hence should be ignored.
Figure 7. Combo of interactive graphs showing the density plots for each trait and the correlations between pairs of traits. (Yield = Grain yield t/ha, AD = anthesis days, Mois = grain moisture content %, HPs = Number of Harvested Plants).
Excel output options for identifying superior experimental entries
In addition to the four x-y graphical outputs described above, there will also be tabulated Excel file outputs corresponding to the number of check entries. Each Excel output file would contain seven different worksheets/tabs labeled YieldvsAD, YieldvsMois, YieldvsHPs, YieldvsADvsMois, YieldvsADvsHPs, YieldvsMoisvsHPs, and YieldvsADvsMoisvsHPs,
where:
YieldvsAD = List of higher-yielding (10% and above) entries, with days to anthesis values not significantly different from those of the targeted check entry.
YieldvsMois = List of higher-yielding (10% and above) entries, with grain moisture content percent values not significantly different from those of the targeted check entry.
YieldvsHPs = List of higher-yielding (10% and above) entries, with harvested number of plants not significantly different from those of the corresponding check entry. N.B. This is meant to show the trend between yield versus plant densities in the x-y graph, and the Excel output table is redundant and not the focus of the output from the analysis.
YieldvsADvsMois = List of higher-yielding (10% and above) entries, with both days to anthesis and percent grain moisture content values not significantly different from those of the targeted check entry.
YieldvsADvsHPs = List of higher-yielding (10% and above) entries, with both days to anthesis and harvested plant values not significantly different from those of the targeted check entry.
YieldvsMoisvsHPs = List of higher-yielding (10% and above) entries, with both grain moisture content percent and harvested plant values not significantly different from those of the targeted check entry.
YieldvsADvsMoisvsHPs = List of higher-yielding (10% and above) entries, with days to anthesis, percent grain moisture content, and harvested plant values not significantly different from those of the targeted check entry.
Options for identifying superior experimental entries from the example
Yield versus anthesis days (YieldvsAD) option
to 6 represent experimental entries that are comparable to the check, Duma 43. All the entries that are comparable to Duma 43 with respect to days to anthesis are listed in , showing the yield advantage of each of the new entries relative to the check. Thus, entry 36 (CKEH160064), entry 35 (CKEH160063), entry 15 (CKEH160023), entry 7 (CKEH160009), and entry 10 (CKEH160013) with 30.1%, 23.9%, 24.8%,17.5%, and 15.9% yield advantage, respectively, over Duma 43, have days to anthesis that are not significantly different from those of Duma 43. Hence, the experimental entries and the check are comparable relative to maturity.
Table 1. Output for check Duma 43 in the “YieldvsAD” Excel Tab.
Thus, with REMATTOOL, the breeder/agronomist can decide which entry they want to advance to the next stage of testing/release, assuming the entry has superior performance in all the other basic agronomic traits and disease reactions. However, attracted by higher yield levels and without using REMATTOOL, one might be quick to advance entries 36 (CKEH160064), 35 (CKEH160063), and 7 (CKEH160009) with 30.1%, 23.9%, and 17.5% yield advantage and be slow to notice that there are two other alternative entries that need to be considered before selecting the best entry. Some of the higher yielding entries that are comparable to the check can cumulatively contribute to an unintended increase in the days to maturity of the maturity category after several new variety releases, and to minimize this, it is important to select the best entry for the prevailing circumstances.
With REMATTOOL, this unintended gradual shift in maturity can be avoided by ensuring that every new variety release has exactly equal, or less, number of days to anthesis compared to the check variety to be replaced. Hence, if necessary, entries 36 (CKEH160064), 35 (CKEH160063), and 7 (CKEH160009) can be advanced to the next stage, but, knowing that they might contribute to the undesirable gradual shift in maturity.
Yield versus grain moisture content (YieldvsMois) option
All the entries listed in have percent grain moisture content that is similar to that of check Duma 43 and yield that is at least 10% above that of Duma 43. Thus, entries 25, 36, 30, 15, 34, 35, 33, 7, 17, 13, 9, 10, 11, 26 and 20 have percent grain moisture content values not significantly different from that of Duma 43. Hence, the breeder would select replacement varieties for Duma 43 from these 15 entries based on breeding objectives and other cultivar attributes. Varieties with relatively higher grain moisture content at harvest might be a disadvantage to the industry since more time and energy costs will be needed to bring down the grain moisture content to levels suitable for storage.
Table 2. Output for check Duma 43 in the “YieldvsMois” Excel Tab.
Therefore, everything else being equal, except yield, the first entry of choice to use as a replacement would be entry 25 with 33.9% yield advantage over Duma 43. Entry 36 would be next to be recommended with a moisture content of 18.2%, followed by entry 30, with a moisture content of 19.1%. Entry 15 would be next to be recommended with a 24.8% higher grain yield and a grain moisture content of 17.1%. Similar comparisons can be done for the rest of the experimental entries listed in .
Yield versus both anthesis days and grain moisture content (YieldvsADvsMois) option
Excel output presented in shows entries that are not significantly different from Duma 43 in both days to 50% anthesis and grain moisture content at harvest but yield at least 10% higher than Duma 43. The breeder has the option to select replacement varieties from these five entries, and depending on the breeder’s objectives and other cultivar attributes, the first entry to consider would be entry 36, followed by entries 15, 35, 7, and 10. Thus, each entry to be advanced can be easily evaluated through direct comparison of both grain moisture content and expected relative maturity against the check.
Table 3. Output for check Duma 43 in the “YieldvsADvsMois” Excel Tab.
Yield versus both number of days to anthesis and plant stand at harvest (YieldvsADvsHPs) option
Among the entries whose days to anthesis were not significantly different and had yield levels of at least 10% higher than that for Duma 43 in , none had plant stand at harvest that was not significantly different from that of Duma 43 (). All the entries previously identified in as higher yielding than Duma 43 by at least 10% had an unfair advantage of significantly higher plant population densities than Duma 43. Therefore, none of the previously identified entries is comparable to Duma 43 for population densities, and hence, no entry can be recommended to directly replace Duma 43 based on these results.
Table 4. Output for check Duma 43 in the “YieldvsADvsHPs” Excel Tab.
Yield versus both grain moisture content and plant stand at harvest (YieldvsMoisvsHPs) option
contains one entry whose grain moisture content level and plant stand were not significantly different and had yield that was at least 10% higher than that of Duma 43. Only entry 13 had plant stand at harvest that was not significantly different from that of Duma 43. All the other entries previously identified in as higher yielding than Duma 43 by at least 10% had an unfair advantage of having significantly higher plant population densities than Duma 43. Thus, entry 13 can be advanced as it had higher yield levels, coupled with non-significantly different both moisture content and plant stand at harvest compared to Duma 43.
Table 5. Output for Check Duma 43 in the “YieldvsMoisvsHPs” Excel Tab.
Yield versus anthesis days, grain moisture content, and plant stand at harvest (YieldvsADvsMoisvsHPs) option
There are five entries in that yielded at least 10% higher than Duma 43 and had both days to anthesis and percent grain moisture content not significantly different from those of Duma 43. However, according to the LSD values for the number of harvested plants, these entries had significantly higher number of harvested plants, which gave them an unfair advantage over Duma 43. Thus, when comparisons are made for the same population densities, none of the entries yielded higher than Duma 43 ().
Table 6. Output for Check Duma 43 in the “YieldvsADvsMoisVsHPs” Excel Tab.
Discussion
Grain moisture content and days to anthesis are important considerations in the product advancement process in large-scale seed companies. This practice has received less attention from the public-sector breeders in the developing world. By extending REMATTOOL analyses to outputs of means from META-R (Alvarado et al. Citation2015), Fieldbook (Vivek et al. Citation2007), or SAS (SAS Institute Citation2009) analyses, the selection of new varieties for advancement is made easier, faster and clearer, in a stepwise fashion, than identifying the best varieties manually from a table of means. In the x-y graphs, the different entries are labeled and easily identifiable. Hence, the grain yield and days to anthesis and/or grain yield and percent grain moisture at harvest and/or grain yield and plant stand at harvest of the new varieties are directly and easily compared to the performance of the checks. The LSD values for both the y-axis (grain yield) and the x-axis (days to anthesis or percent grain moisture at harvest or number of harvested plants) presented in the tables of means from ANOVAs are used in making comparisons for the corresponding trait on each of the two axes ().
Thus, REMATTOOL-R software provides an easier x-y graphical and tabular output tool to enable speedy variety advancement based on days to anthesis and grain moisture content as proxies of relative maturity. The x-y graph outputs of grain yield against days to anthesis and percent grain moisture content allow for the visualization of the potentially high-yielding entries for each relative maturity group in a single visualization for each approach.
The x-y graph of grain yield against number of harvested plants presents a visual picture of whether the higher grain yield levels are generally associated with a higher number of harvested plants and vice versa. When the correlation between grain yield and number of harvested plants in the interactive combo of x-y graphs () is positive, these would be strong reasons to use plant stand as a covariate in the ANOVA for grain yield.
The x-y graphs from REMATTOOL will be an addition to the breeder’s toolbox, wherein we already have the biplots and outputs from AMMI and GGEbiplot (Yan and Tinker Citation2005, Citation2006; Gauch, Piepho, and Annicchiarico Citation2008; Yan Citation2014; Badu-Apraku et al. Citation2020). For the non-technical participants in variety-release panels or committees, and/or policymaking committees, the x-y graphs from REMATTOOL will be simple and easy to comprehend. Thus, the x-y graphs from REMATTOOL do not have the same level of intellectual sophistication associated with AMMI and GGE biplots. While REMATTOOL brings simplicity to targeted variety replacement in variety release committee meetings since the selection decisions are based on overall means, its downside is that it does not provide outputs on stability and general or specific adaptation of entries, which are easily provided for in GGEbiplot analyses.
However, REMATTOOL is handy for advancements at the preliminary variety testing (PVT) stage in breeding programs since this stage is usually constrained by many entries and limited seed quantities that in most cases do not allow for multilocation evaluation.
The use of REMATTOOL facilitates quick identification of the best-performing entries in a trial compared to the practice of most public-sector breeders in the developing world – where a summary table of means for the different traits ranked according to yield or another trait is used. REMATTOOL provides options to the user whether to use days to anthesis or percent grain moisture content or a combination of both in grouping cultivars into maturity groups and identify the best performer for each relative maturity group (). Genetic gains are optimized when the new experimental variety that is to be advanced has a high yield potential and little or no increase in days to anthesis or grain moisture content. Likewise, genetic gains are also optimized when there is a reduction in days to anthesis or percent grain moisture content with no loss in yield potential. Thus, REMATTOOL-R provides a tool for the quick preliminary assessment of the presence or absence of genetic gains.
REMATTOOL x-y graphs have also been shown to be useful in easily determining and confirming the expected relative order of days to anthesis or grain moisture content values of the check varieties from the earliest to the latest-maturing entry. This is very important since it complements the heritability values in informing researchers about the quality of flowering data for each trial and deciding on which of the trials can be included in combined analyses. When the relative order of the days to anthesis or percent grain moisture content data of the checks are different from the expected order, then the accuracy of the days to anthesis or percent grain moisture content data becomes doubtful, and these data cannot be reliably used to group the entries of the trial into their relative maturity groups. Also, in multi-environment trials, the site with doubtful relative maturity data should have the days to anthesis or grain moisture content data excluded from combined analyses since it would adversely influence the overall means for the specific trait.
In addition to the individual simple x-y graphs, REMATTOOL produces a combo of interactive x-y graphs, density plots, and the corresponding correlation coefficients between pairs of traits used in the analyses. However, not all the correlations are useful in REMATTOOL. The useful correlations are the ones between yield and number of harvested plants, days to anthesis, and grain moisture. Positive correlations of yield with the other traits would imply that yield increases as the other trait increases. Correlations of percent grain moisture with plant stand, and of days to anthesis days with plant stand, are not useful in REMATTOOL and therefore are to be ignored in the interpretation of results.
While the x-y graph of yield against harvested plants is useful in enabling the user to visualize the influence of plant stand at harvest on yield levels, the Excel output tables of yield against number of harvested plants (YieldvsHPs) for each check variety are not useful on their own because they will be cutting across different relative maturities and hence are ignored during the interpretation of results from REMATTOOL. However, calculation of YieldvsHPs is a necessary step in arriving at calculations that can adjust the YieldvsAD and YieldVsMois and YieldvsADvsMois outputs for plant stands at harvest. REMATTOOL can also produce tabulated outputs for each check variety from input files adjusted for plant stands at harvest using covariate analyses. When the yield levels are adjusted using the covariate of plant stand at harvest to yield, the REMATTOOL Excel outputs without plant stands at harvest would be preferred, while, when the input file has no adjustments of covariate for plant stands at harvest in the yield levels, the REMATTOOL outputs with plant stands at harvest would be preferred.
Because of its ability to display yield levels and relative maturities in a single visualization, REMATTOOL is proposed as part of the breeder’s toolkit for speeding up the development of varieties. Thus, the breeder is expected to be empowered to easily identify and select new cultivars with similar or earlier maturity coupled with similar plant densities but yielding (5%, or 10%, or 15%, or 20%) higher than the targeted check varieties in a trial. This is expected to bring simplicity and efficiency to the variety-advancement process at all stages in the variety-development and release process.
Conclusions
REMATTOOL-R Function is a useful preliminary relative maturity indicator or estimator for entries in a trial. The relative order of days to anthesis or grain moisture content for check or control varieties in REMATTOOL-R can be used to determine whether the flowering or grain moisture content data for a site or trial can be included in a combined analysis. When using REMATTOOL-R, it is expected that there will be no unintended loss of genetic gains in all maturity categories since new higher-yielding varieties with the same or earlier relative maturity against each of the check varieties will be easily identifiable and hence advanced accordingly. Thus, presented here is a robust, simple to use and understand, single location/multilocation means-based, and freely available, yield- and maturity-focused crop variety advancement tool. It is a tool that is expected to be ideal for use by the breeder, researcher, non-technical crop variety release committee members, and policymakers in crop variety replacement.
Supplemental Material
Download MS Word (69.6 KB)Acknowledgments
The maize field trial results used were from the International Centre for Maize and Wheat Improvement (CIMMYT)’s Global Maize Program (GMP) trials for the Water Efficient Maize for Africa (WEMA) Project funded by the Bill and Melinda Gates (BMGF, Grant # OPP1019943) and Howard Buffett Foundation. The authors acknowledge the help of Dr Joseph Eyre of Queensland Alliance for Agriculture and Food Innovation (QAAFI), University of Queensland, Australia, for the introduction to writing scripts in R for this manuscript. The authors would like to thank Seed Co, Kenya Seed Company, Pioneer East Africa, Monsanto East Africa, and Western Seed Company for making available their hybrids used as checks in the trials. We also thank the anonymous reviewers and technical editor whose constructive comments improved the quality of this paper.
Disclosure statement
No potential conflict of interest was reported by the author(s).
Data availability statement
REMATTOOL-R will be available as a standalone tool for identifying varieties for advancement that can be used post any single-site analysis or META and can be accessed through CIMMYT Dataverse webpage.
Project name: REMATTOOL-R
Project home page: None
Archived version: DOI or unique identifier of archived software or code in repository;
https://hdl.handle.net/11529/10548413
Operating system(s): Windows 7.0 and/or higher
Programming language: R environment
Other requirements: Base R, RStudio, and Microsoft Office 2007
License: GNU
Any restrictions to use by non-academics: None
Supplementary materials
Supplemental data for this article can be accessed online at https://doi.org/10.1080/15427528.2022.2134072
Additional information
Funding
References
- Alvarado, G., M. López, M. Vargas, Á. Pacheco, F. Rodríguez. 2015. “META-R (Multi Environment Trail Analysis with R for Windows) Version 6.04.” The International Maize and Wheat Improvement Center http://hdl.handle.net/11529/10201 International Maize and Wheat Improvement Center [Distributor] V17 [Version]
- Badu-Apraku, B., B. Fakorede, R. Akinwale, B. Annor, S. Adewale. 2020. “Application of the GGE Biplot as a Statistical Tool in the Breeding and Testing of Early and Extra-Early Maturing Maize in Sub-Saharan Africa.” Crop Breeding, Genetics and Genomics 2 (3): e200012. doi:10.20900/cbgg20200012.
- Boko, M., I. Niang, A. Nyong, C. Vogel, A. Githeko, Medany, M., Osman-Elasha, B., Tabo, R., Yanda, P. 2007. “Climate Change 2007: Impacts, Adaptation and Vulnerability.“ Contribution of Working Group II to the Fourth Assessment Report of the Intergovernmental Panel on Climate Change edited by Parry, M. L., Canziani, O. F., Palutikof, J. P., van der Linden, P. J., Hanson, C. E. Africa: Cambridge University Press.
- Gauch, H. G. 2006. “Statistical Analysis of Yield Trials by AMMI and GGE.” Crop Science 46: 1488–1500. doi:10.2135/cropsci2005.07-0193.
- Gauch, H. G., H. P. Piepho, and P. Annicchiarico. 2008. “Statistical Analysis of Yield Trials by AMMI and GGE: Further Considerations.” Crop Science 48 (3): 866. doi:10.2135/cropsci2007.09.0513.
- Hallauer, A. R., and W. A. Russell. 1962. “Estimates of Maturity and Its Inheritance in Maize.” Crop Science 2: 289–294. doi:10.2135/cropsci1962.0011183X000200040006x.
- IPCC. 2014. Climate Change 2014: Impacts, Adaptation, and Vulnerability. Summaries, Frequently Asked Questions, and Cross-Chapter Boxes. A Contribution of Working Group II to the Fifth Assessment Report of the Intergovernmental Panel on Climate Change (C.B. V. R. B. Field, D. J. Dokken, K. J. Mach, and M. D. Mastrandrea editors, et al. World Meteorological Organization: Geneva, Switzerland.
- Makumbi, D. 2011. Results of the 2010 Regional Trials Coordinated by CIMMYT-Kenya. Nairobi, Kenya: CIMMYT.
- Pavan, R., H. C. Lohithaswa, M. C. Wali, G. Prakash, and B. G. Shekara. 2011. “Correlation and Path Coefficient Analysis of Grain Yield and Yield Contributing Traits in Single Cross Hybrids of Maize (Zea mays L.).” Electronic Journal of Plant Breeding 2 (2): 253–257.
- R Core Team. 2021. “R: A Language and Environment for Statistical Computing.” https://www.r-project.org/
- RStudio Team. 2020. “RStudio: Integrated Development for R.” https://www.rstudio.com/products/rstudio/#rstudio-desktop
- SAS Institute. 2009. “The SAS System for Windows.” Release 9.2. SAS Inst., Cary.
- Setimela, P. S., J. MacRobert, G. N. Atlin, C. Magorokosho, A. Tarekegne. 2012. Evaluation of Regional on Farm Trials in Eastern and Southern Africa 2011. Harare, Zimbabwe: CIMMYT.
- Vivek, B., M. Bänziger, and K. Pixley. 2001. Characterization of Maize Germplasm Grown in Eastern and Southern Africa: Results of the 2000 Regional Trials Coordinated by CIMMYT. Harare, Zimbabwe: CIMMYT.
- Vivek, B. S., J. Kasango, S. Chisoro, and C. Magorokosho. 2007. Fieldbook: Software For Managing A Maize Breeding Program: A Cookbook For Handling Field Experiments. Mexico: CIMMYT.
- Yan, W. 2001. “GGEbiplot – A Windows Application for Graphical Analysis of Multienvironment Trial Data and Other Types of Two-way Data.” Agronomy Journal 93 (5): 1111–1118. doi:10.2134/agronj2001.9351111x.
- Yan, W. 2014. Crop Variety Trials: Data Management and Analysis. Wiley Blackwell, 1–351. doi:10.1002/9781118688571.
- Yan, W., M. S. Kang, B. Ma, S. Woods, and P. L. Cornelius. 2007. “GGE Biplot Vs. AMMI Analysis of Genotype-by-environment Data.” Crop Science 47 (2): 643–653. doi:10.2135/cropsci2006.06.0374.
- Yan, W., and N. A. Tinker. 2005. “An Integrated Biplot Analysis System for Displaying, Interpreting, and Exploring Genotype X Environment Interaction.” Crop Science 45 (3): 1004–1016. doi:10.2135/cropsci2004.0076.
- Yan, W., and N. A. Tinker. 2006. “Biplot Analysis of multi-environment Trial Data: Principles and Applications.” Canadian Journal of Plant Science 86 (3): 623–645. doi:10.4141/P05-169.
Appendix I:
Set up of R-Studio for REMATTOOL use
Install R CRAN software (R Core Team Citation2021) on a 32 or 64 bit machine. Software and instructions are freely available at https://cran.r-project.org/bin/windows/base/.
Install R Studio (RStudio Team Citation2020) on a 32 or 64 bit machine. Software and instructions are freely available at https://www.rstudio.com/products/rstudio/#rstudio-desktop .
Call or open RStudio using the shortcut menu or from the list of programs under the start menu
From the RStudio library, install packages: library(“lattice“); library(“latticeExtra”); library(”RColorBrewer”); library(‘GGally’); library(‘plotly’); and library(‘xlsx’).
Appendix
Table B1. Example data means of selected agronomic traits for 2016 Stage II Trial: Example Data File.