
 ?Mathematical formulae have been encoded as MathML and are displayed in this HTML version using MathJax in order to improve their display. Uncheck the box to turn MathJax off. This feature requires Javascript. Click on a formula to zoom.
ABSTRACT
Spring wheat (Triticum aestivum L.) nitrogen-use efficiency (NUE) and recovery with nitrogen (N) fertilization rates in crop rotations need further exploration. The effect of cropping sequence and N fertilization rate were evaluated on spring wheat N concentration and uptake, N harvest index (NHI), N-use efficiency (NUE), and N recovery index (NRI) from 2012 to 2019 in the northern Great Plains, USA. Cropping sequences were conventional till spring wheat-fallow (CTWF), no-till spring wheat-fallow (NTWF), no-till spring wheat-pea (Pisum sativum L.) (NTWP), and no-till continuous spring wheat (NTCW), and N fertilization rates to spring wheat were 0, 50, 100, and 150 kg N ha−1. Straw N concentration and N uptake were greater for CTWF than NTWP and NTCW in 4 out of 8 years and increased with increased N fertilization rate. Grain N concentration and NHI varied with treatments and years. Grain N uptake was greater for CTWF and NTWF than NTWP and NTCW at most N fertilization rates and years. In contrast, NUE was greater for NTCW than CTWF and NTWF at all N fertilization rates in most years. The NRI was greater for NTWP or NTCW than CTWF or NTWF in most years. Increasing N fertilization rate increased grain N uptake for most cropping sequences in all years but had a variable effect on NUE and NRI. Although spring wheat N concentration and N uptake were superior for CTWF and NTWF, and NUE for NTCW, NTWP with 50 to 100 kg N ha−1 can be used to sustain grain yield, N uptake, NUE, and NRI.
Introduction
Nitrogen (N) is one of the most expensive inputs required in large amounts to sustain crop production and is usually applied from N fertilizers (Crews and Peoples Citation2004; Huggins and Pan Citation2003; Raun and Johnson Citation1999). The energy costs of producing N fertilizers is high (Smil Citation2004). The global consumption of N fertilizers was 118 million tons in 2019, which is expected to increase further in the coming decades to enhance crop production in order to feed the growing population (Sharma and Bali Citation2017). Nitrogen fertilization rates that exceed crops’ N requirements can result in the accumulation of soil residual N that decrease soil pH and degrade environmental quality by increasing NH4-N loss through volatilization, NO3-N losses through denitrification, leaching, surface runoff, plant senescence, and N2O loss through gaseous emissions (Drinkwater, Wagoner, and Sarrantonio Citation1998; Huggins and Pan Citation2003; Limaux et al. Citation1999; Raun and Johnson Citation1999). Such losses to the environment can account for 16% to 37% of the total N input to crops (Raun and Johnson Citation1999; Sainju Citation2019). These losses can be reduced by enhancing N-use efficiency (NUE) by synchronizing timing of N application with crop’s N demand (Karlen et al. Citation1994; Raun and Johnson Citation1999; Xu et al. Citation2020). In dryland cropping systems, N is one of the most limiting factors for crop production after soil water content (Lenssen et al. Citation2007).
The key indicators of N use by crops include biomass and grain N uptake, N harvest index (NHI), NUE, and N removal index (NRI) (Huggins and Pan Citation2003). The NRI for cereal crops ranges from 29% to 42% and averages 33% (Huggins and Pan Citation2003; Raun and Johnson Citation1999). For wheat, NRI ranges from 21% to 40% (Dalal et al. Citation2011). The NUE for cereal crops ranges from 19 to 30 kg grain kg−1 N (Huggins and Pan Citation2003) and for spring wheat from 7 to 15 kg grain kg−1 N (Mohammed and Chen Citation2018). The NHI ranges from 70% to 83% for spring wheat (Huggins and Pan Citation2003). Improved NUE and NRI result in enhanced grain yield, quality, and N uptake, better economic benefit, and reduced N loss to the environment (Karlen et al. Citation1994; Mohammed and Chen Citation2018; Raun and Johnson Citation1999). Globally, a 1% increase in NUE can save $234 million in N fertilizer costs (Raun and Johnson Citation1999). Increasing NHI, using crop rotations, and coinciding N application time with N demand of crops can enhance NUE and NRI (Raun and Johnson Citation1999).
Crop rotation can have variable effects on spring wheat (Triticum aestivum L.) grain N concentration, N uptake, NHI, NUE, and NRI. Allen et al. (Citation2021) and Lenssen et al. (Citation2007) reported that spring wheat aboveground biomass and grain N uptake, NHI, NUE, and NRI were greater in spring wheat-pea (Pisum sativim L.) or spring wheat-fallow rotations than continuous spring wheat, but N concentration was greater in continuous spring wheat in eastern and northern Montana, USA. In contrast, Miller et al. (Citation2003) and O’Leary and Comer (Citation1997) showed that spring wheat following pea had higher grain N concentration than following spring wheat in western Montana, USA and western Canada. Similarly, several researchers (Campbell et al. Citation2005; Pilbeam et al. Citation1997) found that spring wheat following fallow or pea had higher grain N uptake than following spring wheat in western Canada. Mohammed and Chen (Citation2018) observed that NUE was not different between spring wheat-fallow and spring wheat-pea rotations in central Montana. In contrast, St Luce et al. (Citation2020) reported that continuous spring wheat had greater NUE than crop rotations containing spring wheat in western Canada. The NUE can be lower for legume-nonlegume rotations than continuous nonlegumes due to lower use of legume N by succeeding nonlegumes (Pierce and Rice Citation1988).
Increased N fertilization rate usually has a positive effect on spring wheat N concentration and N uptake, but negative effect on NUE and NRI (Blankenau, Olfs, and Kuhlmann Citation2002; Giambalvo et al. Citation2010; Yamoah et al. Citation1998; Zhu, Guo, and Peng Citation2011). Many researchers (Blankenau, Olfs, and Kuhlmann Citation2002; Giambalvo et al. Citation2010; Yamoah et al. Citation1998; Zhu, Guo, and Peng Citation2011) have reported that increased N fertilization rate decreased NUE and NRI due to the inability of crops to remove all applied N from the N fertilizer. Xu et al. (Citation2020) found that N fertilization rate at 105 kg N ha−1 increased spring wheat N uptake and NUE but had inconsistent effect on NHI compared to other N fertilization rates in China (0, 53, 157, and 210 kg N ha−1). Campbell et al. (Citation1993) demonstrated that spring wheat N uptake and NUE increased with increased soil NO3-N content but decreased with increased N fertilization rate in western Canada. Similarly, Nouriyani et al. (Citation2012) observed that NUE and NRI for spring wheat were greater with 40 than 10 kg N ha−1 but decreased with further increase in N fertilization rate in Iran. Szmigiel et al. (Citation2016) reported that increasing N fertilization rate from 56 to 72 kg N ha−1 for spring wheat increased aboveground biomass and grain N uptake, but reduced NHI, NUE, and NRI and that maximum NRI was observed at 56 kg N ha−1 in Poland.
Crop rotation and N fertilization rate may have variable effects on spring wheat N relations, but more information on reducing N fertilization rate using spring wheat-pea rotation while sustaining N relations is needed. Because of the adverse effect of increased N fertilization rate on soil health and environmental quality, novel management practices are needed to reduce N fertilization rate while enhancing spring wheat N uptake, NUE, and NRI. As legume residues, such as pea residue, supply more N to the succeeding crops than nonlegume residues, such as wheat residue, due to their higher tissue N concentrations stemming from increased N fixation, spring wheat-pea rotation with reduced N fertilization rate may sustain spring wheat grain N concentration and uptake, NHI, NUE, and NRI compared to continuous spring wheat with recommended or increased N fertilization rate. As a result, we hypothesized that spring wheat-pea rotation with 50 kg N ha−1 would sustain spring wheat grain N concentration and uptake, NHI, NUE, and NRI compared to continuous spring wheat with 100–150 kg N ha−1. The objectives of this study were to: (1) evaluate how cropping sequence and N fertilization rate affect spring wheat N concentration, N uptake, NHI, NUE, and NRI from 2012 to 2019 under dryland cropping systems in eastern Montana, USA and (2) determine if spring wheat-pea rotation with 50 kg N ha−1 of N fertilization can sustain N uptake, NRI, NUE, and NRI compared to spring wheat-fallow or continuous spring wheat with 100–150 kg N ha−1.
Materials and methods
Site and treatments
The experimental site was located in Sidney, Montana, USA (48° 33’N, 104° 50’W) where the soil was Williams loam (fine-loamy, mixed, superactive, frigid, Typic Argiustolls). The soil had sand, silt, and clay concentrations of 350, 325, and 325 g kg−1, respectively, pH 7.2, and soil organic matter 22.8 g kg−1 at the 0–20 cm depth. Mean annual (30-yr average) air temperature at the site is 7°C and average annual precipitation is 396 mm, out of which 264 mm (67%) occurs during the crop growing season (April–August). The site had been cropped with spring wheat-fallow rotation under conventional tillage for >10 years before the initiation of the experiment.
The experiment ran for eight years from 2012 to 2019. Treatments were four cropping sequences (conventional till spring wheat-fallow [CTWF], no-till spring wheat-fallow [NTWF], no-till spring wheat-pea [NTWP], and no-till continuous spring wheat [NTCW]) and four N fertilization rates applied to spring wheat (0, 50, 100, and 150 kg N ha−1). The experimental design was a split plot, with cropping sequence as the main plot and N fertilization rate as the split-plot treatment arranged in a randomized block design with three replications. While NTCW was a 1-yr crop rotation, other cropping sequences were 2-yr rotations where both phases of the rotation appeared in each year. For example, NTWP had spring wheat and pea phases where both spring wheat and pea phases occurred in each year. The CTWF was the conventional cropping system and 100 kg N ha−1 was the recommended N fertilization rate applied to spring wheat at the site. Plots in CTWF were tilled using a field cultivator equipped with C-shanks and 45-cm wide sweeps and coiled-toothed spring harrows to a depth of 8 cm at planting and during fallow periods as needed to control weeds and seedbed preparation. Plots in other treatments were not tilled. The size of the split plot was 12.0 × 6.0 m.
Crop management and data collection
In late April of each year, using a no-till drill, spring wheat (cv. Reeder) was planted at 80 kg ha−1 (210 seeds m−2) and pea (cv. Majoret) at 90 kg ha−1 (75 seeds m−2) at a spacing of 20 cm. Pea seeds were inoculated with proper Rhizobium leguminosarum. At the same time, P fertilizer as triple super phosphate at 11 kg P ha−1 and K fertilizer as muriate of potash at 27 kg K ha−1 were banded 5 cm to the side and 5 cm below seeds to spring wheat and pea. A week after planting, N fertilizer as urea was broadcast by hand to spring wheat at rates shown above. This was done to avoid the difficulty of applying N fertilizer by no-till drill in small plots. There was no significant precipitation observed between crop planting and N fertilizer application. In order to reduce the accumulation of soil residual N after crop harvest and N loss to the environment, N fertilization rates were adjusted for soil NO3-N content to a depth of 60 cm which was determined after crop harvest in the autumn of the previous year. As a result, N fertilization rates as plant available N included both soil and fertilizer N. The 0 kg N ha−1 treatment included only soil residual N, as there was no N fertilizer applied in this treatment. No N fertilizer was applied to pea. Similarly, no N, P, and K fertilizers were applied to fallow plots. Crops received herbicides and pesticides as needed to control weeds and pests. No irrigation was applied.
In late July to mid-August of each year, two days before grain harvest, plants were chopped at a height of 2 cm above the ground from four 1 m rows. These were separated into straw and grains. Both straw and grains were oven dried at 70°C for 3 d to determine straw yield and NHI. Grain yield was determined by harvesting grains with a self-propelled combine from an area of 11.0 × 1.5 m, from which a sample of grain was oven-dried at 70°C for 7 d. After grain harvest, crop residues were returned to the soil. Nitrogen concentrations in straw and grains were determined by using a C and N analyzer (LECO, St. Joseph, MI) after grinding a portion of the oven-dried subsamples to 1 mm. Nitrogen uptake in straw and grain were determined by multiplying straw and grain yields by their N concentrations. The NHI was calculated by dividing grain N uptake by the sum of grain and straw N uptake. For this, N uptake in straw and grain in plant samples used for determining straw yield was used. The NUE and NRI in grain were calculated (Mohammed and Chen Citation2018; Yamoah et al. Citation1998) as:
Where GYF and GYU are spring wheat grain yields for N fertilized and unfertilized treatments, NUF and NUU are spring wheat grain N uptake for N fertilized and unfertilized treatments, respectively, and NF is the N fertilization rate.
Statistical analysis of data
Data for crop N relations were analyzed using the MIXED model procedure of SAS for a split-plot design (Littell et al. Citation1996). The main-plot treatment was cropping sequence, and the split-plot treatment was N fertilization rate. Fixed effects were cropping sequence, N fertilization rate, year, and their interactions and random effects were replication and replication × cropping sequence. The least square means test (Littell et al. Citation1996) was used to separate means and interactions when significant. Because N fertilization rate was a quantitative variable, regression analysis was used to determine the relationship between N fertilization rate and crop parameters for various cropping sequences (Heggenstaller et al. Citation2009), except for NUE and NRI due to insufficient level of N fertilization rates. Unless otherwise stated, data were tested using a threshold value of p ≤ 0.05 to indicate significant differences among treatments and interactions.
Results and discussion
Air temperature and precipitation
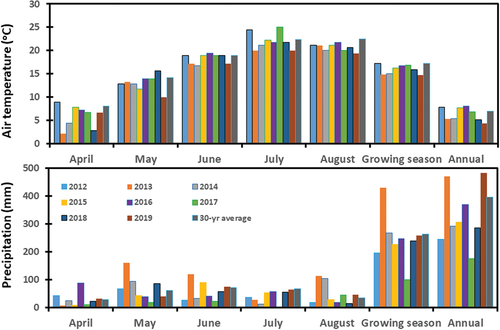
Monthly air temperatures from April to August were greater than the 30-yr average in April 2012, May Citation2018, and July 2012 and 2017 (). Notable below-average air temperature occurred in April 2013, 2014, and 2018 and May Citation2019. However, growing season air temperature was lower than the 30-yr average in all years, except in 2012. Notable intensive monthly precipitation (>70 mm) greater than the 30-yr average occurred in April 2016, May Citation2013 and Citation2014, June 2013, and August 2013 and 2014. In contrast, dry condition (<20 mm precipitation) occurred in April 2013, 2015, and 2017, May Citation2017, July 2014 and 2017, and August 2012, 2016, and 2018. Growing season precipitation greater than the 30-yr average occurred in 2013 and 2014, with 2017 being the lowest. Average growing season precipitation was 67% of the total annual precipitation.
Figure 1. Monthly average air temperature and total precipitation as well as growing season (April–August) and annual average air temperature and total precipitation and from 2012 to 2019 at the study site.
Straw and grain yields
Detailed description of straw and grain yields have been reported in a different paper (Sainju, Wang, and Barsotti Citation2013). In order to avoid duplication, straw and grain yields are described briefly here. Straw yield, averaged across N fertilization rates, was greater for CTWF and NTWF than NTWP or NTCW in 6 out of 8years and greater for NTWP than NTCW in 5 out of 8 yr. Straw yield, averaged across cropping sequences and years, was 8%–27% greater for 100 and 150 than 0 and 50 kg N ha−1. Grain yield was also greater for CTWF and NTWF than NTWP or NTCW at most N fertilization rates in 5 out 8 years and greater for NTWP than NTCW at N fertilization rate ≤100 kg N ha−1 in 6 out of 8 years. Grain yield either increased linearly with increased N fertilization rates for CTWF, NTWP, and NTCW in 5 out of 8 years or nonlinearly, with maximum yield at 100 kg N ha−1 in 6 out of 8 years. For linear relationships, an increase in N fertilization rate by 1 kg N ha−1 increased grain yield from 0.004 Mg ha−1 for CTWF and NTWP in 2016 and 2017 to 0.025 Mg ha−1 for NTCW in 2019. The economically optimal N fertilization rate (EONR) at which there was no further increase in yield with increasing N fertilization rate was 100 kg N ha−1 for straw yield in all cropping sequences and also 100 kg N ha−1 for grain yield for NTCW.
Increased soil water conservation during the fallow period probably increased straw and grain yields for CTWF and NTWF compared to NTWP and NTCW in most years. Increased N supplied by pea residue due to higher N tissue N concentration from biological N fixation than wheat residue may have increased straw yield for NTWP compared to NTCW in most years. However, greater grain yield for NTWP than NTCW at ≤100 kg N ha−1 was probably due to nonresponse of spring wheat at higher N rates. Similarly, greater N availability from increased N fertilization rate increased straw yield. While linear relationship between N fertilization rate and grain yield occurred in years with below- or average growing season precipitation, nonlinear relationship occurred during years with normal growing season precipitation. The results suggest that 100 kg N ha−1 can sustain straw and grain yields in NTCW, but grain yield can be greater with further increase in N fertilization rates in other cropping sequences.
Annualized straw yield was 31%–57% greater for NTWP (2.97 Mg ha−1) and NTCW (2.55 Mg ha−1) than CTWF (1.94 Mg ha−1) and NTWF (1.89 Mg ha−1). Similarly, annualized grain yield was 33%–38% greater for NTWP (3.17 Mg ha−1) and NTCW (3.15 Mg ha−1) than CTWF (2.37 Mg ha−1) and NTWF (2.29 Mg ha−1). This suggests that both NTWP and NTCW produced greater straw and grain yields due to continuous cropping every year than CTWF and NTWF where the absence of crops during the fallow period reduced annualized straw and grain yields. The NTWP produced similar or greater annualized straw and grain yields compared to NTCW due to the rotational benefit of pea on spring wheat.
Straw nitrogen concentration and uptake
Straw N concentration and N uptake were affected by cropping sequence, N fertilization rate, and year, with a significant interaction for cropping sequence × year (). Averaged across N fertilization rates, straw N concentration was greater for CTWF than NTWP and NTCW in 2013, 2016, and 2017, and greater for CTWF than other cropping sequences in 2015 (). Straw N uptake, averaged across N fertilization rates, was greater for CTWF and NTWF than NTCW in 2012, 2016, and 2017, and greater for CTWF than NTCW in 2013. In 2014, straw N uptake was greater for CTWF and NTWP than NTCW. Straw N uptake was also greater for NTWP than NTCW in 2014 and 2016. Averaged across cropping sequences and years, straw N concentration was greater for 150 kg N ha−1 than other N fertilization rates and straw N uptake was greater for 100 and 150 than 0 and 50 kg N ha−1 ().
Table 1. Analysis of variance for spring wheat straw N concentration and N uptake, N harvest index (NHI), and grain N concentration, N uptake, N-use efficiency (NUE) and N recovery index (NRI) with sources of variance for cropping sequence (CS), N fertilization rate (NR), and year (YR).
Table 2. Interaction between cropping sequence, N fertilization rate, and year on spring wheat straw N concentration and N uptake, N harvest index (NHI), and grain N recovery index (NRI) averaged across N fertilization rates and cropping sequences.
Table 3. Effect of N fertilization rate on spring wheat straw N concentration and N uptake and N harvest index averaged across cropping sequences and years.
The greater straw N concentration for CTWF than other cropping sequences in 4 out of 8 years was probably due to increased soil N uptake from higher soil NO3-N concentration stemming from conventional tillage and the fallow period. Both conventional tillage and the fallow period can increase soil organic matter mineralization due to enhanced microbial activity from increased soil disturbance and greater soil temperature and water content (Halvorson, Wienhold, and Black Citation2002; Sainju et al. Citation2015). Several researchers (Lin and Chen Citation2014; Sainju et al. Citation2015) have reported greater soil NO3-N content for conventional till crop-fallow than no-till continuous cropping in eastern and central Montana, USA. Greater N availability also likely increased straw N concentration with increased N fertilization rate, regardless of cropping sequences.
Increased straw yield, N concentration, or both may have increased straw N uptake for CTWF and NTWF in 5 out of 8 years (). As shown above, straw yield was greater for CTWF and NTWF than NTWP or NTCW and straw N concentration was greater for CTWF than NTWP and NTCW. Lin and Chen (Citation2014) observed greater spring wheat straw N uptake for spring wheat-fallow than continuous spring wheat in central Montana. Similarly, greater straw N uptake for NTWP than NTCW in 2 out of 8 years was due to increased straw yield. Non-significant difference in straw N concentration and N uptake between CTWF and NTWF indicates that tillage has no effect in these parameters. Increased straw yield and N concentration also increased straw N uptake with increased N fertilization rate, a result similar to those reported by Lin and Chen (Citation2014).
Grain nitrogen concentration
Spring wheat grain N concentration varied with cropping sequences, N fertilization rates, and years, with significant interactions for cropping sequence × N fertilization rate, cropping sequence × year, and N fertilization rate × year (). Grain N concentration was greater for CTWF or NTWF than NTWP or NTCW at most N fertilization rates in 2013, 2015, 2017, and 2019 (). In 2012 and 2014, grain N concentration was lower for NTCW than other cropping sequences at all fertilization rates, except at 100 kg N ha−1. In 2016 and 2018, grain N concentration was lower for NTWF than other cropping sequences at N fertilization rate ≥100 kg N ha−1. Greater grain N concentration for NTWP than NTCW at most N fertilization rates occurred only in 2012 and 2014. Increased N fertilization rate increased grain N concentration linearly or nonlinearly for all cropping sequences in all years, except for CTWF in 2013 and for NTWF in 2015 which decreased. Significant linear relationships between N fertilization rate and grain N concentration occurred for CTWF in 2012, 2014, 2016, and 2018 (p ≤ 0.10); for NTWF in 2012, 2013, 2014, and 2017 (p ≤ 0.10); for NTWP in all years except in 2014 and 2015; and for NTCW in all years except in 2015 and 2019. An increase in N fertilization rate by 1 kg N ha−1 increased grain N concentration from 0.017 g N kg−1 for NTWF in 2017 to 0.080 g N kg−1 for NTWP in 2012. Significant nonlinear relationship occurred for CTWF in 2019 where grain N concentration was maximized at 100 kg N ha−1. Averaged across years, grain N concentration was greater for CTWF than NTWP and NTCW at N fertilization rate ≤100 kg N ha−1 ()). Increased N fertilization rate linearly increased grain N concentration for all cropping sequences (p ≤ 0.10). An increase in N fertilization rate by 1 kg N ha−1 increased grain N concentration from 0.025 g N kg−1 for NTWF to 0.041 g N kg−1 for NTCW.
Figure 2. Relationship between N fertilization rate and spring wheat grain N concentration for cropping sequences from 2012 to 2015. Cropping sequences are CTWF, conventional till spring wheat-fallow; NTCW, no-till continuous spring wheat; NTWF, no-till spring wheat-fallow; and NTWP, no-till spring wheat-pea. Markers accompanied by different letters at a N fertilization rate are significantly different at p ≤ 0.05 by the least square means test.
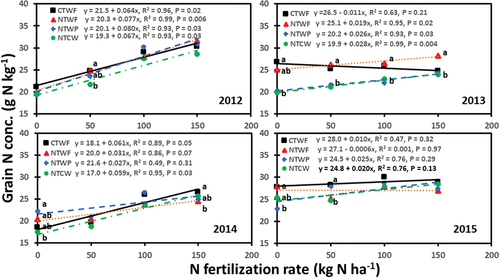
Figure 3. Relationship between N fertilization rate and spring wheat grain N concentration for cropping sequences from 2016 to 2019. Cropping sequences are CTWF, conventional till spring wheat-fallow; NTCW, no-till continuous spring wheat; NTWF, no-till spring wheat-fallow; and NTWP, no-till spring wheat-pea. Markers accompanied by different letters at a N fertilization rate are significantly different at p ≤ 0.05 by the least square means test.
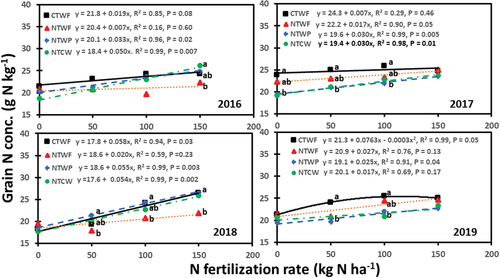
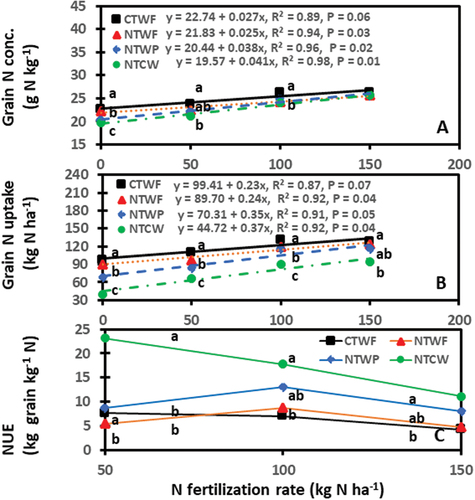
Figure 4. Relationship between N fertilization rate and spring wheat grain (a) N concentration, (b) N uptake, and (c) N-use efficiency (NUE) averaged across years. Cropping sequences are CTWF, conventional till spring wheat-fallow; NTCW, no-till continuous spring wheat; NTWF, no-till spring wheat-fallow; and NTWP, no-till spring wheat-pea. Markers accompanied by different letters at a N fertilization rate are significantly different at p ≤ 0.05 by the least square means test.
The greater grain N concentration for CTWF and NTWF at most N fertilization rates in 4 out of 8 years was likely due to increased soil N uptake resulting from higher soil NO3-N content stemming from increased N mineralization rates due to tillage and fallow, a case similar to that observed for straw N concentration. These results are similar to those reported by Lenssen et al. (Citation2007) who observed that spring wheat grain N concentration was greater following fallow than following pea in northern Montana. Similarly, greater grain N concentration for NTWP than NTCW at most N fertilization rates in 2012 and 2014 was likely due to the rotational benefit of pea which supplied additional N from its residue and conserved soil water more than spring wheat for succeeding spring wheat (Lenssen et al. Citation2014). These results are also similar to those reported by several researchers (Miller et al. Citation2003; O’Leary and Comer Citation1997) who found that spring wheat following pea had higher grain N concentration than following spring wheat, but in contrast to those shown by others (Allen et al. Citation2021; Lenssen et al. Citation2007) who observed the opposite result. The reasons for lower grain N concentration for NTWF in 2016 and 2018 were not known.
It is not surprising to observe greater grain N concentration with increased N fertilization rate for all cropping sequences because of increased N availability. However, the slower rate of grain N concentration increase with increasing N fertilization rate for CTWF and NTWF than other cropping sequences suggests that the response of grain N concentration to N fertilization rate slowed for cropping sequences containing fallow, probably due to increased soil NO3-N content. Campbell et al. (Citation1993) stated that the response of spring wheat to N fertilization rate was lower when soil NO3-N content is high. Non-significant differences in grain N concentration between NTWP with 50 kg N ha−1 and NTCW with 100–150 kg N ha−1 suggest that N fertilization rate can be reduced by one-half of the recommended N rate (100 kg N ha−1) to maintain spring wheat grain N concentration and reduce the accumulation of soil residual N. Similarly, non-significant difference in grain N concentration between CTWF and NTWF at all N fertilization rates indicates that tillage has no effect on grain N concentration. Although CTWF and NTWF with or without N fertilization had greater grain N concentrations than other treatments, these treatments can reduce annualized grain yields, net returns, and soil and environmental quality (Black and Tanaka Citation1997; Sainju, Wang, and Barsotti Citation2013). Therefore, CTWF and NTWF are not ideal cropping sequences to enhance spring wheat N concentration. Results suggest that NTWP with 50 kg N ha−1 can sustain grain N concentration.
Grain nitrogen uptake
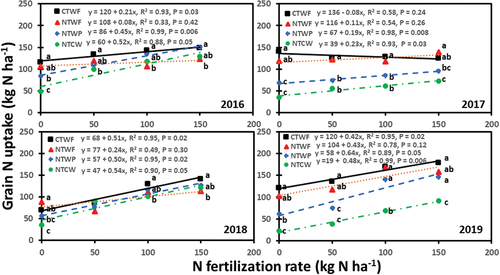
Spring wheat grain N uptake also varied with cropping sequences, N fertilization rates, and years, with significant interactions for cropping sequence × N fertilization rate, cropping sequence × year, and N fertilization rate × year (). Grain N uptake was greater for CTWF and NTWF than NTCW at most N fertilization rates in all years, except in 2014 and 2015 (). In 2014, N uptake was greater for NTWP than NTCW at all N fertilization rates. In 2015, N uptake was greater for NTWP than NTWF at 50 and 100 kg N ha−1. Increased N fertilization rate linearly increased N uptake for most cropping sequences and years, except for CTWF in 2013 and 2017, which declined. Significant linear relationships between N fertilization rate and grain N uptake were found for CTWF in all years, except in 2013, 2015, and 2017; for NTWF in 2013; for NTWP in all years, except in 2014 and 2015 (p ≤ 0.10); and for NTCW in all years, except in 2012 and 2015. An increase in N fertilization rate by 1 kg N ha−1 increased grain N uptake from 0.19 kg N ha−1 for NTWP in 2017 to 0.64 kg N ha−1 for NTWP in 2019. Significant nonlinear relationship occurred for NTWF in 2012 where grain N uptake was maximized at 100 kg N ha−1. Averaged across years, N uptake was greater for CTWF and NTWF than NTWP and NTCW and greater for NTWP than NTCW at N fertilization rate ≤100 kg N ha−1 ). Increased N fertilization rate linearly increased grain N uptake for all cropping sequences (p ≤ 0.10). An increase in N fertilization rate by 1 kg N ha−1 increased grain N uptake from 0.23 kg N ha−1 for CTWF to 0.37 kg N ha−1 for NTCW.
Figure 5. Relationship between N fertilization rate and spring wheat grain N uptake for cropping sequences from 2012 to 2015. Cropping sequences are CTWF, conventional till spring wheat-fallow; NTCW, no-till continuous spring wheat; NTWF, no-till spring wheat-fallow; and NTWP, no-till spring wheat-pea. Markers accompanied by different letters at a N fertilization rate are significantly different at p ≤ 0.05 by the least square means test.
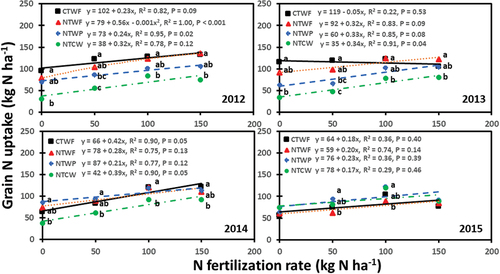
Figure 6. Relationship between N fertilization rate and spring wheat grain N uptake for cropping sequences from 2016 to 2019. Cropping sequences are CTWF, conventional till spring wheat-fallow; NTCW, no-till continuous spring wheat; NTWF, no-till spring wheat-fallow; and NTWP, no-till spring wheat-pea. Markers accompanied by different letters at a N fertilization rate are significantly different at p ≤ 0.05 by the least square means test.
Increased grain N uptake for CTWF and NTWF compared to other cropping sequences at most N fertilization rates and years was a result of increased grain yield, N concentration, or both, a case similar to those observed for straw N uptake. Grain yield was greater for CTWF and NTWF than NTWP and NTCW in 5 out of 8 years. Similarly, grain N concentration was greater for CTWF and NTWF than NTWP and NTCW in 4 out of 8 years (). These results are similar to those reported by Lenssen et al. (Citation2007) who found that spring wheat grain N uptake was greater following fallow than following pea in northern Montana. Campbell et al. (Citation2005) and St Luce et al. (Citation2020) demonstrated that spring wheat following fallow had 35% to 68% greater grain N uptake than following spring wheat in western Canada, a result of increased soil water and NO3-N contents during the fallow period. Similarly, greater N uptake for NTWP than NTCW was likely due to increased grain yield and N concentration, a rotational benefit of pea on spring wheat N uptake in NTWP. Pilbeam et al. (Citation1997) showed that spring wheat following pea had greater grain N uptake than following spring wheat in Syria. Non-significant difference in N uptake between CTWF and NTWF at most N fertilization rates and years suggests that tillage had no effect on spring wheat grain N uptake.
Increased N fertilization rate increased grain N uptake for most cropping sequences and years because it increased both grain yield and N concentration (). However, decreased N uptake for CTWF in 2013 and 2017 with increased N fertilization rate was probably due to reduction in grain N concentration or yield. A reduction in grain N concentration with increased N fertilization rate occurred for CTWF in 2013 () and a decreased grain yield occurred in 2017 (data not shown). The slower rates of N uptake increase with increased N fertilization rate for CTWF and NTWF than NTWP and NTWC suggest that spring wheat N uptake are less responsive to increased N fertilization rate for cropping sequences containing fallow. This could be the results of increased soil NO3-N content for CTWF and NTWF, as spring wheat N uptake response to increased N fertilization rate is lower in soils with higher NO3-N content (Campbell et al. Citation1993). Non-significant differences in N uptake between NTWP with 50 kg N ha−1 and NTCW with 100 and 150 kg N ha−1 ) suggest that N fertilization rate to spring wheat can be reduced by one-half of the recommended N fertilization rate (100 kg N ha−1) to sustain spring wheat N uptake. Increased N uptake is required to enhance NUE and reduce the accumulation of soil residual N that results in decreased soil and environmental quality (Huggins and Pan Citation2003; Pierce and Rice Citation1988; Raun and Johnson Citation1999). Although N uptake was greater for CTWF and NTWF than other cropping sequences at most N fertilization rates, using CTWF and NTWF to reduce N fertilization rates are not recommended because of reduced annualized crop yields and negative consequences of the fallow period on soil health and environmental quality (Black and Tanaka Citation1997; Sainju, Wang, and Barsotti Citation2013).
Nitrogen harvest index
The NHI was affected by N fertilization rate and year, with a significant interaction for cropping sequence × year (). Averaged across N fertilization rates, NHI was greater for NTWF than NTCW in 2013 (). In 2014, NHI was greater for NTWF and NTCW than CTWF. In 2015, NHI was greater for NTWP and NTCW than CTWF. In 2016, NHI was greater for CTWF than NTWP. In 2019, NHI was lower for NTCW than other cropping sequences. Averaged across cropping sequences and years, NHI was greater for 100 than 0 kg N ha−1 ().
Greater grain N uptake relative to aboveground biomass (straw + grain) N uptake may have increased NHI for CTWF in 2016 and 2019, for NTWF in 2013, 2014, and 2019, for NTWP in 2015 and 2019, and for NTCW in 2014 and 2015. Lower NHI for NTCW than other cropping sequences in 2019 was likely due to increased N uptake by aboveground biomass compared to grain during years with greater above-average annual precipitation (), which may have increased N availability due to enhanced mineralization of soil organic matter. In contrast, greater NHI for NTCW than CTWF in 2014 and 2015 was probably due to greater N uptake by grain relative to aboveground biomass during years with lower annual precipitation. Similarly, greater NHI for 100 than 0 kg N ha−1 was due to increased N uptake by grain compared to aboveground biomass. The inconsistency in NHI among cropping sequences and years indicates that NHI may not be a reliable indicator of NUE, although higher NHI can increase NUE (Huggins and Pan Citation2003; Xu et al. Citation2020). Our NHI values of 0.53 to 0.84 were similar to 0.59 to 0.81 for spring wheat reported by several researchers (Allen et al. Citation2021; Lenssen et al. Citation2007) in northern and eastern Montana.
Grain nitrogen-use efficiency
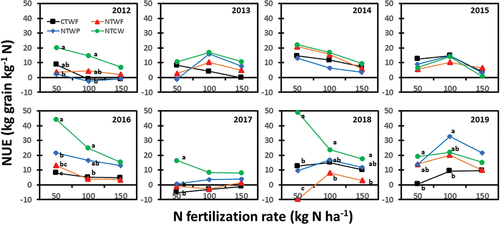
The NUE was also affected by cropping sequence, N fertilization rate, and year, with significant interactions for cropping sequence × N fertilization rate, cropping sequence × year, and N fertilization rate × year (). Most of the differences in NUE among cropping sequences occurred at ≤100 kg N ha−1 in most years (). The NUE was greater for NTCW than other sequences at 50 kg N ha−1 in 2012, 2016, 2017, and 2018. At 100 kg N ha−1, NUE was greater for NTCW than NTWP and NTWF in 2012, greater than NTWF and CTWF in 2016, greater than NTWF in 2018, and greater than CTWF in 2019. At 150 kg N ha−1, NUE was greater for NTCW than NTWF in 2018. Increased N fertilization rate decreased NUE for NTCW in 2012, 2014, 2016, 2017, and 2018, but had variable trends for other cropping sequences in all years. In 2013, 2018, and 2019, NUE tended to increase from 50 to 100 kg N ha−1 and declined at 150 kg N ha−1 for NTWF, NTWP, and CTWF. Negative NUE occurred at 50 kg N ha−1 for NTWP in 2013, for CTWF and NTWF in 2017, and for NTWF in 2018; at 100 kg N ha−1 for CTWF and NTWP in 2012, and for CTWF and NTWF in 2017; and at 150 kg N ha−1 for NTWP in 2012 and CTWF in 2017. Averaged across years, NUE was greater for NTCW than CTWF and NTWF at all N fertilization rates ). The NUE was also greater for NTCW than NTWP at 50 kg N ha−1. Increased N fertilization rate decreased NUE for NTCW and CTWF but increased from 50 to 100 kg N ha−1 and then decreased at 150 kg N ha−1 for NTWP and NTWF. The EONR for NUE was 50 kg N ha−1 for CTWF and NTCW and 100 kg N ha−1 for NTWP and NTWF.
Figure 7. Spring wheat grain N-use efficiency (NUE) as affected by cropping sequence and N fertilization rate from 2012 to 2019. Cropping sequences are CTWF, conventional till spring wheat-fallow; NTCW, no-till continuous spring wheat; NTWF, no-till spring wheat-fallow; and NTWP, no-till spring wheat-pea. Markers accompanied by different letters at a N fertilization rate are significantly different at p ≤ 0.05 by the least square means test.
Higher NUE for NTCW than other cropping sequences at most N fertilization rates was due to greater difference in grain yield between N fertilized and unfertilized treatments, as grain yield at 0 kg N ha−1 for this cropping sequence was lower. The reverse was true for other cropping sequences where lower differences in grain yield between N fertilized and unfertilized treatments reduced NUE. This is because the rate of increase in grain yield with increasing N fertilization rate was slower for CTWF, NTWF, and NTWP than NTCW. These results are similar to those reported by several researchers (Pierce and Rice Citation1988; St Luce et al. Citation2020) who demonstrated that NUE was greater for continuous nonlegume cropping than crop rotations containing legumes in Michigan and western Canada. Others (Lin and Chen Citation2014; Mohammed and Chen Citation2018) showed that NUE was not different in spring wheat following nonlegumes, pea, or fallow in central Montana. These results are, however, in contrast to those reported by several researchers (Allen et al. Citation2021; Lenssen et al. Citation2007) who observed greater NUE for spring wheat in spring wheat-pea rotation than continuous spring wheat in eastern and central Montana. The reasons for this are that these researchers did not deduct grain yield at 0 kg N ha−1 from N fertilization rates while calculating NUE, resulting in greater spring wheat yield for spring wheat-pea rotation than continuous spring wheat at similar N fertilization rates and therefore greater NUE for spring wheat-pea rotation.
The result of decreased NUE with increased N fertilization rate for NTCW in this study was similar to those obtained for continuous nonlegume cropping reported by numerous researchers (Campbell et al. Citation1993; Giambalvo et al. Citation2010; Huggins and Pan Citation2003; Raun and Johnson Citation1999; Xu et al. Citation2020; Zhu, Guo, and Peng Citation2011). However, similar or greater NUE at 100 than 50 kg N ha−1 for CTWF, NTWF, and NTWP was due to greater yield. Grain yield declined from 100 to 150 kg N ha−1 (0.06 Mg ha−1 for CTWF to 0.16 to Mg ha−1 for NTWF), resulting in reduced NUE for all cropping sequences as N rate increased. Mean NUE values of 5–23 kg grain kg−1 N observed in this study were either within or slightly greater than 7–15 kg grain kg−1 N for spring wheat reported by Mohammed and Chen (Citation2018) in central Montana, but lower than 19–32 kg grain kg−1 N reported by Huggins and Pan (Citation2003) in Washington. Non-significant differences in NUE between NTWP with 100 kg N ha−1 and NTCW with 100–150 kg N ha−1 ) suggest that NUE can be maintained by using NTWP with 100 kg N ha−1. Because of the lower NUE, CTWF and NTWF with N fertilization cannot recover N more efficiently from applied N fertilizer, which may result in greater soil residual N, development of acidic soil over time, and N loss to the environment (Sainju, Wang, and Barsotti Citation2013). The negative NUE for some treatments and years was due to greater grain yield for N unfertilized than fertilized treatments.
Grain nitrogen recovery index
The NRI was affected by N fertilization rate and year, with significant interactions for cropping sequence × year and N fertilization rate × year (). Averaged across N fertilization rates, NRI was lower for CTWF than other cropping sequences in 2013 (). In contrast, NRI was greater for NTCW than other cropping sequences in 2016 and 2018. In 2014, NRI was greater for CTWF and NTCW than NTWF and NTWP. In 2015 and 2019, NRI was greater for NTWP than NTWF. In 2017, NRI was greater for NTCW than CTWF and NTWF. Averaged across cropping sequences, NRI was greater for 50 than 150 kg N ha−1 in 2012 and 2016, and greater for 100 than 50 or 150 kg N ha−1 in 2014, 2015, and 2019. Averaged across cropping sequences and years, NRI was greater for 100 (40%) than 150 kg N ha−1 (28%), but not different from 50 kg N ha−1 (31%). Negative NRI values occurred for CTWF in 2017 and for NTWF in 2018. The EONR for NRO was 100 kg N ha−1 for all cropping systems.
Larger differences in grain N uptake by spring wheat between N fertilized and non-fertilized treatments due to lower N uptake by non-fertilized treatment resulted in greater NRI for NTCW than other cropping sequences in 5 out of 8 years, a case similar to that observed for NUE. This also occurred for 50 and 100 kg N ha−1 where NRI was greater for 50 than 100 or 150 kg N ha−1 in 2 out of 8 years, and greater for 100 than 50 or 150 kg N ha−1 in 3 out of 8 years. Our results are similar to those reported by Pierce and Rice (Citation1988) and St Luce et al. (Citation2020) who stated that NRI was greater for continuous nonlegume cropping than legume-nonlegume crop rotations in Michigan and west Canada. However, greater NRI for spring wheat-pea rotation than continuous spring wheat reported by Allen et al. (Citation2021) and Lenssen et al. (Citation2007) in eastern and central Montana were in contrast to finding of this study, because these researchers did not deduct spring wheat grain N uptake for N unfertilized treatment from fertilized treatments while calculating NRI. Many researchers (Dalal et al. Citation2011; Rahimizadeh et al. Citation2010; Raun and Johnson Citation1999; Yamoah et al. Citation1998; Zhu, Guo, and Peng Citation2011) showed that increased N fertilization rate to spring wheat decreased NRI, which is in contrast to the results of this study where NRI was greater for 100 than 50 and 150 kg N ha−1. However, our results are similar to those observed by Xu et al. (Citation2020) who found greater spring wheat NRI at 105 kg N ha−1 than other N fertilization rates (53, 158, and 210 kg N ha−1) in central China. The mean NRI values of 27% to 47% across years for spring wheat observed in this study were similar to or lower than 28% to 55% reported by several researchers (Giambalvo et al. Citation2010, Huggins and Pan Citation2003; Raun and Johnson Citation1999). Negative NRI values for CTWF and NTWF in 2017 and 2018 were due to lower N uptake for N fertilized than N unfertilized treatments during dry conditions, as growing season precipitation was below the 30-yr average in these years (). Nitrogen uptake by spring wheat can be lower during the dry condition (Campbell et al. Citation1993; Lenssen et al. Citation2007).
Conclusions
Cropping sequence and N fertilization rate affected variably on dryland spring wheat N relations. Straw N concentration and N uptake were greater for CTWF and NTWF than NTWP and NTCW in most years. Grain N concentration and uptake were similarly greater for CTWF and NTWF than NTCW at most N fertilization and years and greater for NTWP than NTCW at some N fertilization rates and years. In contrast, NUE and NRI were greater for NTCW than CTWF and NTWF at most N fertilization rates and years. Increased N fertilization rate increased straw and grain N concentrations and N uptake for most cropping sequences and years but had variable trends for NUE and NRI. Cropping sequence and N fertilization rate had inconsistent effect on NHI. The NTWP with 50 kg N ha−1 can sustain spring wheat N concentration, N uptake, and NHI, but NTCW with 50–100 kg N ha−1 had greater NUE and NRI. Because NTCW can reduce grain yield and N uptake due to increased infestation of weeds and pests, NTWP with 50–100 kg N ha−1 may be ideal management practices to sustain N relations in spring wheat. Although grain N concentration and N uptake were greater, CTWF and NTWF with or without N fertilization rates are not recommended to enhance spring wheat N relations because of their lower annualized grain yield, NUE, and NRI as well as their adverse effects on soil health and environmental quality.
Acknowledgements
I am sincerely grateful for the field assistance and data collection provided by Michael Johnson, Mark Gaffri, Joy Barsotti, Chloe Turner, and James Allen for plot management and for Chloe Turner, Nancy Webb, and Margaret Duffy for collection and analysis of soil and plant samples. Mention of trade names or commercial products in this publication is solely for the purpose of providing specific information and does not imply recommendation or endorsement by USDA. The USDA is an equal opportunity employer.
Disclosure statements
No potential conflict of interest was reported by the authors.
References
- Allen, B. L., A. W. Lenssen, U. M. Sainju, J. D. Jabro, and W. B. Stevens. 2021. “Nitrogen Use in Spring Wheat Affected by Crop Diversification, Management, and Tillage.” Agronomy Journal 113 (3): 2437–2449. https://doi.org/10.1002/agj2.20686.
- Black, A. L., and D. L. Tanaka. 1997. “A Conservation Tillage System Study in the Northern Great Plains of the United States.” In Soil Organic Matter in Temperate Ecosystems. Long-Term Experiments in North America, edited by E. A. Paul, 335–342. Boca Raton, FL: CRC Press. https://doi.org/10.1201/9780367811693-24.
- Blankenau, K., H. W. Olfs, and H. Kuhlmann. 2002. “Strategies to Improve the Use Efficiency of Mineral Fertilizer Nitrogen Applied to Winter Wheat.” Journal of Agronomy and Crop Science 188 (3): 146–154. https://doi.org/10.1046/j.1439-037X.2002.00548.x.
- Campbell, C. A., R. P. Zentner, F. Selles, P. G. Jefferson, B. G. McConkey, R. Lemke, and B. J. Blomert. 2005. “Long-Term Effect of Cropping System and Nitrogen and Phosphorus Fertilizers on Production and Nitrogen Economy of Grain Crops in a Brown Chernozem.” Canadian Journal of Plant Science 85 (1): 81–93. https://doi.org/10.4141/P03-215.
- Campbell, C. A., R. P. Zentner, F. Selles, B. G. McConkey, and F. B. Dyck. 1993. “Nitrogen Management for Spring Wheat Grown Annually on Zero Tillage. Yield and Nitrogen-Use Efficiency.” Agronomy Journal 85 (1): 107–114. https://doi.org/10.2134/agronj1993.00021962008500010021x.
- Crews, T. E., and M. B. Peoples. 2004. “Legume Vs. Fertilizer Sources of Nitrogen. Ecological Tradeoffs and Human Needs.” Agriculture, Ecosystems and Environment 102 (3): 279–297. https://doi.org/10.1016/j.agee.2003.09.018.
- Dalal, R. C., W. Wang, D. E. Allen, S. Reeves, and N. W. Menzies. 2011. “Soil Nitrogen and Nitrogen-Use Efficiency Under Long-Term No-Till Practice.” Soil Science Society of America Journal 75 (6): 2251–2261. https://doi.org/10.2136/sssaj2010.0398.
- Drinkwater, L. E., P. Wagoner, and M. Sarrantonio. 1998. “Legume-Based Cropping Systems Have Reduced Carbon and Nitrogen Losses.” Nature 396 (6708): 262–264. https://doi.org/10.1038/24376.
- Giambalvo, D., P. Ruisi, G. Di Miceli, A. S. Frenda, and G. Amato. 2010. “Nitrogen-Use Efficiency and Nitrogen Fertilizer Recovery of Durum Wheat Genotypes As Affected by Interspecific Competition.” Agronomy Journal 102 (2): 707–715. https://doi.org/10.2134/agronj2009.0380.
- Halvorson, A. D., B. J. Wienhold, and A. L. Black. 2002. “Tillage, Nitrogen, and Cropping System Effects on Soil Carbon Sequestration.” Soil Science Society of America Journal 66 (3): 906–912. https://doi.org/10.2136/sssaj2002.9060.
- Heggenstaller, A. H., K. J. Moore, M. Liebman, and R. P. Anex. 2009. “Nitrogen Influences Biomass and Nutrient Partitioning by Perennial, Warm-Season Grasses.” Agronomy Journal 101 (6): 1363–1371. https://doi.org/10.2134/agronj2008.0225x.
- Huggins, D. R., and W. L. Pan. 2003. “Key Indicators for Assessing Nitrogen-Use Efficiency in Cereal-Based Agroecosystems.” Journal of Crop Production 8 (1–2): 157–185. https://doi.org/10.1300/J144v08n01_07.
- Karlen, D. L., G. E. Varvel, D. G. Bullock, and R. M. Curse. 1994. “Crop Rotation for the 21st Century.” Advances in Agronomy 53:2–45. https://doi.org/10.1016/S0065-2113(08)60611-2.
- Lenssen, A. W., U. M. Sainju, J. D. Jabro, W. M. Iversen, B. G. Allen, and R. G. Evans. 2014. “Crop Diversification, Tillage, and Management System Influence Spring Wheat Yield and Water Use.” Agronomy Journal 106 (4): 1445–1454. https://doi.org/10.2134/agronj14.0119.
- Lenssen, A. W., J. Waddell, G. Johnson, and G. Carlson. 2007. “Diversified Cropping Systems in Semiarid Montana: Nitrogen Use During Drought.” Soil and Tillage Research 94 (2): 362–375. https://doi.org/10.1016/j.still.2006.08.012.
- Limaux, F., S. Recous, J. M. Meynard, and A. Guckert. 1999. “Relationship Between Rate of Crop Growth at Date of Fertilizer Nitrogen Application and Fate of Fertilizer Nitrogen Applied to Winter Wheat.” Plant and Soil 214 (1/2): 49–59. https://doi.org/10.1023/A:1004629511235.
- Lin, R., and C. Chen. 2014. “Tillage, Crop Rotation, and Nitrogen Management Strategies for Wheat in Central Montana.” Agronomy Journal 106 (2): 475–485. https://doi.org/10.2134/agronj2013.0316.
- Littell, R. C., G. A. Milliken, W. W. Stroup, and R. D. Wolfinger. 1996. SAS System for Mixed Models. Cary, NC: SAS Institute Inc.
- Miller, P. R., Y. Gan, B. G. McConkey, and C. L. McDonald. 2003. “Pulse Crops for the Northern Great Plains: I. Grain Productivity and Residual Effects on Soil Water and Nitrogen.” Agronomy Journal 95 (4): 972–979. https://doi.org/10.2134/agronj2003.9720.
- Mohammed, Y. A., and C. Chen. 2018. “Cropping System Affect Wheat Yields, Nitrogen-Use Efficiency, and Nitrous Oxide Emissions.” Agronomy Journal 110 (3): 1147–1156. https://doi.org/10.2134/agronj2017.06.0367.
- Nouriyani, H., E. Majidi, S. M. Seyyednejad, S. A. Saidat, and A. Naderi. 2012. “Evaluation of Nitrogen-Use Efficiency of Wheat As Affected by Nitrogen Fertilizer and Different Levels of Paclobutrazol.” Research on Crops 13 (2): 439–445.
- O’Leary, G. J., and D. J. Comer. 1997. “Stubble Retention and Tillage in a Semi-Arid Environment. 3. Response of Wheat.” Field Crops Research 54 (1): 39–50. https://doi.org/10.1016/S0378-4290(97)00036-1.
- Pierce, F. J., and C. W. Rice. 1988. “Crop Rotation and Its Impact on Efficiency of Water and Nitrogen Use.” In Cropping Strategies for Efficient Use of Water and Nitrogen, edited by B. G. Ellis and W. L. Hargrove, 21–42. Madison, WI: American Society of Agronomy. https://doi.org/10.2134/asaspecpub51.c3.
- Pilbeam, C. J., A. M. McNeill, H. C. Harris, and R. S. Swift. 1997. “Effect of Rotation on the Recovery of 15N-labelled Fertilizer Applied to Wheat Grown in Northern Syria.” Journal of Agricultural Science (Cambridge) 129 (4): 397–407. https://doi.org/10.1017/S0021859697004905.
- Rahimizadeh, M. A., A. Kashani, A. Zare-Feizabadi, R. Koocheki, and M. Nassiri-Mahaleti. 2010. “Nitrogen-Use Efficiency of Wheat As Affected by Preceding Crop, Application of Nitrogen, and Crop Residues.” Australian Journal of Crop Science 4:363–368.
- Raun, W. R., and G. V. Johnson. 1999. “Improving Nitrogen-Use Efficiency in Cereal Production.” Agronomy Journal 91 (3): 357–363. https://doi.org/10.2134/agronj1999.00021962009100030001x.
- Sainju, U. M. 2019. “Improving Nitrogen Balance with Irrigation Practice and Cropping System.” Journal of Soil and Water Conservation 74 (6): 622–631. https://doi.org/10.2489/jswc.74.6.622.
- Sainju, U. M., B. L. Allen, T. Caesar-TonThat, and A. W. Lenssen. 2015. “Dryland Soil Carbon and Nitrogen After Thirty Years of Tillage and Cropping Sequence.” Agronomy Journal 107 (5): 1822–1830. https://doi.org/10.2134/agronj15.0106.
- Sainju, U. M., J. Wang, and J. L. Barsotti. 2013. “Net Global Warming Potential and Greenhouse Gas Intensity Affected by Cropping Sequence and Nitrogen Fertilization.” Soil Science Society of America Journal 78 (1): 248–261. https://doi.org/10.2136/sssaj2013.08.0325.
- Sharma, L. K., and S. K. Bali. 2017. “A Review of Methods to Improve Nitrogen-Use Efficiency in Agriculture.” Sustainability 10 (1): 1–23. https://doi.org/10.3390/su10010051.
- Smil, V. 2004. Enriching the Earth. Cambridge, MA: Massachusetts Institute of Technology Press.
- St Luce, M., L. Lemke, Y. Gan, M. McConkey, W. May, C. Campbell, R. Zentner, et al. 2020. “Diversifying Cropping Systems Enhance Productivity, Stability, and Nitrogen-Use Efficiency.” Agronomy Journal 112 (3): 1517–1536. https://doi.org/10.1002/agj2.20162.
- Szmigiel, A., N. Kolodziejczyk, O. Andrzej, and B. Kulig. 2016. “Efficiency of Nitrogen Fertilization in Spring Wheat.” International Journal of Plant Production 10 (4): 117–456.
- Xu, A., L. Li, J. A. Coulter, J. Xie, S. Gopalakrishnan, R. Zhang, Z. Luo, et al. 2020. “Long-Term Nitrogen Fertilization Impacts on Soil Bacteria, Grain Yield, and Nitrogen-Use Efficiency of Wheat in Semiarid Loess Plateau, China.” Agronomy 10 (8): 1175. https://doi.org/10.3390/agronomy10081175.
- Yamoah, C. F., G. E. Varvel, W. J. Waltman, and C. A. Francis. 1998. “Long-Term Nitrogen Use and Nitrogen Removal Index in Continuous Crops and Rotations.” Field Crops Research 57 (1): 15–27. https://doi.org/10.1016/S0378-4290(97)00109-3.
- Zhu, S. K., W. S. Guo, and Y. X. Peng. 2011. “Enhancing Nitrogen-Use Efficiency by Combinations of Nitrogen Application Amount and Time in Wheat.” Journal of Plant Nutrition 34 (12): 1747–1761. https://doi.org/10.1080/01904167.2011.600403.