
 ?Mathematical formulae have been encoded as MathML and are displayed in this HTML version using MathJax in order to improve their display. Uncheck the box to turn MathJax off. This feature requires Javascript. Click on a formula to zoom.
Abstract
We operationalize Stein’s (Citation2009) overcrowding concept in the context of investor response to daily stock return shocks and examine its underlying behavioral motivation. We define chasing at the overshooting point as evidence of overcrowding. Using trading data by investor type from Korea, we find that while institutional investors display informed trading, they fail to recognize the predictable overshooting point when responding to return shocks and/or accompanying information, resulting in an overcrowded response. The main consequence is suffering a cost of immediacy. Size of institutional crowding is positively related to the size of initial response and institutional investor population, but unrelated to future returns, with no evidence of adapting to past performance; collectively consistent with overcrowding driven by aversion to miss out.
Introduction
The overcrowding phenomenon (excess chasing by institutional investors after return/information shocks, over and above what is needed for stock prices to fully adjust to new information), first discussed by Stein (Citation2009), attracts increasing attention in the academic literature and among practitioners: Does increasing dominance of sophisticated professional investors lead to greater market efficiency, or cause overcrowding and a different form of departure from market efficiency?
Most of this interest, however, is focused on the subsequent consequences of overcrowding such as future negative performance of overcrowded positions or increasing probability of crashes associated with fire sales of overcrowded positions. We rather attempt to identify overcrowding as it emerges, based on its essential feature, Stein’s (Citation2009) point of origin: when chasing information signals in the absence of a fundamental anchor, sophisticated institutional investors as a group may end up buying when F < Pt or selling when F > Pt at some point, because they do not precisely know F (Pt = stock price, F = fundamental value). Our focus is on the recurring aspects of overcrowding and its underlying behavioral motivations.
Existing empirical studies of institutional overcrowding employ settings based on medium-term momentum strategies and seek a relation between the amount of strategy positions and the subsequent performance of the strategy or probability of crashes (e.g., Cahan and Luo Citation2013; Yan Citation2013; Zhong, Ding, and Tay Citation2017; Barroso, Edelen, and Karehnke Citation2017; Chen Citation2018).Footnote1 However, the essential element in the definition of overcrowding is whether the size of arbitrageur activity exceeds that needed for the stock price to converge to its fundamental value and whether the excess is associated with an overshooting of the stock price. The subsequent negative performance or crashes (i.e., negative skewness in strategy returns) are only a potential symptom of overcrowding. Overcrowding can occur without these symptoms, and the emerging literature cited above usually does not find overcrowding to be a reliable predictor of these symptoms. Institutional investors can combine fundamental analysis with quantitative strategies; hence, the size of crowding may be correlated with fundamental information, offsetting negative effects on subsequent performance.
We address the above-stated essential element of overcrowding from the perspective of immediate investor response to firm-specific return/information shocks. To average out all varieties of information events in a recurring empirical setting, we focus on stocks in the most-winner and -loser deciles of the daily ranking. These stocks capture firm-specific return shocks in diversified portfolios of positive and negative information events every day, providing an ideal setting for studying the overcrowding phenomenon. We start by showing that daily most-winner and loser stocks display a nearly identical short-horizon overshooting-followed by-reversal pattern in the US stock market and the Korea Stock Exchange (KRX). The unique KRX daily trading data disaggregated by investor type then enables us to study the overcrowding phenomenon with high precision and at the daily frequency.Footnote2
To bridge existing theory with the ideal empirical setting described above, we construct a real-life counterpart of Stein’s (Citation2009) model. This simple model incorporates institutional investors, who can combine fundamental analysis and technical strategies, and individual investors, who underreact due to informational disadvantages and a behavioral contrarian tendency. Thus, we take the hypothetical newswatcher – momentum arbitrageur dichotomy in Stein’s (Citation2009) model to a real-life market setting as represented by available empirical data. An important distinction of our model is to derive overcrowding from institutional investors’ aversion to miss out important stock moves (see Johnson Citation2016), not from a combination of naïve extrapolative strategies and uncertainty over aggregate arbitrage activity that each individual arbitrageur faces in Stein’s (Citation2009) model. This feature makes our model predict overcrowding independent of arbitrage considerations.
We find that institutional overcrowding, in its essential definition stated above, takes place virtually every day. This happens because domestic institutions, as a group, fail to recognize the overshooting point when responding to return and/or information shocks, although they prove, under various appraisals, to be the most-informed investor type. Hence, nonoptimal crowding and informed trading are displayed by the same investor type. The key is institutional investors’ failure, as a group, to recognize the point where chasing return shocks and/or accompanying information is associated with overshooting. An economically important portion (36.5%) of total institutional response to return shocks comes at the overshooting point which takes place briefly after the return shock and is followed by a mild reversal. Hence, the more direct outcome of overcrowding is incurring a cost of immediacy due to, as we discuss below, aversion to miss out.Footnote3
Analyzing the dynamic variation of the size of institutional crowding, we find that it is unrelated to future returns and current or recent level of individual investor underreaction, does not adapt to the past performance of the strategy, but is positively related to the size of the return shock or the initial institutional response and the size of the institutional investor population in the stock market. The flat relation between crowding and future returns justifies our focus on identifying overcrowding as it occurs, not by subsequent performance. Not adapting to the past performance of a positive-feedback strategy, not adjusting to the level of individual investor underreaction and the recurring regret collectively suggest that nonoptimal overcrowding is not motivated by arbitrage considerations, rather probably serves fund managers’ aversion to miss out.
We exploit a special feature of KRX to test alternative motivations behind overcrowding. In KRX, daily data on trading by investor types for each stock are made publicly available by the next trading day, so institutions can have timely information on aggregate positioning. This provides a natural control for uncertainty on the size of aggregate arbitrage activity, which is key for overcrowding in Stein’s (Citation2009) model, hence, offers a unique opportunity to assess the proposed mechanism. The finding that institutional chasing is still associated with overshooting in this full-information environment suggests that uncertainty over aggregate arbitrage capacity is not a necessary condition for overcrowding to occur. Furthermore, Stein (Citation2009) presumes that arbitrageurs would decrease their positive feedback trading if they observed a large amount of aggregate momentum activity. In contrast, chasing driven by aversion to miss out and peer effects would increase upon observing a large amount of aggregate initial momentum activity. We find that the relation between the size of initial institutional response and subsequent overcrowding is positive rather than negative; and moreover, it dominates the positive relation between the size of the return shock and subsequent overcrowding. This rules out arbitrage considerations as the motivation behind overcrowding and supports our construction based on aversion to miss out which contains an element of herding.
A number of recent models offer potential motivations for this kind of nonoptimal return-chasing by institutional investors based on agency issues inherent in delegated investment management, such as career concerns (Dasgupta, Prat, and Verardo Citation2011b, Scotti Citation2012) and peer effects driven by tournament-type preferences (Johnson Citation2016). Essentially, we connect these models with Stein’s (Citation2009) overcrowding concept. Accordingly, portfolio managers, averse to missing out trends or to underperforming relative to their peers or benchmarks, have a strong motivation to chase return shocks regardless of the overshooting point and incur a cost of immediacy, resulting in overcrowding and a transitory over-reaction.
Existing empirical work using institutional holdings to assess peer effect models’ predictions is confined to low-frequency data and finds indirect evidence of overcrowding at longer horizons.Footnote4 Our short-horizon results parallel these findings, suggesting that the same failure of institutional investors to recognize the overshooting point occurs at multiple time horizons, like a self-similar fractal. Regarding the source of nonoptimal crowding, Edelen, İnce, and Kadlec (Citation2016) reject client flows and limits-of-arbitrage explanations and find that agency-induced preferences underlie institutions’ nonoptimal behavior. Utilizing the detailed break-down of institutional investor subcategories in KRX data, we find that overshooting (especially when buying winners) is most pronounced at those types of institutions in which the relative performance of the fund manager is closely monitored, and not at proprietary institutions. Further, the very short time span in our case offers a natural control for client-flow theories: it is difficult to trace a pension fund’s or an insurance company’s trading decisions in previous day’s winner and loser stocks to client flows. Thus, a client-flow based mechanism, as in Vayanos and Woolley’s (2013) model and Lou’s (Citation2012) empirical evidence, is not likely to be the explanation for overcrowded institutional responses to return shocks in our daily setting.
Our study provides the following additional contributions to the behavioral finance literature. First, the complete picture our study depicts suggests that the delegated institutional investment process on one hand provides a remedy for individual investor biases such as naïve contrarian trading and makes stock prices more responsive to information, but on the other hand leads to an overcrowded response to return shocks. Second, our model offers a characterization of stock markets where individual investors have substantial presence. Given the rise of Asian stock markets (e.g., Chinese stock market, the world’s second largest) dominated by individual investors, our model takes a step in filling an important gap. Finally, on the practical side, our findings offer useful information to sensitize portfolio managers to a recurring nonoptimal aspect of their trading behavior.
The article is organized as follows. In the second section, we describe our empirical setting, investor trading data, and develop a counterpart of Stein’s (Citation2009) model that matches our empirical setting. In the third section, we document institutional investor overcrowding on a daily-recurring basis in response to idiosyncratic return shocks and analyze its properties. The fourth section summarizes the conclusions.
Underlying theory and empirical setup
In this section, we start with a reminder of Stein’s (Citation2009) model; then, introduce our investor trading data and develop a version of Stein’s (Citation2009) model compatible with these empirical data. Then, we document a recurring overshooting pattern in response to daily idiosyncratic return shocks in the US and Korean stock markets and define it as an empirical counterpart of the scenario in Stein’s (Citation2009) theoretical model. This completes our setup.
An overview of Stein’s (Citation2009) model of overcrowding
We start with a brief reminder of Stein’s (Citation2009) simple model to analyze the crowded-trade problem. The model’s key feature is the lack of a fundamental anchor, which undoubtedly is a defining characteristic of stock trading: the fundamental value F is not precisely known by arbitrageurs. The model setup is based on a stock which pays a terminal dividend of V = F + ε at time 2, where ε ∼N(0,1), F ∼ N(0,1) and F0 = 0. The supply of the stock is 0, so the starting price P0 = 0. At time 1 new information is seen by newswatchers (with unit aggregate risk tolerance) who under-react to it forming a biased expectation of V, En(V) = F(1 − δ), where 0 < δ < 1 measures the extent of their under-reaction. If they are the only players in the market, the time-1 price is P1 = F(1 − δ). The return from time 0 to 1, R1, equals P1 and the return from time 1 to 2 is given by R2 = V − P1 = δF + ε = [δR1/(1 − δ)] + ε. E(R2 | R1) = δR1/(1 − δ). Thus, R2 and R1 are positively autocorrelated and more so when δ is large, creating an arbitrage opportunity which is exploited by a group of rational arbitrageurs who also have mean-variance preferences and an aggregate risk tolerance of n.
The market outcome with arbitrageurs depends on: (i) whether or not the arbitrageurs observe F, (ii) whether there is any uncertainty about total arbitrage capacity n. When arbitrageurs observe F, they use it to form an unbiased estimate of V. Newswatcher and arbitrageur demand at time 1 is given by Dn = F(1 − δ) − P1 and Da = n(F − P1), respectively. Thus, when arbitrageurs have a fundamental anchor, they condition their demand directly on F; and, demand is, therefore, a decreasing function of price. Setting total demand equal to the supply of 0, P1 = F – [δF/(1 + n)]. Thus, more arbitrage always pushes prices closer to fundamentals: as arbitrage capacity n increases, the under-reaction bias is monotonically reduced.
When arbitrageurs cannot observe F at time 1, that is, when they have no fundamental anchor, they are still aware of newswatchers’ under-reaction bias even though they cannot condition on F. Under these conditions, the arbitrageurs can make a profit by using a technical trading strategy, where their demand takes the form Da = nφP1 = nφR1 and φ is determined endogenously by arbitrageurs’ optimization. In other words, arbitrageurs make an inference about future expected returns based on the current price P1 (or equivalently, the most recent return R1). This demand yields P1 = F(1 − δ)/(1 − nφ). If both total arbitrage capacity n and newswatcher bias δ are fixed constants, this case yields the same outcome as the one in which the arbitrageurs observe F directly, because arbitrageurs can infer F based on P1 if they know both n and δ. This time, however, arbitrageurs implement their optimization differently: in equilibrium, φ = δ/(1 + n − δ) > 0 meaning that arbitrageurs now employ a momentum strategy. Thus, their individual demands are an increasing function of price, rather than a decreasing function which arises when they condition directly on F. This distinction is of no consequence for equilibrium prices when aggregate arbitrage capacity is fixed, but is of crucial importance when there is uncertainty of the size of arbitrage activity.
To introduce uncertainty of the size of arbitrage activity, Stein (Citation2009) writes n = Nθ, where N is the expected arbitrage capacity, and θ is a random variable. This formulation implies that uncertainty about the size of arbitrage activity on any given trade goes up with the size of the arbitrage sector (N). Each individual arbitrageur’s demand function da = φR1 may no longer be unconditionally optimal when n is random. Stein (Citation2009) rules out nonlinear strategies. φ is still endogenous, so strategies are by definition optimal within the linear class, and arbitrageurs make nonnegative expected profits. As demands have the same form, P1 = F(1 − δ)/(1 − nφ) continues to apply. However, P1 is no longer a summary statistic for F, since it now is also influenced by a second random variable, n. Here, individual arbitrageurs who formulate their demand based on just R1 get exposed to risk: a large positive R1 could reflect a large realization of F, or a small positive realization of F combined with an unexpectedly high level of momentum trading activity n. In the latter case, P1 may have overshot its fundamental value, due to excessive arbitrage activity in the absence of a fundamental anchor, and individual arbitrageur would rather be better off taking a contrarian trade.
By analyzing a limiting risk-neutral case, Stein (Citation2009) derives the following conclusions: P1 under-reacts (over-reacts) to the fundamental F when there is a low (high) realization of θ. There is a balance of under- and over-reaction across realizations of θ so that the zero-profit condition is satisfied. The average absolute distance between price and fundamentals, E│(P1 − F)/F│, can be either greater or smaller with infinite arbitrage, as compared to the case of zero arbitrage. Thus, the market can actually be less efficient when there is infinite arbitrage. This is a more likely outcome when the variance of θ is greater. Increased values of N can have the expected stabilizing effect of arbitrage; but they can also act as a form of endogenous noise trade. When N goes to infinity and predictability in returns is eliminated, arbitrageurs move the market from an equilibrium in which price is a biased reflection of the signal F to one in which price is an unbiased reflection of a degraded signal, a noisy combination of F and θ.
Investor trading data
Few stock markets across the world offer complete and precise daily trading data disaggregated by investor type for sufficiently long periods to investigate the overcrowding phenomenon on a daily basis. Among these, the largest market with relevant characteristics similar to the world's major developed markets is the KRX. The similarity of the below-described return pattern on KRX and the US stock market ensures transferability of our findings. KRX is #12 stock market in the world in terms of traded value (World Federation of Exchanges, 2014 statistics). KRX dataset offers important advantages: Precise and complete measurement of all trading in a country’s centralized stock exchange and exact identification of investor types yield a high level of precision which is rarely present in existing studies. The dataset also provides a rich breakdown of institutional investor subcategories, which allows us to link the trading motivations of institutions to the overcrowding phenomenon. KRX features substantial domestic and international institutional investor participation and stock return behavior similar to the world’s major developed markets. Thus, findings on KRX bear the potential to provide insight relevant for major developed markets.
The daily dataset of trading flows with investor type identification was supplied to us by the Korea Exchange. It is exact, as it is compiled from transactions electronically, and complete, as it contains all trades in every stock in the country’s centralized market. Investor types are classified by the Exchange from trader identities. The data consist of daily aggregated figures; we are unable to track trader identities.
Three main investor types are individuals, domestic institutions and foreign investors (predominantly institutional). Domestic institutions are further broken down into nine subcategories, listed in the section, Subcategories of Institutional Investors. The daily net trading flow (i.e., trading imbalance) of a particular investor type () is defined as the value of purchases minus sales by investor type m on day t in stock i, normalized by daily market capitalization of stock i. Positive (negative) values imply net buying (selling). Summary statistics of net trading flows and raw stock returns are in the Supporting Information.Footnote5
A counterpart of Stein’s (Citation2009) model
It is now well-known that, in stock markets on average, institutional investors are momentum traders, and individuals are contrarians when trading in institutional habitat (e.g., Kaniel, Saar, and Titman Citation2008; Ülkü and Weber Citation2013; Barrot, Kaniel, and Sraer Citation2016). This results from institutional investors’ responding to new information, while retail investors are mostly preoccupied with their effort to buy low and sell high with recent prices serving as heuristic reference points. As a result of this natural match, individual investors end up serving as counterparty to institutional investors consuming liquidity.Footnote6 It is also well-known that institutions’ momentum trading helps eliminate under-reaction (Cohen, Gompers, and Vuolteenaho Citation2002; Ke and Petroni Citation2004; Yan and Zhang Citation2009), to which, Hvidkjaer (Citation2006), Kaniel et al. (Citation2012) and Eom, Hahn, and Sohn (Citation2019) find, individual investors’ contrarian trading contributes.
In this section, we construct a counterpart of Stein’s model that incorporates features of the above-described trading environment and investor types as represented by the empirical data. This model is representative of most Asian stock markets where liquidity provision results endogenously from trading between individual and institutional investor types of comparable aggregate size. In such environments, suppliers and consumers of liquidity can be identified from the contemporaneous correlations between investor types' net trading and stock returns in : in the KOSPI-200 segment, where institutional investor presence is substantial, the net consumers are domestic and foreign institutions, and the net suppliers are individual investors (not necessarily deliberately). The sole difference between KRX and the US stock market lies here: in a market with comparable trading volume of individual and institutional investors, individual investors serve as counterparties to institutional investors consuming liquidity and solving the counterparty problem, which, as we argue below, is largely driven by their behavioral traits. In the US stock market, where institutional trading accounts for more than 90% of total trading volume, most of the liquidity provision and consumption takes place among institutional investors, and heterogeneity among institutions dictates a further breakdown into mutual funds versus more proprietary institutional investors; yet yielding the same outcomes. In KRX, each main investor type can be regarded as relatively homogeneous units, as in our model.
Table 1. Market participant and stock size structure of the Korea stock exchange.
Existing literature offers mechanisms inducing investor types to take on these liquidity supplier or consumer roles. The positive correlation of institutional investors’ net trading with stock returns can result from responding to information, intraday positive feedback trading and exogenous liquidity-motivated trading having a price impact due to its size and urgency; see Nofsinger and Sias (Citation1999), Hvidkjaer (Citation2008), Campbell, Ramadorai, and Schwartz (Citation2009), Ülkü and Weber (Citation2013), among others. Individual investors’ negative correlation is consistent with the findings of Kaniel, Saar, and Titman’s (Citation2008) on the US, Dorn, Huberman, and Sengmueller (Citation2008) and Barrot, Kaniel, and Sraer (Citation2016) on Europe, and Bloomfield, O’Hara, and Saar’s (Citation2009) experimental evidence. Such contrarian behavior mainly results from an attempt to buy low and sell high (Batista et al. Citation2017) using, deprived of private information, recent prices as reference points (Baucells, Weber, and Welfens Citation2011). This behavioral trait leads to negatively sloped net demand.
The trading behavior of these two investor types can be articulated in a simple model built on Stein’s (Citation2009) framework, as follows. Institutional investors take the combined role of newswatchers and technical arbitrageurs in Stein’s (Citation2009) model. This key modification is based on the fact that institutional investors in real life are known to employ both fundamental analysis and technical strategies. Available datasets capture institutional investors as a group; no daily trading dataset has newswatchers and technical arbitrageurs as purely identified agents. The aggregate institutional investor observes F partially and can also condition on R1.
Every day, our event definition (described in the next subsection) sets a new independent round of the scenario in Stein’s (Citation2009) model in the form of pure idiosyncratic return-shock portfolios. These shocks arise from both public and private information. The new information arrival on day t, Ft, is a combination of public and private information shocks. All investors observe public information and rationally respond to it. The first source of under-reaction arises as a smaller proportion of institutional investors and a larger proportion of individual investors cannot observe the private information component. Driven by differential access to private information, 0 ≤ δinst < δind < 1, with values of δs depending on the proportion of private information within F. (Thus, our model can allow δ uncertainty by variation in the overall composition of public versus private information arrivals or treat δs as constants averaged out across stocks within arbitrage portfolios and over time).
Individual investors’ aggregate demand at time 1 has an information component written as F(1− δind) – P1. Their demand function has also a second, behavioral component that results from their uninformed attempt to buy low and sell high. They judge whether a price is high or low by comparing it to recent prices, a specific form of bounded rationality for uninformed investors. This type of trading behavior has been strongly supported in Bloomfield, O’Hara, and Saar’s (Citation2009) and Batista et al.’s (Citation2017) experiments. Our characterization, which we refer to as “uninformed attempt to buy low and sell high with reference points based on recent prices,” encompasses well-documented behavioral traits of individual investors: the disposition effect, belief in mean reversion and out-of-money limit order submission (which results in price-contingent trading vulnerable to adverse selection, see Linnainmaa Citation2010). This behavioral component of individual investor demand takes the form of β(P1 – P0) where β < 0 is assumed to be a fixed behavioral parameter. Thus, a second source of under-reaction arises due to the contrarian behavioral traits of individual investors. Individual investor demand at time 1 is written as: Dind = F(1−δind) – P1 + β(P1 – P0).
All features of market structure and investor risk preferences in our model, hence, the solution of the equilibrium, are the same as in Stein (Citation2009). In the absence of institutional investors, setting Dind = 0 under P0 = 0 yields: which implies that a market consisting of individual investors only will under-react for two separate reasons, with the degree of under-reaction increasing in δind and │β│.
Since not all institutional investors can timely observe the private component of F, δinst is typically nonzero. As institutional investors know this and have strong incentives not to miss out any important stock moves, they use the information in P1 = R1 to guess the private information that they may not have access to. Thus, while δinst > 0 is a third potential source of under-reaction, aversion to miss out induces institutional investors to strongly respond to current and most recent returns, such that the aggregate institutional investor does on average not under-react, consistent with prior empirical findings. Institutional demand at time 1 is given by: Dinst = F(1−δinst) – P1 + φ(P1 – P0), where φ is strictly positive. In Stein (Citation2009), arbitrageurs’ sole motivation for momentum trading is the possibility that P1 under-reacts. We argue that aversion to miss out makes institutional investors infer information from recent returns to deal with their imperfect access to private information. Thus, our model differs from Stein (Citation2009) in terms of trader motivation, although it has the same form. Chasing due to aversion to miss out may appear like a positive feedback trading strategy or herding. Sticking to Stein’s (Citation2009) framework which uses past prices, our model is making use of Bickhchandani and Sharma’s (2000) concept of herding appearing as positive feedback trading. Our model’s difference from Stein’s simple technical strategy will be visible when past institutional trading is controlled for: since peer effects are more strongly associated with aversion to miss out, we expect past institutional trading to dominate past returns in driving institutional crowding; a proposition we will test empirically in the section, The Dynamics of Institutional Crowding and Implications.
In the absence of a fundamental anchor (i.e., a perfect assessment of valuation implications of F which they can only imperfectly observe), aversion to miss out makes institutions end up overcrowding. Our model does not rely on uncertainty over total arbitrage activity. Institutional investors motivated by the fear of missing out do not care about total arbitrage activity at work; they just want to be on the right side. Consequently, φ is not endogenously determined by optimization. Our characterization offers a motivation for institutions to set φ high without having to introduce uncertainty about n. This feature makes our model predict overcrowding regardless of uncertainty over aggregate arbitrage activity.
The equilibrium condition with institutional and individual investors both present, Dind + Dinst = 0, yields: F(1−δind) − P1 + βP1 + F(1−δinst)−P1 + φP1 = 0 = >
(2)
(2)
and R2 = V – P1 = F + ε −
= > E(R2) =
Depending on the values of the δind, δinst, φ and β parameters, P1 can overshoot, undershoot or be equal to F. It is straightforward to see that R2 is increasing in δind and δinst, and decreasing in φ and β [∂R2/∂φ = (δind + δinst −2)/(2 − β − φ)2 < 0 and ∂R2/∂β = (δind + δinst −2)/(2 − β − φ)2 < 0 under the sufficient condition of 1 > δind > δinst presumed from the outset]. Typically, a high φ results in overshooting along with overcrowding.
The above model captures in a simple way many characteristics of order-driven electronic markets without dealers, where institutional and individual investors comprise comparable shares in trading volume. Such markets constitute a large portion of world stock markets. Existing models generally fail to incorporate observed correlations among investor types’ net trading and returns reported in . Most existing models employ theoretical investor types which cannot be identified by econometrician or captured by available datasets of real-life investor types’ trading.
An empirical setup that replicates the scenario in Stein’s (Citation2009) model on a daily basis
In order to capture the recurring pattern by which stock market participants respond to return shocks and/or accompanying information, we envision an ideal setting that yields sufficiently long samples of recurring information events averaging out peculiar cases. The setting closest to this ideal can be obtained by garnering daily idiosyncratic return shocks. As a systematic way of eliciting idiosyncratic return shocks, each day we rank stocks by daily returns and take the most-winner and most-loser decile portfolios, W and L respectively. The winner-minus-loser (WML) portfolio represents a pure information event, as simulated in Stein’s (Citation2009) model. As the results in (further below) indicate, the return pattern of the WML portfolio is nearly identical for the US stock market and the KRX. Hence, our research strategy is first to document the similarity of the pattern in the US and KRX, and then to analyze overcrowding utilizing the unique KRX investor trading data.
Table 2. Returns to the WML portfolio.
The solid line in illustrates the pattern by plotting the cumulative returns of the WML portfolio for KRX. With some adaptation of periods in the event-time scale, this pattern essentially replicates the scenario in Stein’s (Citation2009) model: The close of day −1 is the model’s time 0. Information arrives on day 0 and newswatchers respond to it on the same day, then arbitrageurs determine their demand on day 1, all of which correspond to model’s time 1. By day 5 the market price converges to the fundamental value V and stabilizes thereafter, as in time 2 which is the terminal period of Stein’s model. As the WML portfolio contains 40 stocks (20 each in the long and short legs) in KRX and approximately 500 in each leg in the US stock market, idiosyncratic effects are eliminated; we can regard the WML portfolio as a pure return-shock factor.
Figure 1. The return pattern of portfolios sorted by daily returns and daily net institutional buying.
Notes: The solid line shows cumulative raw returns of the Winner-minus-Loser (WML) portfolio formed on day 0, long the most-winner decile and short the most-loser decile from a ranking by day 0 returns. The sample includes KOSPI-200 stocks over the period [2004–2015]. Returns are computed using bid-ask mid-quote daily closing prices. The horizontal axis shows event time-windows in days, where 0 is the ranking day. As days within time-windows [2,5], [6,21] and [22,63] have homogenous characteristics, they are represented as one of the equal-sized event-time periods. The dashed line shows the cumulative returns of the (most-Bought minus most-Sold) BMS portfolio, long the most-net bought decile and short the most-net sold decile by domestic institutional investors on day 0 (derived from further below).
![Figure 1. The return pattern of portfolios sorted by daily returns and daily net institutional buying.Notes: The solid line shows cumulative raw returns of the Winner-minus-Loser (WML) portfolio formed on day 0, long the most-winner decile and short the most-loser decile from a ranking by day 0 returns. The sample includes KOSPI-200 stocks over the period [2004–2015]. Returns are computed using bid-ask mid-quote daily closing prices. The horizontal axis shows event time-windows in days, where 0 is the ranking day. As days within time-windows [2,5], [6,21] and [22,63] have homogenous characteristics, they are represented as one of the equal-sized event-time periods. The dashed line shows the cumulative returns of the (most-Bought minus most-Sold) BMS portfolio, long the most-net bought decile and short the most-net sold decile by domestic institutional investors on day 0 (derived from Table 7 further below).](/cms/asset/bb6aa174-fb8c-46ad-b0bc-a55173e2f70a/hbhf_a_1892678_f0001_b.jpg)
Both W and L portfolios exhibit an overshooting on day 1 and a reversal over the subsequent days, and stabilize thereafter (shown in ), as summarized by the WML portfolio in . The reversal from day 1 to day 5 represents a correction, as it cannot be explained by negative ε because law of large numbers ensures that E(ε) = 0 between day 1 and 5 for the WML portfolio.
Table 3. The risk-adjusted returns to the long and short legs of the WML portfolio.
In details presented below in the next subsection, we show that: (i) the measured reversals are robust to microstructure biases, (ii) they are not temporary (i.e., there is no resumption of day 0 returns following an initial reversal), (iii) they cannot be accounted for by standard risk factors and liquidity. Hence, momentum trading on day 1 cannot be attributed to risk preferences, and buying the WML portfolio on day 1 amounts to nonoptimal trading behavior, as it leads to regret by day 5.Footnote7 An investor in KRX who always buys the WML portfolio on day 1 is worse off (by 54% in annualized terms) compared to implementing the same momentum strategy after day 5. We interpret this as a price paid for immediacy due to fear of missing out.
The overshooting on day 1 followed by the reversal during days [2,5] makes it possible to identify overcrowding in its essential definition stated in the Introduction. For an investor type known to positively respond to return/information shocks, momentum trading on day 1, i.e., during the overshooting period, constitutes an overcrowded part of its response.
Who overcrowds by buying the WML portfolio on day 1? KRX daily investor trading data allows us to answer this question with high precision and conduct a detailed analysis of investor behavior associated with it. As the third section, Investor Trading in Response to Return Shocks and Institutional Overcrowding, will indicate, the answer is, not surprisingly given the concerns underlying Stein’s (Citation2009) theoretical work, (domestic) institutional investors.
As day 0 for the WML portfolio captures idiosyncratic return shocks, trading behavior on day 1 is connected to responding to idiosyncratic return shocks and/or accompanying information.Footnote8 This is different from shocks to institutional trading, typically executed over several days, leading to an ordinary price pressure story. The latter would not justify an overcrowding interpretation, as some portion of the trades would inevitably be executed at the peak point. To check against this alternative, we design a pure net trading event by sorting stocks every day by net domestic institutional buying and simulating a BMS (most-bought minus most-sold) portfolio which represents a net trading shock instead of a return shock. The dashed line in shows that the BMS portfolio does not exhibit a reversal, pointing to a clear difference between return shocks and net trading shocks (see , from which the dashed line is derived, and compare to , from which the solid line is derived). Institutional trading leads to a reversal only when it chases return shocks. Apparently, the return shock induces aversion to miss out and demand for immediacy, paralyzing assessments of potential overshooting. In sum, conditioning on return shocks is an essential element, ruling out a simple price pressure story and justifying an interpretation of our setup as capturing an overcrowded response.
Table 7. Evolution of overcrowding over time.
Details of the short-horizon overshooting and reversal pattern
Having presented the main idea in the previous section, we now provide details: Our setting is based on a specific return-ranking strategy with a 1-day ranking period.Footnote9 The WML portfolio is constructed by taking a long position in the top 10% winners and shorting the bottom 10% losers. Results are similar when other nearby cutoffs such as 5% or 20% are used. Winner and loser portfolios are equal-weighted so that our results represent an average of each stock’s information event.
As the overcrowding concept essentially involves institutional investors, our focus is on market segments which can be characterized as institutional investor habitat. The statistics in indicated that in KRX institutional investor presence is substantive in KOSPI-200 index constituent segment and minimal in non-index constituent (i.e., small-cap) stocks. On the other hand, data compiled and presented by Bennett, Sias, and Starks (Citation2003) and Blume and Keim (Citation2017) indicate that in the US institutional investors are dominant in all segments of the stock market during our sample period.Footnote10 Thus, (after reporting results for both segments of KRX) we focus on KOSPI-200 stocks, and for the US we include all stocks in the CRSP database. (Consistent with the expected role of institutional investor presence, results for the large-cap and small-cap segments of the US market do not differ.)
Our KRX investor trading data cover the January 2004–June 2015 period. By replicating the same tests on the US stock market over the same period, we establish the relevance of the pattern under consideration and satisfy a primary condition of our study’s external validity. The US sample comprises 5015 stocks from NYSE-AMEX and 4446 from NASDAQ, that meet data quality requirements (infrequently traded stocks and stocks priced below $1 are excluded). We use returns calculated from closing bid-ask midpoints at the close, to eliminate biases due to the bid-ask bounce. We replicate the analysis both over the 1992–2015 period (bid-ask prices are available from 1992 in the CRSP database) and the corresponding 2004–2015 subperiod.
Raw returns to the WML portfolio are reported in for KRX (Panel A) and the US stock market (Panel B). The designated time-windows over which contain days with homogenous return behavior. Besides days 0, +1, [+2, +5], which correspond to event times in Stein’s (Citation2009) model as specified above, we also check the preceding time window [−5, −1] as well as longer-horizon returns over windows [+6, +21] and [+22, +63].
The results for KRX are in Panel A. Column “day 0” shows a winner-loser return differential of 8.5% on the ranking day for KOSPI-200 stocks. Column “day 1” indicates that the WML portfolio continues its drift, evident by its significant positive mean returns. (For the WML portfolio, an approximate null is “zero return”). From day 2 to 5, the WML portfolio yields significant negative returns, implying a reversal. This forms a pattern of significant reversal following the overshooting on day 1.
The size of reversals relative to the volatility of daily returns and the transaction costs is comparable to those reported in the literature on short-term reversals (over the recent decades, the size of short-term reversals has diminished along with the moderation in return volatility and the sharp decline in transaction costs). The size of reversals is larger for the KOSPI-200 stocks than for small-cap stocks, which suggests that the reversals are not simply an artifact of microstructure biases or illiquidity. Over our sample period, the average bid-ask spread is 0.39% for the KOSPI-200 stocks and 0.86% for the Non-KOSPI-200 stocks; thus, the size of the reversal reliably exceeds the bid-ask spread in the KOSPI-200 segment but not for small-cap stocks, despite higher volatility of the latter.Footnote11 This can be interpreted as a preliminary signal that something in the institutional investor habitat contributes to reversals.
The economic implication of the reversal can be better understood based on the regret an investor, who always pursues momentum trading on day 1, experiences: such an investor is worse off compared to buying winners and selling losers at the close of day 5 (thus, experiences regret at the end of day 5) by 54% in annualized terms in the KOSPI-200 segment.Footnote12 With the corresponding estimate at 17% for the US, this outcome is contrary to Stein’s (Citation2009) model result which predicts a balance of under- and over-reactions.
Columns [6,21] and [22,63] show that there is no subsequent resumption of event-day returns. This prevents dismissing the overshooting along the lines of Cox and Peterson (Citation1994) and Gutierrez and Kelley (Citation2008) who show that the temporary reversal is followed by further continuation over longer horizons. Hence, day 5 in our empirical setting can be assumed to correspond to the terminal period (time 2) in Stein’s (Citation2009) model. (We have also checked more distant time-windows and found no significant WML differential).
The last column points to an interesting aspect: the WML portfolio has negative returns on average during the preceding five-day period. That is, it moves in the wrong direction ahead of the idiosyncratic return shock.
The pattern in the US is similar to KRX: The reversal in the [2,5] time-window is significant, and it starts after the continuation on day 1, as in KRX. There is no evidence of a resumption of day 0 returns subsequently. During the [−5, −1] time-window, the WML portfolio moves in the opposite direction to its day 0 returns, as is the case in KRX. During the more recent 2004–2015 period that corresponds to our KRX dataset, the same pattern continued to prevail, albeit in smaller magnitudes.
The significant reversals documented above are free of the bid-ask bounce, as we use bid-ask mid-quote returns. Below, we show that controlling for a liquidity factor does not affect their significance. The reversals are also robust to further microstructure arguments.Footnote13 Next, we examine whether these reversals can be accounted for by common measures of risk and liquidity.
presents risk-adjusted returns of the winner and loser legs as well as the WML portfolio. It offers a basis to interpret whether the trading behavior in the W and L portfolios can be accounted for by investor preferences toward common (e.g., Fama-French) risk factors and liquidity. Reported are the intercepts (αp) from the time-series regression:
(1)
(1)
where Rm, SMB, HML and L are the daily returns of standard Fama-French factors and a liquidity factor, respectively. EquationEquation 1
(1)
(1) is estimated for each time-window separately, which means that predictable changes in risk characteristics of the W and L portfolios across our time-windows are taken into account.Footnote14
Results indicate that in both KRX and the US the reversals during [2,5] in risk-adjusted terms are significant for both winners and losers. Thus, net buying winners and net selling losers on day 1 both result in regret, which cannot be considered as a premium paid for risk and liquidity preferences. The α estimates for the WML portfolio (bottom rows of both panels) are similar to the mean raw returns reported in , which reflects small loadings of the WML portfolio on the risk factors and verifies the conclusions taken from .
Operationalization of model parameters in our empirical setting
Our proxy for F is the return from the close of day 1 to the close of day 5, after which the cumulative returns of the WML portfolio stabilize. (Day 63, day 21 and day 5 closing levels only trivially differ from each other, hence, using any of these alternatives does not change the results). δ parameters in real life are difficult to observe; we infer them from the weighted-average buying and selling prices of each investor type on day 0. An important advantage of our setting is the granularity provided by day 0 and day 1: investors can condition their trading decisions on day 1 on day 0 closing prices. Thus, our empirical setting divides time 1 in Stein’s model (when momentum traders join instantaneously after observing newswatcher action) into two days, day 0 and day 1. Thus, assuming momentum traders act on day 1 after observing day 0 closing prices, we can estimate φ and β parameters by regressing day 1 net trading on day 0 returns. (More details in the Supporting Information).
Our empirical operationalization of institutional overcrowding is based on whether excess institutional chasing following the return shock is associated with overshooting versus arbitraging away the remaining under-reaction. Since day 1 returns in our setting are more than completely reversed by day 5, excess institutional momentum trading on day 1 manifests overcrowding.
Our definition of nonoptimal trading (stated in footnote 8) yields a novel measure of crowding based on the nonoptimal portion of trading in response to return shocks: an investor type’s ratio of net momentum trading in the WML portfolio on day 1 to that prior to day 1.Footnote15 This measure identifies overcrowding on the day it occurs, regardless of whether it later leads to inferior strategy performance or not. This measure can be formulated for any pattern with an unambiguously identified overshooting point.
Investort rading in response to return shocks and institutional overcrowding
This section documents institutional overcrowding using the empirical setup presented in the sections: An Empirical Setup that Replicates the Scenario in Stein’s (Citation2009) Model on a Daily Basis and Details of the Short-horizon Overshooting and Reversal Pattern, and the investor trading data introduced in the section, Investor Trading Data.
We start by presenting a complete portrait of investor types’ trading during the overshooting-and-reversal pattern in . The variable of interest in this broad description is investor types’ net trading in the winner, loser and WML portfolios, denoted as (the net trading of investor type m during time-window d in portfolio p formed on day t). For each investor type m and time-window d we test the null H0:
(bar refers to time-series mean).Footnote16 A positive net flow in the WML portfolio signifies momentum trading (i.e., buying winners and selling losers). Given the overshooting on day 1 and the subsequent reversal, our focus is on day 1 trading. The overcrowding hypothesis implies HA:
Table 4. Net trading by investor types during the overshooting-and-reversals following idiosyncratic return shocks.
Day 0 column shows investor types’ trading on the day return shocks occur and/or accompanying information arrives. Trading over the [−5,−1] window reveals potential information advantages of investor types that might help them forecasting returns shocks. Day 1 and window [2,5] reveal whether investor type still responds to such information after it becomes notable and already-attended. Given the reversal pattern documented in the previous section, sign change from momentum on day 0 to contrarian on day 1 would be considered a sophisticated strategy.
reports the mean net trading flows, by three main investor types (m ≡ individual, domestic institutional, foreign) in portfolios p ≡ W, L, WML over the time-windows d ≡ [-5,-1], 0, 1, [2,5]. Several checks confirm the robustness of the estimates reported: First, we winsorize net flows at ±0.001 (as the high kurtosis statistics for daily net trading reported in the Supporting Information warrant) and repeat the same estimations. The outliers causing excess kurtosis may be due to large-sized block transactions with motivations orthogonal to regular trading and might distort the results. This exercise, reported in Panel B, yields qualitatively identical results, generally with sharper significance levels. Second, we divide our sample period into three subperiods and obtain qualitatively identical results in each subperiod (shown in the Supporting Information); thus our findings regarding the investor types’ trading behavior has remained fairly stable over time. Furthermore, results remain robust to inclusion or exclusion of the 2008-crisis and non-crisis subperiods. Finally, investor types’ trading pattern remains unchanged after controlling for standard risk factors and liquidity, i.e., looking at the intercepts from the time-series regression:
= αp + β1RM,t + β2SMBt + β3HMLt + β4Lt + εp,t (in the Supporting Information).
Day 0 results reiterate general contrarian versus momentum tendencies of individual and institutional investors, respectively: during return shocks individual investors sell winners and buy losers, whereas domestic and foreign institutions buy winners and sell losers. Strong significance levels reflect pervasive and consistent investor behavior and offer solid support for the behavioral assumptions of our model.Footnote17
Which investor type’s trading is associated with the overshooting on day 1? This question is answered by the “day 1” column, where a positive net flow in the WML portfolio implies buying winners and selling losers on the overshooting day. Individual investors are net sellers of winners and net buyers of losers. Domestic institutions are net buyers of winners and net sellers of losers. Foreign investors are net sellers of losers; their net trading of winners is insignificant. The main overshooters are domestic institutions.
Dividing time 1 in Stein’s (Citation2009) model, day 1 in our empirical setting offers extra granularity that helps identify those who trade after observing P1 or R1. While the broad investor type “domestic institutions” contains a mixture of newswatchers and technical arbitrageurs, institutions who join the move on day 0 are relatively more representative of newswatchers, and those who join on day 1 are relatively more representative of technical traders. (Note that our focus is on aggregate trading behavior, not on identifying specific traders’ motivations). Momentum trading on day 1 is associated with overshooting and nonoptimal: those who join on day 1 suffer, on average, statistically significant regret by day 5 at both winner and loser legs, which is not recovered subsequently and (as indicated) cannot be accounted for by preferences. Hence, they represent the overcrowded portion of institutional trading in response to return shocks and/or accompanying information.
Our measure of overcrowding in this setting is i.e., an investor type’s net purchases of the WML portfolio on day 1 expressed as a proportion of that accumulated from day 5 to (including) day 0, conditional on both being positive. Note that Q is a lower boundary estimate of the size of overcrowding, since part of the net purchases of the WML portfolio on days 0 and 2–4 may also be nonoptimal. Domestic institutions’ net trading in the WML portfolio on day 1 amounts to 36.5% of that prior to day 1. Thus, an economically large proportion of domestic institutions’ response to return shocks represents nonoptimal overcrowding. The Q ratio for foreign investors is only 8.7%.
Foreign investors’ role in overshooting is confined to only borderline-significant selling of losers; hence, their behavior has a different nature from domestic institutions. The difference from domestic institutions’ behavior is most significant in the winner leg where momentum trading is more discretionary, and participation only requires cash. This hints at the likelihood that domestic institutions’ nonoptimal overcrowding may be a consequence of stronger aversion to miss out in their home markets.
Time-window [2,5] indicates that investor types’ trading during the subsequent four days’ correction is in the same direction as on the ranking and overshooting days. Domestic and foreign institutions do not help the correction from overshooting. It is important to notice that the stock price reverses despite their continued momentum trading. Hence, simple price impact cannot explain the pattern. On day 1, return shock and institutional price impact seem to reinforce each other. Domestic institutions’ nonoptimal trading on day 1 appears to be part of an enduring rebalancing in response to the return shock on day 0 and/or accompanying information. The nonoptimal aspect follows from the fact that they implement a disproportionately large part of this rebalancing at the overshooting point, possibly due to the perceived immediacy driven by aversion to miss out.
Investor types’ daily average trading prices contain information relevant for our model parameters. reports weighted-average buying and selling prices (ABP and ASP, respectively) of investor types on day 0. We create an index of trading prices where the weighted-average trading price (AP) of each stock on each day is set to 1. The ABP and ASP of investor types in winner and loser portfolio stocks are then computed as a proportion of this index.
Table 5. Investor types’ average trading prices of on day 0.
Individual investors trade in favorable terms; this is probably an outcome of not joining large price moves but continuing contrarian trading. Such behavior results, in the case of winner stocks, in a low ABP and an ASP close to AP; and, leads to a high ASP and an ABP close to AP in the case of loser stocks. Since a large proportion of day 0 price movements remain permanent, such behavior represents under-reaction, and can be interpreted as counteracting the process of incorporation of new information, consistent with Quian's (Citation2014) findings.
The opposite is true for domestic institutions. Their ABP of winners is substantially higher than AP and their ASP of losers is substantially lower than AP. This can be the outcome of joining extreme price movements and not taking contrarian action. When an investor type is the sole agent trading this way, it can be regarded as driving the return shock. Hence, domestic institutions appear to drive the winner–loser movements.
Foreign investors trade at favorable prices (i.e., buy lower than they sell), despite the fact that they are momentum traders. Therefore, one can conclude that it must be that foreign investors are typically early movers during extreme price changes. Similar to individuals but unlike domestic institutions, they do not chase extreme daily returns.Footnote18
The bottom row provides the closing price of winners and losers, normalized in terms of the index where AP is set equal to 1. It shows that, although domestic institutions buy winners high and sell losers low, at the close of day 0 they are substantially better-off. Individual investors’ contrarian trading, although at more favorable prices, make them end the day with regret. Individual investors’ attempt to buy low and sell high results in an under-reaction in the case of extreme stock price moves; they are picked off as a result of their inability to predict the size of return shocks.
An estimation of model parameters along with a calibration of overshootings and reversals is illustrated in the Supporting Information.
The dynamics of institutional crowding and implications
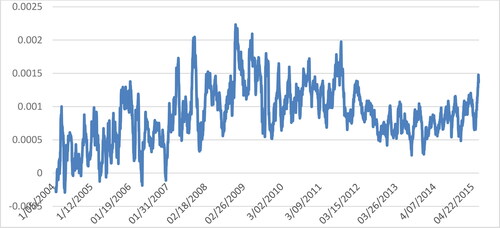
In this subsection, we investigate the nature of institutional overcrowding documented above. For a starter, a time-series evolution of the size of institutional crowding throughout our sample period is plotted in . It indicates that the average size of overcrowding climbed during the second half 2000s, reaching a peak around 2009 and 2011, then moderating and stabilizing fairly above the zero-line. The zero-line refers to an ideal case where the aggregate institutional investor avoids momentum trading at the overshooting point. This could be the case, for example, if some institutions accurately estimated F and took contrarian action to exploit the overshooting, thus offsetting less-informed institutions’ momentum trading driven by aversion to miss out. However, this turns out not to be the case; the aggregate institution exhibits overcrowding in a persistent manner.
Figure 2. Historical evolution of institutional crowding.
Notes: The time-series in the figure plots a 21-day moving average of domestic institutions’ net trading in the WML portfolio on day 1. The 0-line represents the hypothetical ideal case where institutional investors avoid momentum trading at the overshooting point, i.e., day 1.
Of particular interest is whether the observed trading behavior is more consistent with the differential features of our model versus Stein’s (Citation2009) original version. Testable hypotheses in this respect involve whether the size of overcrowding evolves with the aggregate size of institutional investors, with the past performance of momentum trading on day 1; whether it can be predicted from δInd, from day 0 returns of the WML portfolio and from the size of aggregate institution’s day 0 response; and, whether it predicts future returns of the WML portfolio. Results of this investigation are summarized below.
Stein’s (Citation2009) model does not yield an unambiguous prediction regarding the relation between the size of day 0 return and the size of overcrowding on day 1, since a high return can reflect a high realization of F or a low realization of F combined with a high level of momentum/arbitrage activity. A unique feature of KRX (investor trading data published everyday), however, offers a key testable implication: as institutional investors can observe trading activity of day 0 before deciding their day 1 trading, they can condition on the size of past arbitrage activity as well as returns. Thus, in a multivariate regression of day 1 institutional momentum trading on day 0 returns and day 0 net momentum trading of institutional investors, Stein’s (Citation2009) model predicts a positive coefficient for the former and a negative one for the latter. Our model, on the other hand, predicts positive coefficients for both, and particularly for the latter, because day 0 net institutional trading serves as a proxy for the strength of peer effects (e.g., institutional investors may have less tolerance to miss out those return shocks that most other institutions attend to). Hence, this regression could distinguish between the alternative motivations behind institutional overcrowding: arbitrage via a technical strategy versus peer effects. (A univariate regression on RWML,d0 cannot distinguish, since day 0 returns are also a proxy for F, to which both models predict net institutional momentum trading to be positively related).
Results of this regression are presented in the left block of Panel A of . The size of domestic institutions’ momentum trading on day 1 is positively related to their net trading on day 0 and only weakly to the return of the WML portfolio on day 0. This suggests a larger role of peer effects than technical strategies as the motivation behind overcrowding and rejects the way the role of the aggregate size of arbitrage activity is considered in Stein’s (Citation2009) model. In the first row, the univariate regression indicates a significant positive relation between domestic institutions’ momentum trading on day 1 and the size of the day 0 return of the WML portfolio. Without further conditioning, this relation may reflect the information content of day 0 return, common in Stein’s model and ours, and does not distinguish between the two models. Once we control for day 0 institutional trading in the second row, return largely loses its significance while institutional trading remains significant with a positive sign, suggesting that peer effects are more important than the return signal itself in driving institutional momentum-trading on day 1. To further isolate peer effects from the information content of day 0 return, we add in the third row an estimate of the component of F which is not captured by day 0 and day 1 returns: the return of the WML portfolio in the [2,63] window. If institutions’ momentum-trading on day 1 is driven by a sophisticated interpretation of day 0 return shock, this variable should enter with a positive sign. If, rather, it is driven by peer effects or technical strategies, it should enter insignificantly. This variable turns out insignificant, with a negative sign, suggesting that the size of institutional momentum trading does not reflect a sophisticated interpretation of the information accompanying the return shock. Peer effects remain the stronger alternative.
Table 6. The nature of institutional overcrowding.
In Stein’s (Citation2009) model, institutional momentum trading is a response to under-reaction, which in our context implies a positive relation between δInd or a past average of it and net institutional momentum trading in the WML portfolio on day 1. The right block of Panel A tests this implication of Stein’s model. δInd turns out insignificant whether alone or in the presence of other drivers. This does not support the hypothesis that institutional investor’s momentum trading on day 1 is a response to individual investors’ under-reaction on day 0. In the third row, we test an alternative version to see whether institutions respond to a trailing average of past δInd. It also turns out insignificant, suggesting that institutional momentum trading is not a learned response to the recent level of individual investor under-reaction.
Next, we examine whether the size of institutional crowd on day 1 has any relation to future returns of the strategy (i.e., of the WML portfolio). For this purpose, we regress WML portfolio returns over various future horizons on the size of institutional momentum trading on day 1, controlling for day 0 returns and day 0 institutional trading. (Day 0 returns enter with a significant negative sign, however, controlling for day 0 returns or not does not affect the results). In the first row of Panel B, we have short-horizon returns as the dependent variable, and in the second row, longer-horizon returns. The latter will indicate whether existing empirical approaches in the literature which seek to identify overcrowding based on an alleged negative relation between the size of momentum activity and future returns to the strategy are warranted. Against the idea underlying these approaches, institutional investors’ fundamental analysis of the information accompanying the return shock might be offsetting the negative effect of overcrowding.
The first row indicates that the size of institutional momentum trading on day 1 is positively related (borderline significant) to short-horizon future returns, i.e., predicts somewhat smaller short-horizon reversals, possibly reflecting the price impact of persisting peer effects. Indeed, domestic institutions’ momentum trading during [2,5] is significantly positively related to the size of their momentum trading on day 1 (Newey–West t = 12.03, not in the table). Hence, institutional momentum trading affects strategy returns during the period in which it persists and has no bearings on longer-horizon future returns. The second row indicates that the size of institutional momentum trading on day 1 does not have a significant linear relation to longer-horizon future returns,
(albeit it enters with a negative sign). A natural interpretation is that the negative effect of overcrowding is partly offset by some information content of institutional follow-through. Such offset probably nullifies the efficacy of approaches that seek to identify overcrowding from future returns.
The analysis in addresses only linear relations. One possibility is the relation between overcrowded trading and returns is nonlinear with extreme observations having different effects. examines potential nonlinear relations. Panel A exemplifies a nonlinear relation between day 0 returns and post-event returns during the [6,63] window: very high or very low [6,63]-returns follow relatively higher day 0 returns in both KRX and the US stock market, forming a U- or V-shaped pattern. However, net institutional trading on day 0 or day 1 do not display a notable nonlinear pattern conditional on [6,63] return outcome. Confirming the earlier conclusion from linear regressions, the relationship between the size of crowding and long-horizon future returns is essentially flat. Panel B examines the relation between the size of crowding on day 1 and the magnitude of the short-horizon reversal, conditional on day 0 returns. High day 0 returns of the WML portfolio are followed by larger reversals in both KRX and the US stock market. Net institutional momentum trading on day 1 is small following smaller day 0 returns, monotonically increases up to medium-sized day 0 returns but do not increase further following large ones (slightly decrease following very large day 0 returns). That is, momentum participation does not increase further upon very large returns, resulting in a nonlinear relationship. This nonlinear pattern shows that, although institutional momentum trading is on the wrong side ahead of short-horizon reversal, its intensity does not drive the size of the reversal.
Figure 3. Non-linear linkages between the size of overcrowding and returns.
Notes: Panel A: Outcomes conditioned on [6,63] returns. Daily event observations are sorted by [6,63] window returns of the WML portfolio, with intervals ordered from smaller to larger on the horizontal axis. The solid line depicts average day 0 returns (left vertical scale) for cases that belong to each of the [6,63] return intervals. For KRX, the dark (bright) yellow bars depict day 0 (day 1) mean net trading of domestic institutions for each of the [6,63] return intervals (right vertical scale). Panel B: Outcomes conditioned on day 0 returns. Event observations are sorted by day 0 returns of the WML portfolio. On the horizontal axis are day 0 return intervals, ordered from smaller to larger. The solid lines depict average [2,5]-window returns following each of the day 0 return intervals (left vertical scale). For KRX, the bars depict day 1 average net trading of domestic institutions for each of the day 0 return intervals (right vertical scale). This figure presents a comparison of return and institutional trading results for KRX (on the left) to return-only results for the US (on the right).
![Figure 3. Non-linear linkages between the size of overcrowding and returns.Notes: Panel A: Outcomes conditioned on [6,63] returns. Daily event observations are sorted by [6,63] window returns of the WML portfolio, with intervals ordered from smaller to larger on the horizontal axis. The solid line depicts average day 0 returns (left vertical scale) for cases that belong to each of the [6,63] return intervals. For KRX, the dark (bright) yellow bars depict day 0 (day 1) mean net trading of domestic institutions for each of the [6,63] return intervals (right vertical scale). Panel B: Outcomes conditioned on day 0 returns. Event observations are sorted by day 0 returns of the WML portfolio. On the horizontal axis are day 0 return intervals, ordered from smaller to larger. The solid lines depict average [2,5]-window returns following each of the day 0 return intervals (left vertical scale). For KRX, the bars depict day 1 average net trading of domestic institutions for each of the day 0 return intervals (right vertical scale). This figure presents a comparison of return and institutional trading results for KRX (on the left) to return-only results for the US (on the right).](/cms/asset/70329de0-f08d-4ec0-8381-51258afdda05/hbhf_a_1892678_f0003_c.jpg)
Event observations are sorted by day 0 returns of the WML portfolio. On the horizontal axis are day 0 return intervals, ordered from smaller to larger. The solid lines depict average [2,5]-window returns following each of the day 0 return intervals (left vertical scale). For KRX, the bars depict day 1 average net trading of domestic institutions for each of the day 0 return intervals (right vertical scale). This figure presents a comparison of return and institutional trading results for KRX (on the left) to return-only results for the US (on the right).
Finally, we examine the evolution of institutional crowding over time in relation to the recent performance of day 1 momentum trading and the size of domestic institutions in KRX, a proxy for the aggregate capacity of the arbitrage sector, N, in Stein’s (Citation2009) model. For this purpose, we regress net momentum trading by institutions on day 1 on the 21-day trailing averages of WML portfolio return during the [2,5] and [6,63] windows and the 21-day trailing average share of domestic institutions in KRX aggregate traded value, controlling for the day 0 return of the WML portfolio. Results in indicate that the size of overcrowding does not adapt to the past performance of the strategy, neither alone not controlling for other regressors. Hence, there is no evidence of dynamic learning or trading strategy adaptation based on past performance. In other words, recent performance of “buying WML on day 1” has no significant effect on the current size of strategy implementation. The share of domestic institutions in aggregate traded value, however, is a significant predictor of institutional net momentum trading in the WML portfolio, even after controlling for day 0 returns: the size of instituional net momentum trading in winner and loser stocks increases with the lagged aggregate size of institutional investors in the stock market (further, controlling for a time-trend does not alter its significance). This is consistent with the crowding interpretation in this paper.
The information content of domestic institutions’ trading in general
To put into context the above findings, it is useful to understand the information content of investor types’ trading in general. For this purpose, we look at: (i) investor types’ trading ahead of return shocks in our setting, (ii) the return pattern of stocks ranked by each investor types’ net trading.
Investor types’ ability to forecast future winners and losers?
Investor types’ net trading during the [−5, −1] window is reported above in the last column of , where a positive figure for the WML portfolio implies success in predicting idiosyncratic return shocks. Domestic institutional investors have the most success in predicting future winners and losers, especially in forecasting winners. Individual investors’ net flows during the [−5, −1] window are insignificant. Foreign investors sell winners and buy losers before day 0, i.e., they are on the wrong side, consistent with the well-known local information disadvantages of foreign investors.
Sorting by investor types’ net trading
Each day, we rank stocks by each investor types’ net buying and form portfolios long the most-bought decile and short the most-sold decile by each investor type. This is equivalent to simulating a net flow shock.Footnote19 The return patterns of most-bought minus most-sold (BMS) portfolios by each investor type, presented in , suggest that domestic institutions’ trading has the most information content among the three investor types. Thus, both analyses in this subsection indicate that domestic institutions, who are associated with nonoptimal overcrowding, are at the same the most-informed investor type in general.
Table 8. The performance of portfolios sorted by the net trading by investor types.
Subcategories of institutional investors
Institutional investors differ in terms of their specialization and mandate. Therefore, an analysis of the trading by institutional investor subcategories can provide clues regarding the source of their association with the overshooting. Some institutional subcategories (regarded as smart money) more closely resemble the arbitrageurs in Stein’s (Citation2009) model, while others are more vulnerable to peer effects. The comprehensive breakdown of domestic institutional investor subcategories in our dataset enables such investigation. reports the mean net trading of the subcategories of domestic institutions in the winner–loser portfolios over specified time-windows.
Table 9. Net trading flows of subcategories of domestic institutions in winner and loser portfolios.
On day 0 and 1, most subcategories of institutions are net buyers of winners and net sellers of losers. With a significant positive net trading in the WML portfolio on day 1, overshooting is particularly significant for insurance companies, investment trusts (i.e., asset management firms), pension funds and private (hedge) funds, i.e., those types of institutions where the relative performance of the fund manager is closely monitored. Institutions with a more proprietary nature, banks and others, differ in that they do not chase winners. They differ in that they are not subject to competitive performance monitoring (usually trade their holdings of affiliated company shares). This appears to translate into a trading behavior difference.
A natural interpretation is that closer performance monitoring increases an institutional investor type’s motivation to chase new information, and overshooting inherently accompanies such chasing. This is an expected consequence of peer effects, and is seen among those institutional investor subcategories which are expected to be vulnerable to peer effects.
Over days 2 to 5, the sign of net flows remains in many cases similar to those on day 0 and 1, while the significance levels diminish. For investment trusts and asset management firms, momentum trading remains significant. Several types of institutions exhibit notable shifts: securities firms shift to buying losers, consistent with exploiting the mispricing following the price pressure of selling (KOSPI-200 losers exhibit a large rebound in raw-return terms). Banks and others become net sellers of winners. Thus, institutions with a more proprietary character are more likely to shift to contrarian trading, in line with both our and Dasgupta, Prat, and Verardo's (2011b) argument. Especially in the winner leg, where momentum trading is more discretionary and participation only requires cash, nonoptimal return chasing is likely to be a consequence of peer effects.
The conclusion from this section can be summarized as follows: Those types of institutions, where the relative performance of the fund manager is closely monitored, happen to be the most associated with momentum and overshooting, consistent with a link between return chasing and peer effects.
Our setting has a bearing on the hypothesis of amplification mechanism where client flows toward investment funds, triggered by the past performance of the fund, exhibit inertia and add to momentum and eventual reversal in stock prices. Such mechanism forms the basis of Vayanos and Woolley’s (2013) institutional theory of momentum and reversal, for which Lou (Citation2012) provides empirical evidence using quarterly and monthly data. For investor flows toward investment funds to be triggered by past performance and to affect subsequent fund trading, the 1-day time horizon in our case is mostly insufficient. (Given the strong contrarian tendency of individual investors, it may also be unlikely). Hence, domestic institutions’ nonoptimal trading of winners and losers in our case is probably driven by fund managers’ decisions rather than by client flows.
Conclusions
We have taken a new perspective to address the origin of the institutional overcrowding concept, identifying it as it occurs when investors respond to return shocks, rather than by the subsequent performance of a momentum strategy. The flat relationship between the size of crowding and future returns to a chasing strategy justifies this approach.
Domestic institutions’ response to return/information shocks is over and above of what is needed for stock prices to reach their equilibrium levels. At the same time, they are the most informed investor type. The key is the aggregate institutional investor's failure, in the absence of a fundamental anchor, to recognize the (predictable) point beyond which responding to a return/information shock is unprofitable. The nonoptimal part of their chasing constitutes an economically substantial proportion of total institutional rebalancing in response to return shocks and/or accompanying information, and is unlikely to be driven by client flows. By chasing stock moves at the overshooting point, institutions incur a cost of immediacy to satisfy a motive of not missing out.
Our model, built on Stein’s (Citation2009) framework, provides a succinct, yet comprehensive, account of stock markets where individual and institutional investors comprise comparable shares in aggregate traded value. Its distinction is to predict overcrowding due aversion to miss out. The dynamic behavior of the size of institutional crowding is consistent with this differential feature of our model regarding the behavioral motivation behind overcrowding.
Our findings could sensitize portfolio managers regarding a nonoptimal aspect of their trading in response to return shocks, specifically to avoid joining at the overshooting point where no more crowding is needed.
Table
Supplemental Material
Download MS Word (69.4 KB)Notes
1 They use either low-frequency 13F data or incomplete proxies such as short interest (or securities lending) in short-leg stocks or indirect proxies such as the degree of comovement among stocks in strategy portfolios.
2 Among the few stock markets in the world, which provide exact and complete investor trading data, KRX is the most developed and the most similar to the US stock market in terms of stock return behaviour (documentation of similarities is available from the authors). Thus, findings on KRX are likely to have external validity for the US stock market.
3 The term “aversion to miss out” symmetrically applies to avoiding being caught by loser stocks as it does to catching winner stocks.
4 Dasgupta, Prat, and Verardo (Citation2011a) find that persistent institutional trading negatively predicts long-horizon returns. Edelen et al. (Citation2016) report that US institutions take on positions on the wrong side during the formation of the value-type anomalies.
5 They can also be seen in Onishchenko and Ülkü (Citation2021), Table 1, which uses the same empirical setup to document an anatomy of all investor types’ behavior around the short-term reversal pattern.
6 This description is particularly relevant for order-driven electronic stock markets without dealers where individual and institutional investors comprise comparable shares in trading volume, such as Asian stock markets.
7 Our definition of nonoptimal is “predictably unprofitable after controlling for standard risk factors.” It may or may not encompass irrational behavior. Buying the WML portfolio on day 1 is nonoptimal because, by waiting for a few days, an investor could have served the same motivation without incurring a regret. Note also that the term “unprofitable” in our definition does not require a losing round-trip trade; rather, it implies trading at a price that leads to predictable regret later. (Regret refers to the opportunity cost that emerges after information on best course of action arrives).
8 Also, idiosyncratic return differentials usually do not induce systematic hedging demand or expose institutional investors to systematic client flows.
9 Other similar specifications such as weekly ranking and holding periods yield similar reversals. We employ this version as it provides additional granularity to identify an overshooting day.
10 Based on 13F filings, Blume and Keim (Citation2017) report that institutional investors own 60% of large-cap stocks and 68.2% of micro-cap stocks as of 2010 (see their ).
11 Assuming 0.05% trading commission per side, a strategy of shorting the WML portfolio at the end of day 1 and closing the position at the end of day 5 yields a small arbitrage profit of approximately 0.20% per trade (or 13.3% annualized) after transaction costs on KOSPI-200 stocks. Mean profit is statistically significant at the 1% level.
12 54% for KRX -computed from daily closing prices- is an understatement: domestic institutions’ average buying price of winners (selling price of losers) is 29 bp above (16 bp below) day 1’s closing price. Hence, the regret measured from their weighted-average trading prices on day 1 amounts to 1.14% per 4 days, or 103.7% annualized.
13 For example, controlling for day 0 market returns, as a remedy against Lo and MacKinlay’s (1990) argument of lead-lag relations, does not affect the significance of reversals (available upon request).
14 Full estimations including factor exposures are presented in the Supporting Information.
15 For other attempts to measure crowding, see Cahan and Luo (Citation2013), Hong et al. (Citation2015), Zhong, Ding, and Tay (Citation2017) and Barroso, Edelen, and Karehnke (Citation2017). Our measure differs in that it identifies overcrowded trading as it occurs, not by its outcomes much later.
16 More precisely, the null is “ = unconditional mean daily net flow of investor type m”. However, the latter only negligibly differs from zero, and in no case alters the result. Hence, zero is a convenient approximate null.
17 Employing well-diversified portfolios and long sample periods achieves noise dampening in both cross-sectional and time-series dimensions. Using daily marketwide trading flows data from Taiwan, Thailand and Finland, we obtain similar results (available from the authors), indicating that our model’s behavioral assumptions reflect pervasive facts.
18 See Onishchenko and Ülkü (Citation2019) for an analysis of foreign investors’ trading prices and behavior.
19 There is some overlap between return shocks and flow shocks; a switch between return-sorting and net flow-sorting would correspond to alternative Cholesky orderings in a vector autoregression model.
References
- Barroso, P., R. Edelen, and P. Karehnke. 2017. “Crowding and Moments of Momentum.” Working paper (available in SSRN).
- Barrot, J., R. Kaniel, and D. Sraer. 2016. “Are Retail Traders Compensated for Providing Liquidity?” Journal of Financial Economics 120 (1):146–68. doi:10.1016/j.jfineco.2016.01.005
- Batista, J., D. Massaro, J. Bouchaud, D. Challet, and C. Hommes. 2017. “Do Investors Trade Too Much? A Laboratory Experiment.” Journal of Economic Behavior & Organization 140:18–34. doi:10.1016/j.jebo.2017.05.013
- Baucells, M., M. Weber, and F. Welfens. 2011. “Reference-Point Formation and Updating.” Management Science 57 (3):506–19. doi:10.1287/mnsc.1100.1286
- Bennett, J., R. Sias, and L. Starks. 2003. “Greener Pastures and the Impact of Dynamic Institutional Preferences.” Review of Financial Studies 16 (4):1203–38. doi:10.1093/rfs/hhg040
- Bickhchandani, S., and S. Sharma. 2000. “Herd Behavior in Financial Markets.” IMF Staff Papers 47 (3):279–310.
- Bloomfield, R., M. O’Hara, and G. Saar. 2009. “How Noise Trading Affects Markets: An Experimental Analysis.” Review of Financial Studies 22 (6):2275–302. doi:10.1093/rfs/hhn102
- Blume, M., and D. Keim. 2017. “The Changing Nature of Institutional Stock Investing.” Critical Finance Review 6 (1):1–41. doi:10.1561/104.00000033
- Cahan, R., and Y. Luo. 2013. “Standing out from the Crowd: Measuring Crowding in Quantitative Strategies.” The Journal of Portfolio Management 39 (4):14–23. doi:10.3905/jpm.2013.39.4.014
- Campbell, John Y., Tarun Ramadorai, and Allie Schwartz. 2009. “Caught on Tape: Institutional Trading, Stock Returns, and Earnings Announcements.” Journal of Financial Economics 92 (1):66–91. doi:10.1016/j.jfineco.2008.03.006
- Chen, Q. 2018. “Arbitrage Crowdedness and Portfolio Momentum.” Working paper, Shanghai Jiaotong University (available in SSRN).
- Cohen, R., P. Gompers, and T. Vuolteenaho. 2002. “Who Underreacts to Cash-Flow News? Evidence from Trading between Individuals and Institutions.” Journal of Financial Economics 66 (2–3):409–62. doi:10.1016/S0304-405X(02)00229-5
- Cox, D., and D. Peterson. 1994. “Stock Returns following Large One-Day Declines: Evidence on Short-Term Reversals and Longer-Term Performance.” Journal of Finance 49:255–67.
- Dasgupta, A., A. Prat, and M. Verardo. 2011a. “Institutional Trade Persistence and Long-Term Equity Returns.” The Journal of Finance 66 (2):635–53. doi:10.1111/j.1540-6261.2010.01644.x
- Dasgupta, A., A. Prat, and M. Verardo. 2011b. “The Price Impact of Institutional Herding.” Review of Financial Studies 24 (3):892–925. doi:10.1093/rfs/hhq137
- Dorn, D. A. N. I. E. L., G. U. R. Huberman, and P. A. U. L. Sengmueller. 2008. “Correlated Trading and Returns.” The Journal of Finance 63 (2):885–920. doi:10.1111/j.1540-6261.2008.01334.x
- Edelen, R., Ö. İnce, and G. Kadlec. 2016. “Institutional Investors and Stock Return Anomalies.” Journal of Financial Economics 119 (3):472–88. doi:10.1016/j.jfineco.2016.01.002
- Eom, Y., J. Hahn, and W. Sohn. 2019. “Individual Investors and Post-Earnings-Announcement Drift: Evidence from Korea.” Pacific-Basin Finance Journal 53:379–98. doi:10.1016/j.pacfin.2018.12.002
- Gutierrez, R., and E. Kelley. 2008. “The Long-Lasting Momentum in Weekly Returns.” The Journal of Finance 63 (1):415–47. doi:10.1111/j.1540-6261.2008.01320.x
- Hong, H., W. Li, S. X. Ni, J. A. Scheinkman, and P. Yan. 2015. “Days to Cover and Stock Returns.” NBER Working paper, No. 21166.
- Hvidkjaer, S. 2006. “A Trade-Based Analysis of Momentum.” Review of Financial Studies 19 (2):457–91. doi:10.1093/rfs/hhj016
- Hvidkjaer, S. 2008. “Small Trades and the Cross-Section of Stock Returns.” Review of Financial Studies 21 (3):1123–51. doi:10.1093/rfs/hhn049
- Johnson, T. 2016. “Rethinking Reversals.” Journal of Financial Economics 120 (2):211–28. doi:10.1016/j.jfineco.2016.01.026
- Kaniel, R., S. Liu, G. Saar, and S. Titman. 2012. “Individual Investor Trading and Return Patterns around Earnings Announcements.” Journal of Finance 67:639–680.
- Kaniel, R., G. Saar, and S. Titman. 2008. “Individual Investor Trading and Stock Returns.” The Journal of Finance 63 (1):273–310. doi:10.1111/j.1540-6261.2008.01316.x
- Ke, B., and K. Petroni. 2004. “How Informed Are Actively Trading Institutional Investors? Evidence from Their Trading Behavior before a Break in a String of Consecutive Earnings Increases.” Journal of Accounting Research 42 (5):895–927. doi:10.1111/j.1475-679X.2004.00160.x
- Linnainmaa, J. 2010. “Do Limit Orders Alter Inferences about Investor Performance and Behavior?” The Journal of Finance 65 (4):1473–506. doi:10.1111/j.1540-6261.2010.01576.x
- Lo, A., and C. MacKinlay. 1990. “When Are Contrarian Profits Due to Stock Market Overreaction?” Review of Financial Studies 3 (2):175–205. doi:10.1093/rfs/3.2.175
- Lou, D. 2012. “A Flow-Based Explanation for Return Predictability.” Review of Financial Studies 25 (12):3457–89. doi:10.1093/rfs/hhs103
- Nofsinger, J., and R. Sias. 1999. “Herding and Positive Feedback Trading by Institutional and Individual Investors.” The Journal of Finance 54 (6):2263–95. doi:10.1111/0022-1082.00188
- Onishchenko, O., and N. Ülkü. 2019. “Foreign Investor Trading Behavior Has Evolved.” Journal of Multinational Financial Management 51:98–115. doi:10.1016/j.mulfin.2019.04.005
- Onishchenko, O., and N. Ülkü. 2021. “Investor Types’ Trading around the Short-Term Reversal Pattern.” International Journal of Finance and Economics. doi:10.1002/ijfe.2291
- Quian, X. 2014. “Small Investor Sentiment, Differences of Opinion and Stock Overvaluation.” Journal of Financial Markets 19:219–46.
- Scotti, M. 2012. “Delegated Portfolio Management with Career Concerns.” Journal of Economic Behavior & Organization 84 (3):829–39. doi:10.1016/j.jebo.2012.10.001
- Stein, J. 2009. “Presidential Address: Sophisticated Investors and Market Efficiency.” The Journal of Finance 64 (4):1517–48. doi:10.1111/j.1540-6261.2009.01472.x
- Ülkü, N., and E. Weber. 2013. “Identifying the Interaction between Stock Market Returns and Trading Flows of Investor Types: Looking into the Day Using Daily Data.” Journal of Banking & Finance 37 (8):2733–49. doi:10.1016/j.jbankfin.2013.03.021
- Vayanos, D., and P. Woolley. 2013. “An Institutional Theory of Momentum and Reversal.” Review of Financial Studies 26 (5):1087–145. doi:10.1093/rfs/hht014
- Yan, P. 2013. “Crowded Trades, Short Covering, and Momentum Crashes.” Working paper, Princeton University (available in SSRN).
- Yan, X., and Z. Zhang. 2009. “Institutional Investors and Equity Returns: Are Short-Term Institutions Better Informed?” Review of Financial Studies 22 (2):893–924. doi:10.1093/revfin/hhl046
- Zhong, L., X. Ding, and N. Tay. 2017. “The Impact on Stock Returns of Crowding by Mutual Funds.” The Journal of Portfolio Management 43 (4):87–99. doi:10.3905/jpm.2017.43.4.087