
ABSTRACT
Global warming has risen as a primary global concern. It has stimulated interest in the development of the renewable energy (RE) system. Studies demonstrated that the regions of Gulf Corporation Council (GCC) such as Bahrain, Kuwait, Oman, Qatar, Kingdom Saudi Arabia (KSA), and United Arab Emirates (UAE) face several changes in the form of uncertain weather conditions. Given the strategic location of the Gulf States and its enormous oil and natural resource, it is characterized to hold potential for using renewable energies such as solar, wind, and geothermal energy for meeting the power production needs. Previous studies suggested that energy consumptions such as crude oil and fossil fuels are the major sources of providing economic benefits to the states. The high oil price, deterioration of the financial markets, and incident of Arab Spring has shifted the working at a national and international level, making it important in using RE resources to generate excessive energy. The primary focus was to explore the scope of energy efficiency (EE) and the use of solar, wind and geothermal energy resources given their proliferation potential for the GCC region. The review assessed the energy and electricity consumption trends in the region. Also, it discussed the problems related to the effects of dust accumulation on devices. Moreover, it also highlighted the use of various computer interfaces that demonstrate the feasibility to use various RE technologies. Further, it draws conclusions and recommendations based on the issues.
Abbreviation: A/CAir Conditioning AGHE Air-Ground Heat Exchanger CF capacity factor CPVC oncentrated Photovoltaic CSP Concentrated Solar power DHI Diffuse Horizontal Irradiance DNI Direct Normal Irradiance DEWA Dubai Electricity and Water Authority EE energy efficiency EER energy efficiency ratio GHI Global Horizontal Irradiance GHE Ground Heat Exchanger GSHPs Ground Source Heat Pump system GCC Gulf Corporation Council ISCC Integrated Solar Combined Cycle IRENA International Renewable Energy Agency KAUST King Abdullah University of Science and Technology KSA Kingdom Saudi Arabia MPPT Maximum power point tracking NPV net present value OECD Organization for Economic Co-operation and Development PV photovoltaic PV/T photovoltaic/therma lR Erenewable energy RC RANKEN cycle SWH solar water heater SWOT strength, weakness, opportunity, and threat TOU Time-of use TPES Total primary energy supply UAE United Arab Emirates VAV Variable Air Volume VGSHPs Vertical Ground Source Heat Pump system
1. Introduction
In the past few decades, countries in the Gulf Cooperation Council (GCC) such as Bahrain, Kuwait, Oman, Qatar, Kingdom Saudi Arabia (KSA), and United Arab Emirates (UAE) have made substantial economic progress due to the effective usage of massive resources of hydrocarbon. Among the above-listed GCC countries, Kuwait and UAE are recognized as the wealthiest economies across the globe based on their per capita, as oil and natural gas resources power the rapid development of the region (World Proved Oil Reserves Citation2018).
Energy sources like natural gas and crude oil are well-identified based on their huge contributions toward rapid industrial growth and the resulting trade worldwide (Demirbas et al. Citation2017; Fattouh, Sen, and Moerenhout Citation2016). However, the level of dependence of any region in the GCC countries determines their pricing dynamics in the international business environment (World Proved Oil Reserves Citation2018). Previous studies suggested that about half of these reserves were concentrated around the middle-east nations, while parts of the Central and South American regions have the second-highest global oil reserves, as provided in . Perhaps, regions such as; Eurasia, Europe, Asia, and the Oceana region are limited in terms of reserves, which makes them unable in meeting the ongoing and ever-increasing demands of energy. In addition, the technology to extract nonrenewable sources is also expensive, which may cause a significant gap between demand and supply in the market (World Proved Oil Reserves Citation2018).
Table 1. Global oil reserves in %
Renewable energy (RE) sources supply 14% of the total world energy request. Large-scale hydropower plants supply about 20% of global electricity (Demirbas et al. Citation2017). The electricity consumption pattern of GCC is complex, and the fluctuations vary based on the usage type such as industrial, or residential. However, the rise in electricity tariff occurred in the years 2016 and 2018 which has reached over 360% for KSA. Recently, KSA has announced a significant rise in tariff consumption ranging up to 4000kWh/month with a minor change over this range () Saudi Electricity Company, https://www.se.com.sa/enus/Pages/home.aspx. International Monetary Fund has also projected an overall negative fiscal balance for the past two consecutive years for the GCC region (Oxford Energy Org, Citation2016). To adjust these deficits, governments of these regions have been changing their energy policies. For instance; Dubai Electricity and Water Authority (DAWA) has increased the tariffs from the year 2011; however, it accounted for no significant changes from 2012 to 2013. Similarly, the state of Qatar raised the prices of diesel by half in the year 2014. Almost all GCC regions have implemented their action plan to achieve targets to control fiscal deficits (Al-Maamary, Kazem, and Chaichan Citation2017; KAPSARC Citation2016; Key world energy statistics Citation2017; Oxford Energy Org Citation2016; Vision Realization Citation2016).
Table 2. Tariff for electricity pricing in a residential building in KSA
In addition to this, the decline in oil prices further contributes to the sudden deficit of economic prices. For instance; amongst all the GCC countries, the decline in oil prices substantially impact the economy of Oman, where it accounted for a deficit of about US$11.7 billion in 2015. Whereas, Bahrain’s projected budget deficit for 2015/16 was about 8.05 billion dollars. The Qatari government announced a deficit of US$12.8 billion, despite plans to cut spending while the projected deficit for Kuwait was US$ 40.42 billion (Oxford Energy Org Citation2016). Also, KSA also initiated a cut in total spending during 2016 with a fiscal deficit of about US$ 87 billion.
The inclination of the country toward energy efficiency (EE) has perpetuated in the region due to the increasing deficits which create a negative influence on the countries’ economy. The Gulf region based on it will be able to lead a more assertive role due to its progressing economic resources, resulting in a better quality of life. Considering the usefulness of RE, the potential for EE and alternative sources of energy in GCC needs to be investigated (Fattouh, Sen, and Moerenhout Citation2016; Nematollahi et al. Citation2016).
Hence, this paper presents a review of the energy resources in the GCC region along with policies for its production, consumption as well as cost. The remaining sections of the study will provide information regarding the developments in the GCC specifically related to the EE sector, RE (solar, wind, and geothermal), techno-economic analysis, and the usability of the hybrid system. The final section then provides a conclusion of the overall review followed by the meaningful recommendations.
2. Previous trends of GCC in generating renewable resources
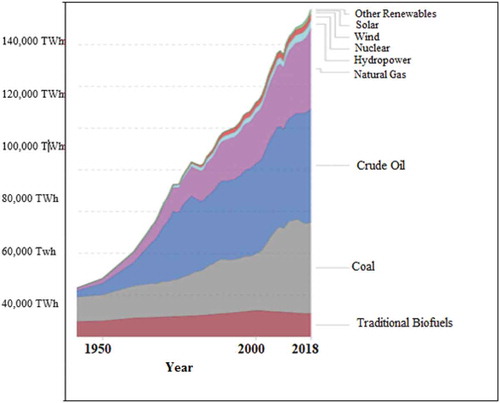
GCC area has mostly desert climatic conditions receiving higher solar irradiation during daytime in summer months. This time coincides with the peak load in the region. In some coastal regions, wind energy is abundantly available throughout the year (Abdmouleh et al., Citation2010). To cope with these challenges, a regional grid in the GCC region was developed in 2011. This further develops their inclination toward the use of various fuels in global generating electricity during the period 1950–2018, as illustrated in .
Figure 1. Trends in global electricity generation rate from the year 1950 to 2018 by fuel
Among various resources, the use of fossil fuel is shown to be most significant concerning the energy generation in the region. While, the use of RE sources was still limited until the past few years, as the contributions of RE (excluding hydro) in the world was about 7.1%, with contributions of hydro reaching about 23.1% in 2015. In addition to this, the use of coal in generating electricity was observed for about 39.3%, while for gas and nuclear power, it was 22.9% and 10.6% respectively (Key world energy statistics Citation2017).
The immense potential of different sectors, contributions of the renewable sector do not exceed 1% of total electricity generation in GCC and ranged between 0.01% to 0.46%, where the contribution of UAE with 144 MW before 2016 was stated to be the most significant. It is further determined that these regions failed to utilize wind energy as an effective contributor. To make it clear, a between the cumulative total RE capacity in MW for the GCC countries during the period from 2010 to 2019 is provided in (Sources Renewable capacity Citation2020). According to the table, the installed capacity in the GCC countries had been limited before 2016 and the capacity has increased significantly during the year 2019 in both the UAE, Saudi Arabia, and Kuwait.
Table 3. The installed capacity of renewable based electricity in the GCC region (MW)
In comparison to the RE, the installed capacity of solar energy in GCC countries in the past few years has been different. A comparison of the cumulative total installed solar energy in MW for the GCC countries during the last decade is presented in Sources Renewable capacity (Citation2020). It is noted from the table that the installed solar capacity in the GCC countries had been limited before 2018 which is almost similar to the installed capacity of RE, except for the State of Qatar where the solar source capacity was less than the renewable due to the presence of essentially biomass energy. The installed solar capacity has increased significantly during the year 2019 in the UAE, the KSA, and the State of Kuwait, knowing that the first thermal solar plant in the UAE was launched in 2013.
Table 4. A comparison of the cumulative installed solar power capacity in MW for the GCC countries during the period 2010 to 2019
While, for the RE capacity of electric power generation in GCC, presents a summary of the installed RE capacity in the GCC countries until the end of 2018. According to the findings, till the end of 2018, the Gulf region as a whole had 867 MW of RE. For comparison, the GCC countries have about 146 GW of conventional installed electrical power, and thus, RE systems made up only 0.6% of the installed capacity. Further indicates in that solar energy projects constitute the largest percentage in terms of installed power. The State of Qatar is considered the primary beneficiary of converting waste into electricity in the region (Rabia Ferroukhi Citation2019). The UAE accounted for 68% of the total renewable installed capacity in the region until 2018, followed by KSA 16% and Kuwait 9%.
Table 5. Summary of the cumulative installed RE for electric power generation in the GCC countries until the end of 2018 (MW)
The potential of solar and wind energy generations in GCC nations is provided in (Griffiths Citation2017). The table revealed that power generation using tidal has never been a considerable option in GCC, although land and offshore wind and solar residential roofs have good potential for energy generation. A major part of the energy i.e., (45%-80%) can be generated through modules installed on rooftops. This method of generating energy is advantageous as it can be used at the same time and same place. Energy generation by CSP technology has a potential in the range of 6.5–35% for power production.
Table 6. GCC REpotentials percentage for power production %
3. Renewable energy sector developments
The GCC region has seen steady growth in several sectors including installing larger capacity solar power plants, photovoltaic (PV) industry, and desalination projects. The investment in RE projects in the GCC regions between 2006 and 2018 is illustrated in (Rabia Ferroukhi Citation2019) .
Figure 2. The investments in RE projects in G nations during the period 2006–2018
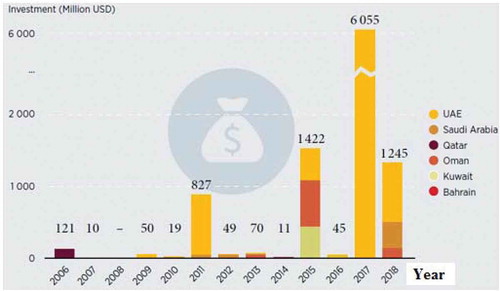
Actual investments in RE in the GCC countries started in 2011 with US$ 765 million in a 100 MW concentrated solar power (CSP) plant in Sun 1 in the UAE that was operational in 2013. However, a significant decrease in investments was recorded from 2012 to 2014, while in 2015, the increased government interest and lower technology costs laid to the investments in new projects for approximately US$ 326 million in the second phase of the Mohammed bin Rashid Al Maktoum solar power plant with a capacity of 200 MW in the UAE and US$ 400 million in the Shaqaya project in the country Kuwait and the US$ 600 million in the Mira Solar Euro 1 GW project in the Sultanate of Oman.
In 2016, a decrease in investments was recorded which were then recovered again in 2017, mainly due to three large-scale solar projects in the UAE with an estimated cost of US$ 6055 million. Furthermore, in 2017, investments in small solar projects were estimated at approximately US$ 40 million in the UAE, US$ 30 million in the KSA, and US$ 12 million in Oman. In contrast, the available investment data for 2018 includes an additional US$ 490 million for the fourth phase of the Mohammed bin Rashid Al Maktoum Solar Park. It also includes an estimated US$ 320 million for the 300 MW solar PV project in KSA, US$ 125 million in the 50 MW wind power project in Oman, and US$ 225 million in the 27 MW waste transfer plant in Sharjah in the UAE. It is noted from the above that the UAE constitutes the largest share in RE investment in the region.
The results of the International Renewable Energy Agency’s (IRENA) report show that if implemented, various plans related to the RE sector for the GCC region can help in potential savings of 2.5 billion barrels of oil equivalent in the years 2015–2030. It may lead to an overall savings of 55–87 billion US$ for the KSA of Saudi Arabia, which is the largest consumer of fossil fuels in the region and could result in savings of about 170 million barrels of oil starting from the year 2030. To emphasize further, a comparison of various indicators for the energy sector of the GCC countries with other nations for the year 2015 is presented in Key world energy statistics (Citation2017). Although just about 3% of the world population resides in the Middle East, this region consumes about 4% of total electricity and 5.3% of total energy consumption in the world. Around 14% of the share of the world’s energy market is produced in this region thus making it an influential player in the energy market.
Table 7. Selected energy indicators in the GCC, the Middle East, EU, and the world for 2015
Trends in RE policy to find the most effective and possible ways to catalyze RE resources were investigated by (Griffiths Citation2017). He showed that RE auctions based on the utility-scale are the primary modes of stimulating RE deployment. The researchers further highlighted that the region is well suited for a first-price sealed-bid auction. Details of technology transfer, their drivers, and impacts on the energy policies of GCC states were laid out (Atalay, Biermann, and Kalfagianni Citation2016). They also pinpointed various factors that cause a lag in the utilization of RE. They have proposed three main hypotheses for the emergence of RE as an attractive choice in the Arab Gulf area such as developments as a result of technology development within the countries, as a result of technology transfers from other nations, and last the compilation of various agreements regarding United Nations agreements on Climate Change.
Plans that enable institutions and administrators in analyzing financing, capacity evaluation, and technology factors for the RE sector and EE as shown in (Lude et al. Citation2015). The contribution of the RE sector increased from 1% in the year 2015 to 5% in the year 2020. It was expected to reach about 20% in the year 2035. Savings in EE was also expected to reach about 12% in the year 2035.
Table 8. Implementation plan
Administrative reforms are planned to be performed in the year 2020 to generate suitable building codes that can help in energy distribution and utility. Financial reforms like tariff changes, investments in R & D, and system subsidies were implemented to achieve targets related to these issues. The creation of micro-grids, certification labs, and grid evaluations was an aim of other capacity and technology-related goals. Knowledge building and the creation of an active workforce have been targets of various educational, training and international collaborations forged several years ago.
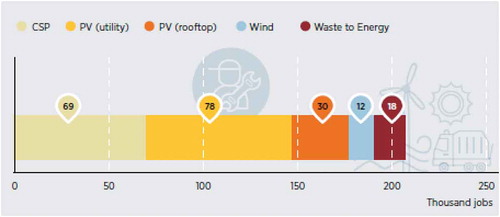
Strength, weakness, opportunity, and threat (SWOT) analysis of public perception regarding the utilization of RE resources for GCC countries was done by (Abdmouleh et al. Citation2018). The policy analysis was done taking into account the specifications of the economy of each nation and its relation with global markets. This study, in general, focuses on the political, legislative, technological, financial, fiscal, and environmental hurdles in the implementation of RE policies. According to the study findings, individual social interactions and learnings at different stages might develop pro-environmental energy choices and behavioral changes. Besides, net savings play a critical role in providing long-term economic benefits. The study further suggested that the energy bill of any household might be reduced i) by making themselves self-sufficient in becoming a partial energy producer, ii) by conserving energy and changing the mode of consumption. Opportunities and challenges of enormous scale photovoltaic using SWOT analysis in KSA was presented by (Almarshoud and Adam Citation2018). Based on these investigations, a scenario development took place to achieve a target of 9 GW of installed capacity using enormous scale photovoltaic power plants. The results determined that the deployment of enormous scale photovoltaic is effective in strengthening the collaboration between international and local companies. Creation of more than 18,000 jobs was predicted by (Almarshoud and Adam Citation2018). King Abdullah City for Atomic and Renewable Energy has announced a goal of installing about 41 GW of solar power generation by the year 2030. A need to employ about 218,650 new workers by 2030 in KSA was predicted by (Alyahya and Irfan Citation2016). The scope of RE around 139 different countries was studied by (Jacobson et al. Citation2017), concluding that this sector can create 24.3 million jobs. A general survey done by the IRENA estimates that the GCC nations could generate roughly about 140000 direct jobs every year by the developing sector () (Ferroukhi et al. Citation2013).
Figure 3. Jobs available in sustainable energy markets
4. Energy efficiency and its role in GCC regions
Improvement in EE means using less energy for producing the same quantity of services or useful output Ang (Citation2006). EE studies verified the actual pattern of energy consumption in buildings, to outline energy baselines and consumption indicators that are essential to enhance energy performance (Ang Citation2006; Asif Citation2016; Ayoub et al. Citation2014). Analysis of EE provides solutions and approaches that can help users, organizations, authorities, and utilities to optimize their working concerning energy rationalization with fewer costs. Concerning the GCC countries, (Asif Citation2016) reported that UAE had the highest scope for green sustainability as 70% of its buildings designs were implemented as per the energy and environmental sustainability rating program named Pearl Rating System.
In recent years, GCC nations have planned and devised strategies for the conservation of natural resources and the deployment of RE technologies. Based on the European Directive 2006/32/EC, efficiency Guidelines were adopted in UAE in the year 2010 with an intent to develop a national action plan for EE (Griffiths Citation2017). The adoption led to the integration of green energy technology in about 70% of the buildings in the UAE. Furthermore, implementation of minimum energy performance standards is critical as chillers installed in the GCC could help to reduce peak electricity demand to about 15% (Afshari and Friedrich Citation2016). District cooling networks may also help to cut energy demand by 40–45% as compared to traditional systems, stressing the need for urgent attention from policymakers (Lahn and Preston Citation2013). “Energy Demand Side Management (DSM) and EE” of the EU-GCC Network was proposed by (Papadopoulou, Doukas, and Karakosta et al. Citation2011). The key message of promoting cooperation by sharing expertise and knowledge was beneficial for creating public awareness.
The energy conservation methods in hotels based in Qatar focusing on building insulation design, customer behavior, and supply of RE resources were analyzed by (Ayoub et al. Citation2014) They reported potential savings of 7.5% in energy conservation using envelope redesign whereas the conservation through behavior change ranged between 2.74% and 15.80%. The analysis proved an emission reduction of about 27%. The mean energy intensity in Abu Dhabi was about 349.1 ± 102.6 kWh/m (Demirbas et al. Citation2017) based on a survey of 36 residential units (Giusti and Almoosawi Citation2017). They also showed the importance of the role of the behavior of occupants in energy conservation for the residential sector in Abu Dhabi.
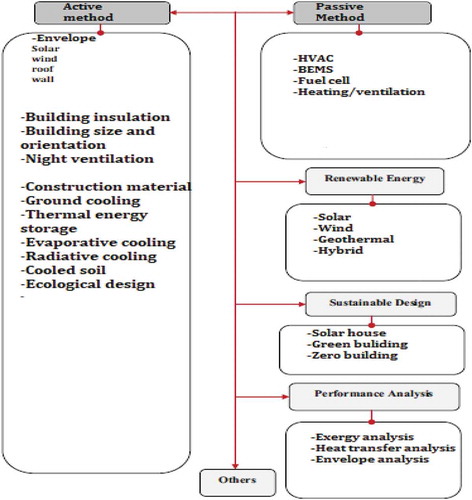
A comprehensive review of energy management in Saudi buildings showing the importance of using RE sources and applying EE measures was presented by (Abdul Mujeebu and Alshamrani Citation2016). Such as resources of energy like wind, geothermal, and biomass may be proposed for buildings, which may open research ventures, like heating, ventilation, and air conditioning systems. Two important methods were used to conserve and manage energy in the buildings. These methods are described in (Abdul Mujeebu and Alshamrani Citation2016). Passive methods are based on changes in construction materials used for enveloping buildings, natural ventilation, and technologies. Whereas, the active system includes the use of devices working on RE technology for heating, cooling, and ventilation purposes. The sustainable design can be evaluated using various performance analysis techniques, to achieve an optimum ecological design that is energy efficient and user-friendly.
Figure 4. Potential methods for the conservation and management of energy in buildings
Various drivers for the demand for residential electricity in the region, by application of the time series model, were studied by (Atalla and Hunt Citation2016) . The demand was found to be inelastic, with values in the range from −0.16 to 0. An analysis of the process of various energy sources in the GCC was provided by (Krane and Hung Citation2016). The analysis showed the need for reformations in energy prices to allow maintenance of long-term benefits, increase the attractions of non-carbon sources, and encourage energy conservation. Various subsidy reforms have been an attractive option to redistribute natural resource wealth in citizens, enhancing competitiveness. An ecological modernization model of energy sectors, analyzing subsequent benefits was discussed by (Reiche Citation2010). Based on an assumption, they concluded that the concept of policy transfer is a fundamental need in projects like Masdar City.
The scope of the most suitable program for Kuwait to control electricity consumption per capita was studied by (Alasseri, Rao, and Sreekanth Citation2018). Evaluation of the impacts of the reduction in energy prices for the household buildings in Kuwait was done by (Ameer and Krarti Citation2016). They reported that the energy bills would be reduced by 21% for each household while the energy subsidies gained by the government would be lowered by 28% relative to the current plan and the peak demand reserves range 56%- 59% during the summer months. Three levels of a retrofit program that showed economic and environmental benefits in Kuwait was by proposed (Krarti Citation2017). Findings reported that retrofitting could help to achieve the 50% savings for the case of residential buildings in Kuwait.
Evaluation of the benefits of mega-scale EE programs in Qatar was reported by (Krarti et al. Citation2017). They showed improving EE in buildings could provide space cooling with a reduction of 28% of the annual energy consumption of residential buildings. The application of envelope thermal insulation, proper adjusting of the indoor set temperature, and use of lighting effects lead to a reduction of energy intake up to 46% in the residential building in the city of Doha (Kharseh, Al-Khawaja, and Hassani Citation2015). Results from a survey of public perception about smart grids, smart meters, RE, and the environment in Qatar revealed that the majority of the respondents were unaware of any of the following energy-saving materials at homes (Abdmouleh et al. Citation2018). A method that would help in categorizing and trading off sustainability and facility management values using subjective driven priorities from top-level management was analyzed by (Rodriguez-Trejo et al. Citation2017). The tool also helps to monitor the performance of the project design in the context of the state of Qatar but is applicable in other countries.
Simulation analysis performed by (Alaidroos and Krarti Citation2015) showed that applying optimum energy performance measures could result in governmental subsidies saving up to 36% without affecting the present electricity generation charges for households in KSA. The relationship between load profiles and demand management, PV integration, and forecasting was proposed by (Bayram, Saffouri, and Koc Citation2018). They also proposed a methodology for the estimation of cooling load in Qatar and proved that more than half of the electricity consumption was during summer months for cooling purposes. Evaluation of economic and environmental impacts of EE programs associated with buildings in the KSA was reported by (Krarti, Dubey, and Howarth Citation2017). They also reported reducing of 27% in energy consumption and about 30% in electricity peak demand by the implementation of EE programs. A nonlinear U-shaped relationship between energy demand and development for the KSA was explored by (Mahalik et al. Citation2017). Improvements in efficiency could affect decisions in various sectors of the economy were reported by (Matar Citation2015). The study also reported a 16.1% reduction in residential electricity consumption by raising the air conditioners’ average energy efficiency ratio (EER) to 11 (BTU)/(Wh). Applications of thermal insulation and improved EER could increase the average thermal efficiency for the total electricity generated from 34% to 35.5%. Evaluation of building energy for five site locations in KSA was reported by (Krarti, Dubey, and Howarth Citation2017). They noticed that electricity consumption could be reduced by 10054 GWh/year. Consumption of electricity could be reduced by 15% using Tailored MEPS Afshari and Friedrich (Citation2016). Variable Air Volume (VAV) systems could help to achieve savings of between 35% – 63% over the VAV base case in the UAE (Friess and Rakhshan Citation2017).
Consumption of electricity in the GCC region rose at a rate of about 12.4% in the period of 2004–2009 (Alnaser and Alnaser Citation2011). About 60000 MW of generation capacity is needed in the GCC region by the year 2015, which represents 80% of the current capacity. It requires the installation of about 50 additional gas-fired turbines (each rated 1400 MW). Second Development Plan 2015–2020 (DP15-20) as reported by (Alsayegh, Saker, and Alqattan Citation2018) could be implemented to reduce 15% of renewable sources demand by 2030, reducing CO2 emission reduction by 33% by 2035. The data regarding the growth of population, energy demand, and expected energy prices, reduction of CO2 emissions, and surplus energy available was analyzed by Said et al. (Citation2018a). The UAE has announced its 2050 Energy Plan, which is aiming for a 50% increase in clean energy supply. It further needs the adoption of more RE sources as reported by (Lim, Foo, and Tan Citation2018). A comprehensive review of the energy retrofit program about recent trends in energy consumption in the building sector within the UAE was reported by (Lešnik, Žegarac Leskovar, and Premrov Citation2019). This plan could help to achieve savings of 7550 GWh/year in consumption of electricity, 1400 MW in peak demand for electricity, reducing carbon emissions by 4.5 million tons/year. The program has the potential to create about 9000 jobs annually with a payback period of fewer than six months.
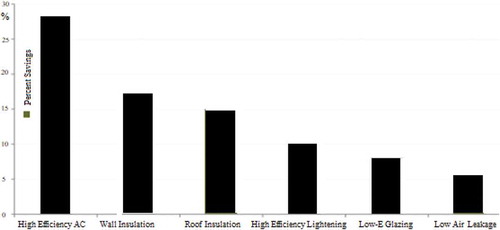
Two possible scenarios for reducing carbon emissions were proposed by (Lim, Foo, and Tan Citation2018). The first scenario predicts a 65% growth in the RE sector, whereas, the second case predicts the use of 80% of natural gas-fired plants retrofitted with carbon capture and storage. Furthermore, shows the benefits of energy savings with the change of building designs in KSA. It demonstrates that improvements in air conditioning systems can help to reduce total energy consumption by 27% in residential buildings in comparison with other methods (Mikayilov, Galeotti, and Hasanov Citation2018).
Figure 5. Contributions of electricity in annual energy savings in prototype villas in KSA
In the context of GCC, demonstrates findings related to the new countries’ plan to improve EE. According to the table, most countries have ambitious plans to improve the use of energy while meeting individual needs (Rabia Ferroukhi Citation2019).
Table 9. Energy efficiency plans in GCC
5. Analyzing the consumption and the potential of solar energy
5.1. Trends of generating solar energy
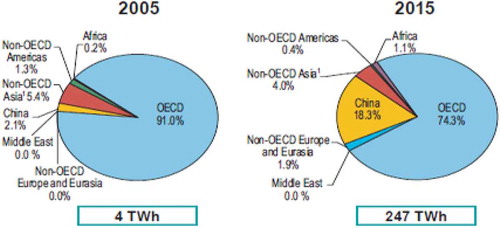
The trends in electricity-generating over the period from 2005 to 2015 using solar PV technology in different regions of the world are illustrated in . (Key world energy statistics Citation2017). According to , a significant increase has been recorded i.e., from 4 TWh in 2005 to 247 TWh in the year 2015. It may be noted from the figure that the Organization for Economic Co-operation and Development (OECD) countries are widely using this technology. The contributions of OECD countries were most, being 91.0% in the year 2005 and 74.3% in the year 2015 (). The Contribution of China increased from 2.1% in 2005 to 18.3% in the year 2015. It was noticeable from these figures that the participation rate of the Middle East countries was almost 0% for the whole reported period. This reflects the need to develop solar-based energy systems in the GCC region.
Figure 6. Global production of electricity via solar PV technology from 2005 to 2015 by region (TWh) 1. Non-OECD Asia excluding china
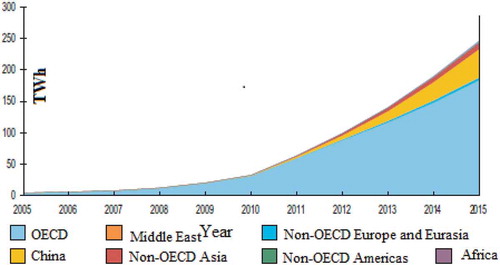
Figure 7. Regional shares of solar PV electricity production in 2005 and 2015
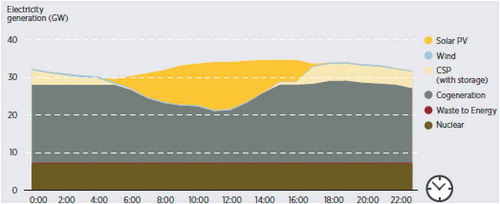
Besides, DEWA has launched a web-based application, to help customers to decide on conditions for the installation of PV on their rooftops using an interactive mapping technique. CitationAl Masdar Institute in collaboration with British Petroleum and Rio Tinto has announced a US$2 billion deal for a 500 MW project. It includes an area of about be 6 km2 with 50000 people and has a solar power-based water desalinization plant. (Sharples and Radhi Citation2013) assessed the performance of PV technology integrated into residential buildings in the GCC countries. The analysis showed a 4–6% drop in efficiency due to higher ambient temperatures. With a constant increase in population in UAE, demand in its energy production needs to be analyzed as reported by (Jamil, Ahmad, and Jeon Citation2016). Abu Dhabi’s Masdar has played a role in the RE sector. The 100 MW Shams 1 CSP plant is considered a notable achievement for the UAE in energy storage technology. The energy generation using solar PV in the region was an attractive choice in the UAE () (Sgouridis et al. Citation2013). It can cater to the midday peak demand, CSP with storage was a viable technology to address the evening demand and was in tandem with demand-side management.
Figure 8. Daily projected electricity production using different technology for UAE in 2030
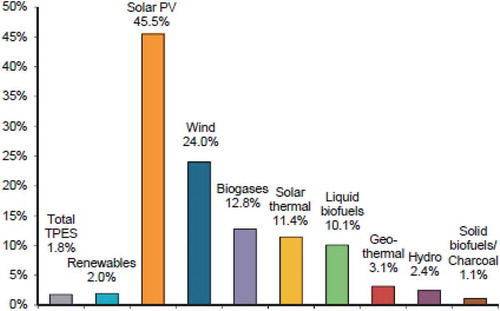
The global average growth rate of various renewable resources of energy for the years 1990–2015 is provided in (Renewables Information: Overview. Renewable energy accounted for 2% of the total energy supply. The highest rate was about 45.5% for solar PV followed by 24% for wind energy. Contributions of biomass were negligible.).
Figure 9. Average annual growth rates of world renewable supply from 1990 to 2015
5.2. Potential the use of solar energy
Solar-Based technology had the highest potential in the GCC region. This is evident from the scholarly work of various scholars who have undergone an investigation on policies in the PV market. Such as (Hadjipanayi et al. Citation2016) investigated the PV installed in the Middle East/North Africa parts in terms of policies/initiatives for the PV market. Metering and self-consumption are good practices for growth in the PV market. A review of major solar energy programs operating in this region was investigated by (Munawwar and Ghedira Citation2014). Most of the GCC region had average daily radiation of over 6kWh/m2 and 80–90% clear weather conditions existing throughout the year. It makes solar the most preferred choice for this area amongst all available resources. Also, for each nation, there have been detailed investigations to review the potential of using solar energy. An analysis of long-term solar resources and the expected electricity generation scenarios in Qatar was presented by (Martín-Pomares et al. Citation2017).
Experiments on a 500-kW capacity microgrid system installed in Qatar were conducted by (Cen et al. Citation2018). This system had a battery storage system (lithium-ion-based), a control panel, and a grid-connected to the building. The power quality of the grid improves by increasing the insulation of an energy storage system. Data was collected using satellites from 2003 to 2013. It was further characterized to generate annual and monthly maps of solar irradiation. The potential of distributed generation (DG) using solar and wind energy in various regions of KSA was assessed by (Ramli et al. Citation2017). They analyzed the targeted generation capacities of 50 GW by the year 2040. Oil accounted for around 41% of the energy supply, whereas the contribution of Natural gas was 22% in the case. RE had contributions of just 7%. Wind energy has significant contributions in terms of power generation capacity. Costs, policy, and technical development of solar PV in Oman by studied by (Kazem et al. Citation2017). The yearly yield factor for a 1 MW GCPV plant system was 1875.1 kWh/kWp with a capacity factor (CF) of 21.7%. A summary of greenhouse gas emissions and the resulting energy balance in the UAE to encourage renewable and sustainable energy practices was presented by (Juaidi et al. Citation2016).
An analytical study of data obtained from 30 stations based on data of Global Horizontal Irradiance (GHI), Diffuse Horizontal Irradiance (DHI), and Direct Normal Irradiance (DNI) was conducted by (Zell et al. Citation2015). The annual average daily GHI was about 5700 kWh/m2 to 6700 kWh/m2 in KSA. They reported that the annual average exceeds the minimum yearly threshold of 1800 kW h/m2 year in most regions which is reasonable for use in concentrating solar technologies. They further point out that based on GHI values, PV technology was more suitable in the western region as compared to eastern sites with a relatively lower Levelized cost of electricity. However, higher temperatures may degrade the performance of devices, and dust accumulation needs frequent cleaning. Hence environmental parameters are vital considerations.
A forecasting model that could predict daily average solar radiation in Kuwait based on artificial neural networks was developed by (Bou-Rabee et al. Citation2017). Data obtained from five sites in Kuwait was used to help investors, and power engineers select suitable locations for installations. It evaluated the performance of these ANNs and found their efficiency to be about 94.75%.
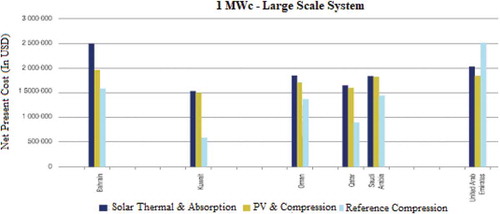
An analytical study related to solar cooling technologies and recommendations for starting R&D programs regarding solar energy was conducted by (Mugnier, Jakob, and Kohlenbach Citation2016). The average cost for investment in solar cooling was found to be 1300 US$/kWc for a 1 MWc system. For the PV & compression system, the cost estimation was at 1800 US$/kW for the same capacity. Hence a reduction of 44% was achieved, indicating that solar PV cooling is more economical than the reference system over 20 years in UAE () (Mugnier, Jakob, and Kohlenbach Citation2016).
Figure 10. 20 years Net present cost (USD) Vs capacity (MWc)for various solar cooling technologies configurations used in the GCC region
5.3. Solar energy applications
Photovoltaic solar system is an attractive method for power generation and is classified as a standalone and grid-based system. The potential of integration of a 1 MW PV plant with a power network using a simulator to analyze the electrical power distribution system in Bahrain was assessed by (Pillai and Naser Citation2017). The output of an 8.64 kW smart PV solar system installed on a roof for 18 months was studied by (Alnaser Citation2018). The device was tilted by 25° and placed 45° in the south-west direction. This device-generated about 8879 kWh of solar electricity in the year 2015 .
Table 10. Overview of CSP projects in the GCC region
Figure 11. A common solar plant CSP
The performance, environmental impact, and costs of 1 MWp plant working in the state of Kuwait were investigated by (Ali, Zeid, and AlFadhli Citation2017). It was estimated that polycrystalline technology needs about 19.33% more area as compared to mono-crystalline one. The thin-film cadmium telluride (CdTe) technology had lesser capital cost with minimum harmful emissions. TRNSYS analysis of a PV installation that had a payback period of 7.9–16.4 years was performed by (Alghamdi, Bahaj, and Wu Citation2017). A study on PV-PCM system with water circulation in Al Ain, UAE concluded that the heat losses reduced by up to 435 kWh/day (Hasan, Alnoman, and Shah Citation2016). The proposed system caused an improvement in electrical efficiency by about 6% and thermal performance by 41% as compared to the available global solar irradiation.
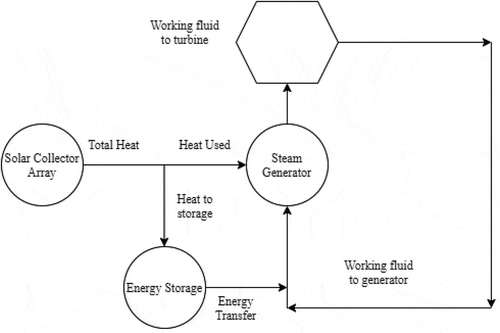
Cogeneration is also an interesting aspect that involves the use of both heat and power together. A dynamic economic model that visualized the reduction of oil consumption by about 2 million dollars per day by the year 2032 was proposed by (Matar et al. Citation2017). They have also proposed a CSP model having the potential of storing thermal energy.
5.4. Solar energy projects
Next include the overview of CSP plants in the GCC countries presented in , Concentrated Solar power (CSP) Project, as in the case of 2017, (NREL Citation2017) and shows that Kuwait, KSA, and UAE have implemented major projects in this area with capacity ranging between 43 MW and 600 MW indicating that parabolic trough technology was the most feasible and useful one. The analysis of the projects revealed the use of the RANKEN cycle (RC) in all projects. Furthermore, the projects used solar collectors as a source of power to operate the turbine, using either thermal oil or molten salt as a working medium. Also, some projects rely on energy storage and others without storage. Besides, an overview of major PV solar projects operating in the GCC region . Weather conditions were found to affect the performance of solar cells severely is provided in (AlEmadi Solar Citation2012; Griffiths and Mills Citation2016; Mas’ud et al. Citation2018; Saudi Arabia Kingdom Embassy Citation2011).
Table 11. Overview of major PV solar projects in GCC countries
5.5. Usefulness of RET screen tool
RET Screen is a widely used Software system for analysis of EE, RE, and feasibility analysis of cogeneration projects.RETScreen (Citation2018) Expert is an advanced version of this software, which has viewer mode. This tool is useful for professionals and decision-makers in identifying, assessing, and optimization of the technical and financial feasibility of clean energy projects. However, a comparative study of solar and wind energy systems installed in the GCC region mostly in KSA is provided in . These applications were based on thermal or electric use of the RETScreen interface. Many works have been done by researchers to show the potential benefits of the utilization of solar-based devices. The scope of solar water heater (SWH) systems in various cities of KSA was studied by (Abd-ur -rehman and Al-Sulaiman Citation2016). The heater used had an evacuated tube and glazed flat plate solar collectors.
Table 12. Overview of various projects using RETScreen in the GCC region
Further, from the solar radiation data, the cities of Nejran, Bisha, and Madina were found to be most suitable to install SWHs, whereas the city of Sulayyil was least suitable. The payback period is a term used for the financial analysis of any project. It is the period needed to recover investments made. From this analysis, the cities of Riyadh, Dadharan, and Gassim showed the more economic feasibility of using evacuated tube SWH over flat glazed collectors (Abd-ur -rehman and Al-Sulaiman Citation2016).
The Thermosiphon Flat Plate SWH technology using RETScreen program at six sites in KSA for the residential sector was reported by (Almasri and Almarshoud Citation2016). They reported a broader perspective to include the costs, benefits to society, and the environment. Various parameters analyzed include the amount of heat delivered, solar fraction, CO2 emissions reduction, the savings in energy and money, payback period, net present value, and the benefit to cost ratio. Clearly, the results show the feasibility of using SWH in KSA as they reduce electricity consumption by about 7.5%. The payback time for all selected sites is between 7.25–8.35 years which was reasonable. They (Almasri and Almarshoud Citation2017) further presented a technical, economic, and environmental study of using the evacuated tube SWH system in residential buildings in KSA. The results show that utilizing the system with heat pipe is feasible and payback time for this system for all sites was in the range of 3.4–3.9 years.
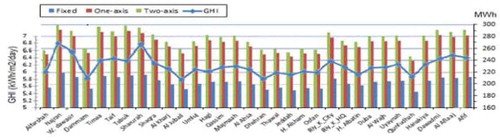
The economic analysis of PV systems installed in residential buildings using RETScreen software in 6 cities of UAE was carried out by (Said and Mehmood Citation2017). The performance of fixed tilt angle, single and dual-axis tracking modes of solar PV models to find their yield and CF, as well as performance ratio, was investigated by (Almarshoud Citation2016). Direct variations in the total energy injected with the average global horizontal irradiance for each site are indicated in (Almarshoud Citation2016). One axis tracking system was best suited for KSA. Najran site is giving the best performance. Southern parts were seen to receive energy in the winter season as compared to the northern region and vice versa. The performance ratio was independent of the location or size of the system and inversely proportional to the average temperature. Hence, sites like Tabuk, Taif, and Tima having a lower average temperature have a higher performance ratio. It found a minimum value of the performance ratio of 83.36 at the site of Hada Alsham, while the maximum value of 85.84% was in Tabuk. It reported that due to energy losses and weather changes, CF was under 40% for most regions in KSA.
Figure 12. Total electrical energy injected in grid Vs total radiation received
The technical, environmental, and economic study that used RETScreen software for 10 MW power plants installed at 44 sites in KSA was presented by (Rehman et al. Citation2017). The site of Bisha was found to be the most suitable due to the highest solar radiation intensity and longer sunshine duration; whereas, Sulayel was found to be the least suitable. They recommended that the government subsidy of 30–70% with a payback period in the range of 12 to 15 years.
The collaboration between the Masdar Institute of Science and Technology and the King Abdullah City was aimed to create a web-based technology that was connected to Renewable Resource Atlas, whereas different solar thermal electricity utility-scale technologies were simulated by (Ibarra, Frasquet, and Al Rished et al. Citation2016) A nano-fluid based system was developed to meet the electrical demands of Dhahran, using photovoltaic/thermal (PV/T) systems. Al-Waeli et al. (Citation2017), Lari and Sahin (Citation2017) Attempts were made to improve the performance of the system along with PV/T systems comparisons for efficiencies and performances. Water and Nano-particles could be used as the base fluid to increase efficiency.
5.6. Examining the effects of solar cooling
In the Gulf region, residential buildings consume more than 40% of the generated electricity where 70% of it is used for cooling purposes. The cooling load depends on the amount of solar irradiation and ambient environmental conditions. Computer-based simulation and optimization methods may be utilized to perform the thermo-economic analyses of these systems. The cost of installation and maintenance charges may be significant hindrances in operating solar cooling systems. Issues related to human health and other environmental problems must be taken into account while justifying the cost. The available solar adsorption chillers were not suitable for the condition in KSA and the use of hybrid re-coolers that were fit for use with higher heat rejection temperatures was recommended by (Al-Mogbel, Ruch, and Al-Rihaili et al. Citation2013). The performance and capacity of a silica gel/water-based solar adsorption system in the cities of Cairo and Aswan in Egypt and the city of Jeddah in KSA was analyzed by (El-Sharkawy, AbdelMeguid, and Saha Citation2014). The maximum average cooling capacity of the system working at Cairo and Jeddah reached about 14.8 kW, whereas that system at Aswan reached about 15.8 kW. The system with hot water buffer storage had a higher daily cooling capacity and an average coefficient of performance.
TRNSYS program to optimize designs for a solar collector system was used by (Sim Citation2014). Electricity consumption was reduced by 47% using this type of adsorption cooling system as compared to the conventional compression cooling system. The potential of using parabolic trough collector with double-effect absorption chillers for cooling in residential purposes was investigated by (Ghaith and Razzaq Citation2017). This model was implemented for a Dubai based four-story residential building. In terms of performance and cost, a hybrid system having contributions of solar up to 30% was most suitable when compared to other alternatives. The proposed system had a payback period of 2.5 years, with the potential to reduce the Carbon-dioxide emissions by 304 tonnes/year. The potential of using PVSOL software for rooftop PV installations located in the city of Al-Khubar of the KSA was investigated by (Dehwah, Asif, and Rahman Citation2018). RETScreen for solar PV technology in Saudi houses was examined by (Taleb and Sharples Citation2011). Various cooling techniques such as lithium-bromine absorption cooling system, Rankine engine-powered, flat-plate solar collector-powered thermo-chemical absorption, and use of passive convection tower were compared by Abdul Mujeebu and Alshamrani (Citation2016). Simulations proved that the solar adsorption system could cope up with the considerable air-conditioning load in KSA. However, the chillers used were not suitable for use in these temperature zones. In order to improve the efficiency and water consumption rate, he recommended using hybrid re-coolers and different adsorption systems that can reject heat at higher temperatures.
6. Dust accumulation
Solar-based technologies discussed above are much more reliable, durable, and dependable. However, these devices are facing several key operational issues of which soiling or dust accumulation obstructs performance by blocking the incoming solar irradiation. Dust storms, particulates in environments, and harsh conditions are significant sources of dust accumulation of solar PV devices. The objective of this part is to review the effects of soiling on solar devices. It may be noted that the GCC region had the highest dust deposition flux in the world due to prevailing climatic conditions as reported by (Costa, Diniz, and Kazmerski Citation2018). They indicate the major challenges in this area include mitigation of the dust as well as various cleaning methods used. Metrological data about the area of installation can provide information about problems of the soiling situation. In many cases, these issues are related to the cleaning period with the particular-climate condition. The factors influencing the effects of accumulated dust on the efficiency of the solar collector or solar cell are indicated in .
Table 13. Factors influencing the effect of accumulated dust on the efficiency of the solar collector or solar cell
This part discusses recent works done in dust accumulation on PV modules installed in the GCC region. Most of the study period for these works was for a short duration of time. A 1 MW grid-connected PV system that was optimized to match the daily peak load in Bahrain was studied by (Pillai and Naser Citation2018) Results proved that large-scale PV could be an attractive alternative to meet future electricity demand. The rate of accumulation of dust particles on the PV system was about 100 mg/m2 per day when exposed for two months in Doha (Javed et al. Citation2017). The maximum power output from a Poly-crystalline panel installed in Doha fell by 30% due to exposure to dust for five months (Touati et al. Citation2016). They also suggested frequent cleaning and advice on cleaning frequencies of PV panels. The PV performance of panels installed in Qatar for two years shows that panel output power decreased by 50% due to dust accumulation for eight months (Touati et al. Citation2017). Also, due to lower ambient temperatures, clear weather conditions, and occasional rainfall, the PV panels showed higher output power in the winter months as compared to the summer season. Besides, within one month, a cloudy condition in winter causes a 20% drop in average output power. Therefore, a strategic plan was needed to build and manage a PV plant efficiently in harsh environments such as those found in Qatar.
Results of losses in energy due to the accumulation of dust on PV systems installed in Oman were presented by Kazem and Chaichan (Citation2016). These losses were negligible for an accumulation rate of less than 1 g/m. The maximum loss of efficiency daily was found to be about 0.05%. A 35–40% reduction in power production indicates the need for cleaning equipment. Fuzzy logic and GIS-based spatial multi-criteria method to show the effects of temperature and dust on power generated from the PV cell installed in Oman was analyzed by (Charabi and Gastli Citation2013). The extent of contamination of air with aerosol was analyzed using the COSMO Numerical Weather Prediction model. The suitability of Land to install large PV farms was also done with Concentrated Photovoltaic (CPV) technology more suitable than other technologies. It has been estimated that about 16.1 TWh of power was generated in 2010 using solar PV technology.
The effects of wavelengths on the transmittance of PV panels installed in the state of Kuwait was investigated by (Qasem et al. Citation2012). A decreasing trend was observed with wavelengths lesser than 570 nm. For the case of the amorphous silicon, about a 33% reduction in photoelectric current was seen due to dust accumulation of 4.25 mg/cm. Similarly, about 28.6% reduction was observed for cases of crystalline silicon and CIGS. Other work was done by (Qasem, Betts, and Gottschalg Citation2013) used the PSPICE software model to investigate the hot-spots formed during the installation of PV cells in different orientations. The proposed model investigated the effects of dust on the spectrum formed due to the energy band-gap in these devices. Its performance of devices fell by 34% in 3 months. The tilting angle of the installed device also affects the rate of dust accumulation on them. It was shown that the risk of hot-spot formation was most in the horizontal orientation.
Major works to address the problems associated with dust accumulation was done in KSA. A review about the dust fouling and effective methods to mitigation its effects presented by Said et al., Citation2018. Performance output is also affected due to higher ambient temperatures, humidity, and loss of rainfall. Electronic Cleaning methods and micro/nanoscale surface treatment methods are effective ways to counterbalance the adverse effects of dust deposition. Analysis of the effects of dried mud on protective transparent covers of PV modules made of polycarbonate wafers and glass installed in the Dhahran area of KSA was done by (Mehmood, Al-Sulaiman, and Yilbas Citation2017). Higher cohesive forces interface between mud and glass made it tougher to remove the mud from the glass substrate. The optimum cleaning time for PV devices vary depending on costs, seasonal variations, and energy production (Jones et al. Citation2016). The cleaning costs were only a smaller fraction of total costs. A 20% fall in transmittance of glass panels due to dust accumulation of 5 g/m was reported by (Said and Walwil Citation2014). These panels were tilted at an angle of 26° for 45 days in the Dhahran area. The anti-reflective coating reduced transmittance much more when compared to non-coated plane glass. The adhesive forces of the flat surface increased with the size of particles and higher humidity. The process of dust removal from a polycarbonate disk and reported that centrifugal force was higher as compared to other forces like adhesive, frictional, drag, lift, and gravitational forces (Rifai et al. Citation2016). The effects of surface texturing and the application of anti-reflective coatings on the glass cover of modules were investigated by (Said, Al-Aqeeli, and Walwil Citation2015). These applications boosted power by an average of 4–8%. The study also confirms that dust accumulation can reduce power output by about 10–17% when exposed for six weeks without cleaning.
The study of (Adinoyi and Said Citation2013) indicated a fall of about 50% in the performance of PV modules installed in eastern parts of KSA. These devices were left unclean for over six months. Characteristics features of panels before and after cleaning were reported by (Al Hanai et al. Citation2011). An increase of 13% in maximum power was noted after cleaning dust, corresponding to a 5.79% increase the efficiency. The summary of various works related to the evaluation of the effects of dust accumulation on the performance of PV modules is presented in .
Table 14. Summary of various works related to dust accumulation in GCC countries
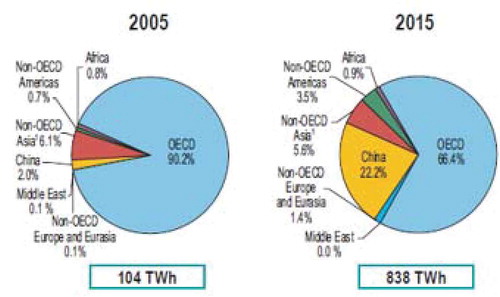
7. Trends in generating electricity via wind energy
The trend of generating electricity by the wind in different regions of the world over the period from 2005 to 2015 showed a significant increase from 104 in 2005 to 838 TWh in the year 2015, as indicated in (Key world energy statistics Citation2017). Also, it is noted from the figure that OECD countries are the most widely used in this technology. Whereas, the participation of each global association in wind energy generation in 2005 and 2015 is provided in (Key world energy statistics Citation2017). That OECD countries are the most widely used 90.2% in the year 2005 and 66.4% in the year 2015 from the total wind electricity production in the world. China was 2.1% in the year 2005 using the technology, while in the year 2015 it was 22.2% percent. It is noticeable from that the participation rate of the Middle East countries is 0.1% in 2005 and 0.0% in 2015. Despite the high solar and wind energy available, they have not yet been used. These figures indicate that it is necessary for the utilization of available solar and wind energy resources in the Middle Zone region, which includes the GCC states (Key world energy statistics Citation2017).
Figure 13. World wind energy production from 2005 to 2015 by region (TWh) 1. Non-OECD excluding china
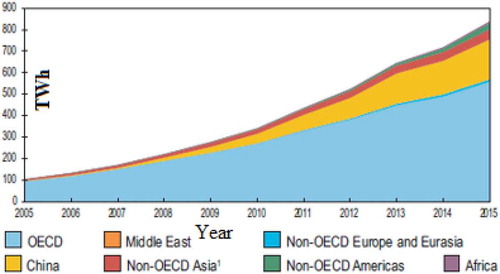
Figure 14. Regional shares of wind electricity production in 2005 and 2015
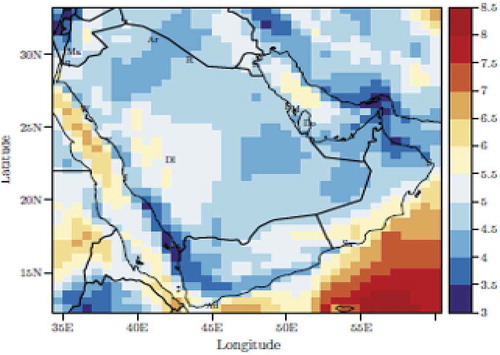
Wind energy is expected to play a major role to meet energy demands in the Middle East which are rising due to the growth of population and industrial growth. The distribution of wind power density in the Middle East region at the height of 50 m from the surface of the earth () Yip, Gunturu, and Stenchikov (Citation2016) was predicted. It can be interpreted from a figure that the energy of wind increased from the northern part to the southern part of KSA. Continuous windy conditions were found along with the coastal areas of the Arabian Gulf. The reason for this data is that latitude decreases in this direction as we move toward the equator. This pays the way for the installation of smaller wind turbines in these regions. A multi-criteria decision-making (MCDM) method that was based on GIS data is shown in for choosing a site for wind farming was studied by (Baseer et al. Citation2017). Based on their survey following three sites; namely, Ras Tanura on the eastern coast, Turaif in Al-Jawf in the north area, and Al-Wajh on the western coastal region were found to be most suitable in the KSA:
Table 15. Methodology for choosing the site of the wind turbine
Figure 15. Wind power density based on the GIS map at a height of 50 m for the GCC region
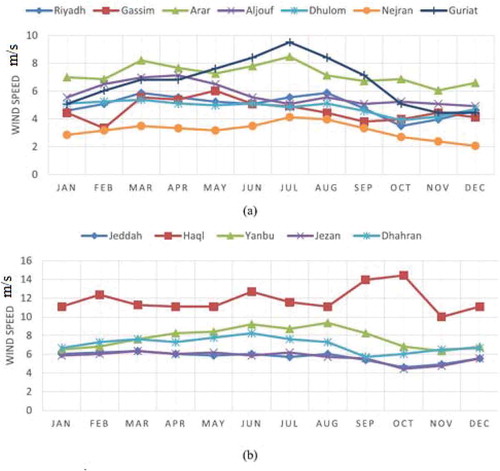
A measured wind data from 12 meteorological stations at 10 m around the KSA used to examine the ability of wind electrical energy generation. These data were used to determine the wind speed at different heights numerically. At 100 m height, the seaside regions have a monthly wind speed of more than 5 m/s while it was in the middle area of KSA in most months higher than 5 m/s except for Nejran, Jazan, and Gassim as shown in (Salah, Abo-khalil, and Praveen Citation2019).
Figure 16. Wind speed at a height of 100 m at investigated locations
A nonlinear program was used by (Benitez, Benitez, and Van Kooten Citation2008) for wind energy to show its economic and environmental effects. The cost of generation using wind turbines was estimated at 37–68 US$ per MWh, with a potential reduction cost of emissions being 41–56 US$/ton. The suitability of distributions of the heterogeneous mixture to identify the most suitable probability distribution of wind speed in UAE was assessed by (Shin, Ouarda, and Lee Citation2016). The Weibull-Extreme value type-one mixture distribution was considered the most appropriate distribution for wind speed data in the UAE. The two 50 story towers in Bahrain are linked via three bridges, each one holding a wind turbine with a 225 kW power capacity. The turbines were installed in April 2008. In Oman, major wind power plants have been installed at sites of Masirah and Saih Al khairat. The installed capacity of these plants is2* 250 kW and 2*2.1 MW respectively . The first wind turbine was installed in 2017 close to the border with Jordan in Turaif, KSA (Commissioning of First Wind Turbine in Turaif).
However, concerning the use of wind energy, certain challenges have been identified. Al-Dousari, Al-Nassar, and Ahmed (Citation2020) mentioned that in certain deserted areas like Kuwait certain issues are encountered which reduce the production of PV energies. These issues are in the form of mud coatings, finely crusted carbonates, due to the presence of dust or fallen aerosols. Considering these issues, substitutional methods of producing energy were suggested. Findings, based on its extensive investigations suggested the use of wind turbines due to their effectiveness in coping with dust particles resulting in increased production of energy.
8. Usefulness of hybrid systems in generating electricity
Potential locations that are ideal for the installation of solar-wind power-based hybrid stations in the Middle-East were analyzed by (Jahangiri et al. Citation2016) using the Boolean model in GIS software. The Boolean method is more versatile; hence, data processed using this methodology from 400 weather stations is more accurate. A hybrid system is where water may be as a medium to store in a reservoir up to a certain height has been proposed. This stored water may be used to generate electricity using a water turbine. Another approach used to extract water is by PV system as reported by (Li et al. Citation2017) However, this method is expensive as electronic controllers are needed.
A hybrid system based on solar PV – diesel technology had much scope in remote areas that were far away from the utility grid (Shaahid and El-Amin Citation2009). Solar radiation data was recorded in the city of Rafha to explore the chances of the installation of such systems. The simulations were done for a 2.5 MWp capacity plant along with 4.5 MW supporting diesel systems. The cost of generating energy was found to be 0.170 US$/kWh. An analysis of hybrid power systems may be used for residential buildings in KSA (Shaahid, Al-Hadhrami, and Rahman Citation2014).
9. Useability of geothermal energy to generate electricity
The application of geothermal energy is very limited in the Gulf region. Note that there is good potential in KSA. It should be noted here that electricity use in the residential sector has decreased from 48% of the total consumption in 2017 to about 44% in 2018. The main reason for this could be raising electricity tariffs by about 360% for the residential sector at begin of 2018. The KSA government has planned to build geothermal energy systems of 1 GW by 2040.
Geothermal energy can be classified into three categories according to depth: deep, medium, and shallow. The geothermal pump (which is related to shallow depth) has limited application in the countries of the Middle East and North Africa to date. Depending on its properties, geothermal energy can be used for heating and cooling or harnessed to generate clean electricity. However, for electricity, there is a need for high or medium temperature thermal energy, which is usually near tectonic active areas. The geothermal utilization process using Ground Heat Exchanger (GHE) provides pre-heating/pre-cooling of the medium before meeting the evaporator in winter or condensed of Air Conditioning (A/C) in summer. This helps the A/C run year-round cooler in hot times, and warmer in cold times, as compared to normal conditions, which makes it more efficient (Aresti, Christodoulides, and Florides Citation2018). The main parameters affecting the Ground Source Heat Pump system (GSHPs) efficiency are the climate, soil, needed place, configurations, size of the system, peak heating/cooling load, and operating conditions. The installation cost also plays a role in making use of this resource. Density kg/m3, thermal conductivity W/m K, and the specific heat capacity kJ/kg K must be identified to predict the thermal characteristics of GHE. Geothermal energy was utilized first in Italy in 1904 (Aresti, Christodoulides, and Florides Citation2018). They overviewed and classified GHE according to sources, factors affecting its design, and how can be used with heat pumps for A/C applications. They reviewed a lot of experimental studies and used analytical, numerical, and computational models that were completed.
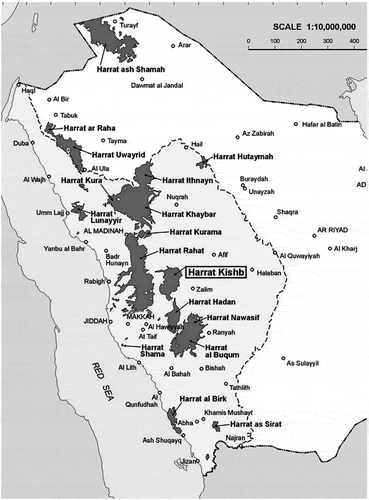
Many studies evaluated the geothermal energy resources in KSA, but a limited number deal with their applications and only a few discussed the use of GHE applications. The geology of the KSA consists of two main parts, the Arabian Shield, which is located in the west of the KSA, and the Arabian Plate, which extends from the center of the KSA to the eastern coast. Some thermal springs can be used to generate electricity; although, none have been used yet. History recorded a volcanic eruption near Medina in 1256 AD The resulting lava fields are called “Harat”. These areas exhibit thermal activity that takes the form of shallow water wells with high temperatures and hot springs with visible steam plumes. Geothermal resources are mostly placed in the western and southwestern of KSA, as shown in .
Figure 17. The geographical layout of Harrats in the KSA
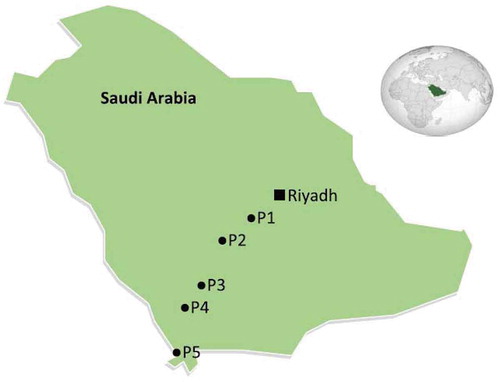
The potential of geothermal energy and its possible applications of it was estimated by (Al-Douri, Waheeb, and Johan Citation2019). The available geothermal resources are two forms in the KSA: hot springs, in Al-Lith and Jazan with surface temperature ranging from 46°C to 95°C, and surface volcanic (known as harrats) (Al-Dayel Citation1988; Lashin, Al Arifi, and Chandrasekharam et al. Citation2015). The annual demand for geothermal energy in KSA was estimated to be 17.847 MWh-26.99 MWh (Hussein et al. Citation2013; Lashin and Al-Arifi Citation2014). Five locations for the heat-flow measurements between Riyadh and the Farasan Islands in the southwest of KSA were assessed by (Gettings Citation1982). At each site, many wells were drilled with a depth of 60 m. They reported that for the first location near Riyadh the mean ground temperature at 60 m depth was 28.5°C, geothermal gradient 8.22–19.80 K/km, and the mean thermal conductivity between 2.6 W/mK near Riyadh and 4.22 W/m.K near Farasan Islands () (Gettings Citation1982). However, the coefficient of thermal conductivity from the five selected locations is summarized in (Gettings Citation1982).
Table 16. Resources in the KSA to verify thermal conductivity
Figure 18. The five sites selected for drilling wells by the ministry of petroleum and mineral
The benefits of utilizing geothermal energy in technical, economic, and environmental terms were reported by (Chandarasekharam, Aref, and Nassir ; Chandreasekharam et al. Citation2015b). They estimated the heat generated by geothermal energy sources varies from about 2 to 134 μW/m(Fattouh, Sen, and Moerenhout Citation2016) and can generate 120 × 106 TWh electricity. The western Saudi Arabian has a potential source of geothermal energy to be used for electricity generation, freshwater generation, and agricultural sector for several decades (Chandreasekharam et al. Citation2015b). The best well-known locations of geothermal energy sources are placed in Al-Lith and Jizan, which can generate about 11 µW/m(Fattouh, Sen, and Moerenhout Citation2016) of thermal energy (Lashin et al. Citation2014). They estimated that a high heat flow value of more than 80 mW/m across Al-Lith coast and the reservoir temperature below this location is more than 200 °C. Geothermal energy has a highly promising source, however, only some small capacity applications are already installed in the last decade (Demirbas Citation2016). They suggested that the geothermal binary power plant can be installed especially by the Red Sea coast in the Jizan Province. The potential, status, resources, sustainability performance, and use possibilities of solar, wind, geothermal, and biomass in KSA were reviewed by (Amran et al. Citation2020). Also, they display the geothermal energy sources’ temperatures in different regions of the KSA. It is noted from the table that there are suitable sites for generating electricity based on ground energy, such as Harrat in western KSA. On the other hand, there are suitable sites that can be used as a source of heat pump for buildings’ air conditioning such as Tabuk and Hail () (Amran et al. Citation2020).
Table 17. Regional distribution of geothermal energy sources
A work for GHE used a hybrid cooling system with radiant night cooling and supports air ventilation via an Air-Ground Heat Exchanger (AGHE) in a building was carried out for Jeddah by (Hijazi and Howieson Citation2018). They studied the effect of tube characteristics, depth of tubes, and airflow rate to the optimum configuration of an AGHE. They report that the carbon footprint of the building can be reduced by more than 80% of the demand for air conditioners. They concluded that the hybrid system predicted a 43% energy demand decrease compared to the baseline building. The soil thermal properties for the use of Vertical Ground Source Heat Pump system (VGSHPs) with a single U-shaped pipe in Dhahran in KSA was investigated by (Sharqawy et al. Citation2009). They determined the weighted thermal conductivity, thermal diffusivity, and total thermal resistance as 2.154 W/m K,6.252x10−6m2/s, and 0.315 m K/W, respectively. A VGSHPs with a U-tube pipe for cooling was examined by (Said et al. Citation2010). They reported that there was a 12°C temperature difference between the ground and the ambient temperature, and the outlet temperature from the ground loop reached 36.5°C. They indicated that the use of VGSHPs could save 28% of energy but not economically due to electricity subsidies in study data and the costs of drilling. The techno-economic aspects of VGSHPs with the conventional A/C systems in KSA conditions were compared by (Alshehri et al. Citation2019). They concluded that the payback period would exceed 15.6 years of the VGSHP and the cost of the energy consumption for the VGSHP is less than 34.6%. A/C loads in the GCC are too high (Berbari). The necessary reasons for using VGSHPs are reducing the power from 1.40 kW/tons down to 0.71 kW/ton and can be reduced to 0.58 kW/ton in some cases, and save fan energy about 0.10 kW/ton. Every 100 m of a tube of VGSHPs was capable of rejecting heat of 1.25 tons (4.4 kW). A project using VGSHPs was installed in Jeddah where they have three intake wells of 10-inch and one release well of 14-inch handling 3 × 400 tons of A/C system.
From the above, it is noted that there are not enough studies on this subject in the KSA and GCC. It is appropriate from an economic point of view, especially after raising the electricity tariff and adopting a policy of removing subsidies from electricity in residential buildings. It is useful to study the performance and application of this technique.
10. Analyzing techno-economic conditions
Reforms in subsidy policies have long been considered as impossible as they have served as a means of proper distribution of resources within citizens in the GCC region. Now, almost all GCC countries are forced to think about reform measures due to the fiscal deficit held through the decrease in oil revenues. In Kuwait, where energy policy has made a much more social impact as compared to the rest of the nations in the GCC, a 42–83% increase in gasoline prices was done in the year 2016. However, citizens received about 75 liters of gasoline-free of charges every month. Subsidy reforms have been covering wide ranges including transport fuels, natural gas, electricity, and a detailed review of these reforms. Nationality is also a deciding factor for electricity and water tariffs in the UAE, Bahrain, and Qatar, as residents pay more tariffs as compared to as expatriates. Setting prices per unit by consumption slab can discourage excessive consumption while keeping low costs for basic consumption needs.
The essential need for planning, grant, and subsidy, allocation and loan distribution, information about tax relief, along collaboration between public and private sectors for development was demonstrated by (Atalay, Kalfagianni, and Pattberg Citation2017). These plans also included options like feed-in tariffs (FIT) and energy auctions. Various models to understand the relationship between electricity consumption, real GDP and CO2 emissions for KSA for 1971–2010 were reported by (Mezghani and Ben Haddad Citation2017). These models included the Time-Varying Parameters Vector Autoregressive (TVP-VAR) model having stochastic volatility. These results concluded that energy policies must be considered for considering various relationships. The impacts of pricing policies on the consumption of electricity in various households were analyzed by (Matar and Anwer Citation2017). The findings of the study concluded that increasing the fuel costs made energy generation using RE technology competitive. In it, various households responded to dynamic pricing by reducing their use that in turn lowered the levels of generation and the use of natural gas in power plants. It highlighted that the energy system benefits could reach nearly US$ 12 billion per year when the electricity prices are increased. Similarly, the households would need to pay an additional US$ 3 billion in electricity costs. The average electricity price paid under the lifeline scenario would be 4.0 cents/kWh which was more manageable when compared to an average marginal-cost price of about 7.1 cents/kWh. They indicated that the consumption of natural gas decreased at higher electricity prices illuminating the possibility of low constraints on the supply of gas.
In 2019, the board of directors of the Electricity and Co-Generation Regulatory Authority (ECRA) approved a regulatory framework for small solar PV systems (PV size >1 kW &<2 MW) in the KSA. (Regulatory framework for small solar PV systems Citation1441) In 2020, the price of electricity produced from these systems has been determined for investors, so that will be 1.9 cents/kWh in the residential sector (about 39% from the national tariff by consumption less than 6000 kWh/month, see ) and 1.3 cents/kWh is for the rest sectors. These definitions are not encouraging investors to benefit from solar energy in the country. The use of solar rooftops in the residential sector in Riyadh was explored by KSA (Lopez-Ruiz, Blazquez, and Vittorio Citation2020). They concluded that PV use in this condition was uneconomic for households. The potential effects of Time-of-use (TOU) pricing on households in KSA were assessed by (Matar Citation2017). Based on this theory, the study found that households would need to pay about 42% – 57% more prices in summers by TOU pricing that was three times more as compared to the average summer price at study time which eventually reduces the electrical loads. It also noted that the consumption of oil for electricity generation reduced, whereas the average operating efficiency increased slightly due to lesser dependence on lesser efficient gas turbines.
Incentives offered by the Saudi government in order to strengthen the basis of the solar industry need to be analyzed in detail which includes financing and substantial tax incentives (Al Yahya and Irfan Citation2016). The RE Project Development Office (REPDO) of KSA’s has started its first solar PV project in Sakaka. The development of the 300 MW Sakaka solar PV project needs an investment of about US$ 300 million and will create 400 job opportunities (Saudi Arabia Awards First NREP Solar Project). The environmental and health effects, the economics of solar energy, and forecasting of loads in KSA were discussed by (Abu-Hamdeh and Alnefaie Citation2018).
11. Interest in EE and RE
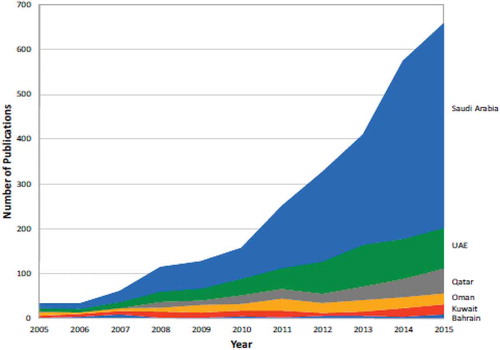
The current study presented a review of recent researches in the case of EE, solar energy, and wind energy, and geothermal energy in GCC countries. The analysis revealed that their interest in the EE field is escalating given its technology which is comparatively cheaper than any other energy source. However, to create more awareness about opportunities and goals associated with the use, consumption, and generating energy through the RE systems in GCC certain important measures have been undertaken. For instance; KSA has established two world-class research centers in King Fahd University of petroleum studies and King Saud University. Responses from a group of 122 subjects on awareness of sustainability in KSA were recorded by (Alrashed and Asif Citation2015). The group included a full range of subjects like managers, construction workers, architects, engineers, developers, and investors. Results show that the building industry has yet to realize the importance of sustainability in designs. Higher levels of education and experience were reported to influence awareness about sustainability positively. (Alrashed and Asif (Citation2015) Scopus database about research about solar energy in the GCC showed that KSA had the highest contributions of more than 60% followed by the UAE () (Akash et al. Citation2016).
Figure 19. Publication record on solar relate technology
Similarly, the Rural Area Electricity Company (RAECO) of Oman is planning to install hybrid energy systems to meet its energy demand. Also, there has been an increased interest in sustainable energy programs in UAE with Rooftop solar PV as one of the most attractive options available. Bahrain plans to work in 7 key areas for developing its renewable sector as part of the National Energy Efficiency Action Plan. (Saudi Aramco and GE deliver the first wind turbine in the Kingdom of Saudi Arabia Citation2018). While, in Qatar, the government has funded a large, cost-effective retrofit program that can be used for existing building stocks. Vision 2030 of the Saudi government aims at transforming the nation’s oil-dependent economy into a more sustainable one. GCC countries can cooperate in order to implement a plan to take advantage of RE resources. It is also possible to benefit from the experiences of some countries in the programs benefiting from RE, especially South Africa, (Jurgenson, Bayyari, and Parker Citation2016) which has implemented large projects in this area. The installed capacities of RE sources of major economies of the world in the year 2014 have been reported (Senshaw and Kim Citation2018). The analysis indicated Germany as the one with the highest installed capacity of about 40 GW per annum. Other Asian nations like China and India are also taking initiatives in this area in order to meet their targets for energy demand while simultaneously ensure compliance with various environmental legislation and contribute to their social-economic developments. KSA launched a comprehensive Vision 2030 in 2016 with the aim of gradual liberalization of the fuels market (Vision Realization Citation2016). Neighboring states of Oman and Bahrain followed suit a couple of weeks later, hiking both petrol and diesel prices. Later, the UAE and Qatar linked their transport fuel prices to international market prices. Overall a price rise of 30–200% has been observed in fuel prices. All these factors have renewed the interest of the GCC region in areas of RE and EE.
12. Conclusion and recommendations
It is worth mentioning that the developments in the RE sector in the GCC region would result in multiple benefits across the region. GCC nations have set a target of generating about 80 GW of power using capacities by the year 2030. The RE sector has the potential to create jobs for a massive portion of the population across the GCC region, resulting in sufficient gains in terms of new employment opportunities, fuel savings, and emission reduction. Based on the analysis, the following recommendations are made for decision-makers and energy professionals:
Spread the culture of EE concepts and benefit from RE more widely.
Establish vocational and university training programs on these subjects in all universities and introductory courses for students of the faculties of architecture, science, agriculture, and others.
Issuing clear legislation and laws to help the private sector participation in RE applications.
Establish a clear and easy government mechanism to implement financial support for EE and RE projects.
Implement pilot projects and undertake studies to address the difficulties that may arise during work.
Focus on thermal and electrical solar applications for refrigeration and air conditioning.
Preparation of publications and manuals for the installation of solar home systems.
Produce a local standard for solar thermal systems.
Application of variable power consumption by peak time.
Transforming government support for traditional energy sources into EE and RE sources.
Finally, we hope that this study will help in spreading awareness about EE and applications of renewable resources of energy in the GCC region and world because of its importance in terms of social, economic, and environmental.
Conflicts of interest
The authors declare no conflict of interest.
Acknowledgments
The authors are very thankful to all the associated personnel in any reference that contributed to/for this research.
Additional information
Funding
References
- Abdmouleh, Z., R. A. Alammari, and A. Gastli. 2010. Recommendations on renewable energy policies for the GCC countries. Renewable and Sustainable Energy Reviews 50:1181–91. doi:https://doi.org/10.1016/j.rser.2015.05.057.
- Abdmouleh, Z., A., Gastli, and L. Ben-Brahim. 2018. Survey about public perception regarding smart grid, energy efficiency & renewable energies applications in Qatar. Renewable and Sustainable Energy Reviews. 82: 168–175.
- Abdul Mujeebu, M., and O. S. Alshamrani. 2015. A Review of Solar Energy Exploration and Utilization in Saudi Buildings. International Journal of Advanced Thermofluid Research 1(1).
- Abdul Mujeebu, M., and O. S. Alshamrani. 2016. Prospects of energy conservation and management in buildings – The Saudi Arabian scenario versus global trends. Renewable and Sustainable Energy Reviews 58:1647–63. doi:https://doi.org/10.1016/j.rser.2015.12.327.
- Abd-ur -rehman, H. M., and F. A. Al-Sulaiman. 2016. Optimum selection of solar water heating (SWH) systems based on their comparative techno-economic feasibility study for the domestic sector of Saudi Arabia. Renewable and Sustainable Energy Reviews 62:336–49. doi:https://doi.org/10.1016/j.rser.2016.04.047.
- Abu-Hamdeh, N., and K. Alnefaie. 2018. Techno-economic comparison of solar power tower system/photovoltaic system/wind turbine/diesel generator in supplying electrical energy to small loads. Journal of Taibah University for Science 13 (1):216–24. doi:https://doi.org/10.1080/16583655.2018.1556916.
- Adinoyi, M. J., and S. A. M. Said. 2013. Effect of dust accumulation on the power outputs of solar photovoltaic modules. Renewable Energy 60:633–36. doi:https://doi.org/10.1016/j.renene.2013.06.014.
- Afshari, A., and L. Friedrich. 2016. A proposal to introduce tradable energy savings certificates in the emirate of Abu Dhabi. Renewable and Sustainable Energy Reviews 55:1342–51. doi:https://doi.org/10.1016/j.rser.2015.05.086.
- Akash, B., et al. “Scopus-based Analysis of Peer-Reviewed Literature Related to Solar Energy in GCC Countries,” Procedia Comput Sci 83, 750–757 (2016). doi:https://doi.org/10.1016/j.procs.2016.04.163
- Al Hanai, T., et al. “Environmental effects on a grid connected 900 W photovoltaic thin-film amorphous silicon system,” Renew Energy 36, 2615–2622 (2011). doi:https://doi.org/10.1016/j.renene.2010.06.010
- Al Masdar, I. Dubai electrcity and water authority, www.dewa.gov.ae.
- Alaidroos, A., and M. Krarti. 2015. Optimal design of residential building envelope systems in the Kingdom of Saudi Arabia. Energy and Build 86:104–17. doi:https://doi.org/10.1016/j.enbuild.2014.09.083.
- Alasseri, R., T. J. Rao, and K. J. Sreekanth. 2018. Conceptual framework for introducing incentive-based demand response programs for retail electricity markets. Energy Strategy Reviews 19:44–62. doi:https://doi.org/10.1016/j.esr.2017.12.001.
- Al-Dayel, M. 1988. Geothermal resources in Saudi Arabia. Geothermics 17 (2–3):465–76. doi:https://doi.org/10.1016/0375-6505(88)90076-4.
- Aldossary, N. A., “Application of Urban sustainable design strategies for development and rehabilitation of Al-Qahad heritage village,” Future Cities and Environment 4 (2018).
- Al-Douri, Y., S. A. Waheeb, and M. R. Johan. 2019. Exploiting of geothermal energy reserve and potential in Saudi Arabia: A case study at Ain Al Harrah. Energy Reports 5:632–38. doi:https://doi.org/10.1016/j.egyr.2019.05.005.
- Al-Dousari, A., W. Al-Nassar, and M. Ahmed,“Photovoltaic and wind energy: Challenges and solutions in desert regions,” InE3S Web of Conferences 166, 04003 (2020). EDP Sciences.
- AlEmadi Solar. 2012. Harvesting the future energy today. http://www.alemadisolar.com/en/Downloads/Catalog-soft.pdffor
- Alghamdi, A., A. Bahaj, and Y. Wu. 2017. Assessment of large scale photovoltaic power generation from carport canopies. Energies 10 (5):686. doi:https://doi.org/10.3390/en10050686.
- Ali, A. H. H., H. A. S. Zeid, and H. M. G. AlFadhli. 2017. Energy performance, environmental impact, and cost assessments of a photovoltaic plant under Kuwait climate condition. Sustainable Energy Technologies and Assessments 22:25–33. doi:https://doi.org/10.1016/j.seta.2017.05.008.
- Al-Maamary, H. M. S., H. A. Kazem, and M. T. Chaichan. 2017. The impact of oil price fluctuations on common renewable energies in GCC countries. Renewable and Sustainable Energy Reviews 75:989–1007. doi:https://doi.org/10.1016/j.rser.2016.11.079.
- Al-Maghalseh, M. 2018. Experimental study to investigate the effect of dust.; Wind speed and temperature on the PV module performance. Jordan Journal of Mechanical & Industrial Engineering 12:1–7.
- Almarshoud, A. F. 2016. Performance of solar resources in Saudi Arabia. Renewable and Sustainable Energy Reviews 66:694–701. doi:https://doi.org/10.1016/j.rser.2016.08.040.
- Almarshoud, A. F., and E. Adam. 2018. Towards VLS-PV deployment in Saudi Arabia: Challenges, opportunities and recommendations. Energy Policy 114:422–30. doi:https://doi.org/10.1016/j.enpol.2017.12.024.
- Almasri, R. A., and A. F. Almarshoud. 2016.Technical and economic performance of thermosiphon flat plate solar water heaters in Saudi Arabia. Transactions on Engineering and Sciences 4(4):16.
- Almasri, R. A., and A. F. Almarshoud. 2017. Feasibility of using evacuated tube solar water heaters in Saudi Arabia. EJAET 4:232–41.
- Al-Mogbel, A.,et al., “The potential of solar adsorption air-conditioning in Saudi Arabia: A simulation study,” In Fifth International Conference Solar Air-Conditioning.; Bad Krozingen, Germany, 25–27 (2013). doi: https://doi.org/10.1115/1.4041159
- Alnaser, N. W. 2018. First smart 8.64 kW BIPV in a building in Awali Town at Kingdom of Bahrain. Renewable and Sustainable Energy Reviews 82:205–14. doi:https://doi.org/10.1016/j.rser.2017.09.041.
- Alnaser, W. E., and N. W. Alnaser. 2011. The status of renewable energy in the GCC countries. Renewable and Sustainable Energy Reviews 15 (6):3074–98. doi:https://doi.org/10.1016/j.rser.2011.03.021.
- Alrashed, F., and M. Asif. 2015. An exploratory of residents’ views towards applying renewable energy systems in Saudi Dwellings. Energy Procedia 75:1341–47. doi:https://doi.org/10.1016/j.egypro.2015.07.207.
- Alsayegh, O., N. Saker, and A. Alqattan. 2018. Integrating sustainable energy strategy with the second development plan of Kuwait. Renewable and Sustainable Energy Reviews 82:3430–40. doi:https://doi.org/10.1016/j.rser.2017.10.048.
- Alshehri, F. et al. “Techno-economic analysis of ground and air source heat pumps in hot dry climates,” Journal of Building Engineering 26, 100825 (2019). doi:https://doi.org/10.1016/j.jobe.2019.100825
- Al-Waeli, A. H. A., et al. “Photovoltaic/Thermal (PV/T) systems: Status and future prospects,” Renewable and Sustainable Energy Reviews 77, 109–130 (2017). doi:https://doi.org/10.1016/j.rser.2017.03.126
- Alyahya, S., and M. A. Irfan. 2016. Role of Saudi universities in achieving the solar potential 2030 target. Energy Policy 91:325–28. doi:https://doi.org/10.1016/j.enpol.2016.01.019.
- AlYahya, S., and M. A. Irfan. 2016. The techno-economic potential of Saudi Arabia׳s solar industry. Renewable and Sustainable Energy Reviews 55:697–702. doi:https://doi.org/10.1016/j.rser.2015.11.017.
- Ameer, B., and M. Krarti. 2016. Impact of subsidization on high energy performance designs for Kuwaiti residential buildings. Energy and Buildings 116:249–62. doi:https://doi.org/10.1016/j.enbuild.2016.01.018.
- Amran, Y. A., et al. 2020. Renewable and sustainable energy production in Saudi Arabia according to Saudi Vision 2030; Current status and future prospects. Journal of Cleaner Production 247:119602. doi:https://doi.org/10.1016/j.jclepro.2019.119602.
- Ang, B. W. 2006. Monitoring changes in economy-wide energy efficiency: From energy–GDP ratio to composite efficiency index. Energy Policy 34 (5):574–82. doi:https://doi.org/10.1016/j.enpol.2005.11.011.
- Aresti, L., P. Christodoulides, and G. Florides. 2018. A review of the design aspects of ground heat exchangers. Renewable and Sustainable Energy Reviews 92:757–73. doi:https://doi.org/10.1016/j.rser.2018.04.053.
- Asif, M. 2016. Growth and sustainability trends in the buildings sector in the GCC region with particular reference to the KSA and UAE. Renewable and Sustainable Energy Reviews 55:1267–73. doi:https://doi.org/10.1016/j.rser.2015.05.042.
- Atalay, Y., A. Kalfagianni, and P. Pattberg. 2017. renewable energy support mechanisms in the Gulf Cooperation Council states: Analyzing the feasibility of feed-in tariffs and auction mechanisms. Renewable and Sustainable Energy Reviews 72:723–33. doi:https://doi.org/10.1016/j.rser.2017.01.103.
- Atalay, Y., F. Biermann, and A. Kalfagianni. 2016. Adoption of renewable energy technologies in oil-rich countries: Explaining policy variation in the Gulf Cooperation Council states. Renewable Energy 85:206–14. doi:https://doi.org/10.1016/j.renene.2015.06.045.
- Atalla, T. N., and L. C. Hunt. 2016. Modelling residential electricity demand in the GCC countries. Energy Economics 59:149–58. doi:https://doi.org/10.1016/j.eneco.2016.07.027.
- Ayoub, N.,et al. 2014. Energy consumption and conservation practices in Qatar—A case study of a hotel building. Energy and Buildings 84:55–69. doi:https://doi.org/10.1016/j.enbuild.2014.07.050.
- Bahrain plans 7 key renewable energy initiatives:2018, http://www.gulf-insider.com/bahrain-plans-7-key-renewable-energy-initiatives.
- Baseer, M. A.,et al. 2017. GIS-based site suitability analysis for wind farm development in Saudi Arabia. Energy 141:1166–76. doi:https://doi.org/10.1016/j.energy.2017.10.016.
- Bayram, I. S., F. Saffouri, and M. Koc. 2018. Generation, analysis, and applications of high resolution electricity load profiles in Qatar. Journal of Cleaner Production 183:527–43. doi:https://doi.org/10.1016/j.jclepro.2018.02.084.
- Benitez, L. E., P. C. Benitez, and G. C. Van Kooten. 2008. The economics of wind power with energy storage. Energy Economics 30 (4):1973–89. doi:https://doi.org/10.1016/j.eneco.2007.01.017.
- Berbari, G. J., see: https://www.constructionweekonline.com article-44253-is-it-time-for-geothermal-air-conditioning-in-gcc for Is it time for geothermal air conditioning in GCC? (accessed 20 November 2020)
- Bou-Rabee, M.,et al. 2017. Using artificial neural networks to estimate solar radiation in Kuwait. Renewable and Sustainable Energy Reviews 72:434–38. doi:https://doi.org/10.1016/j.rser.2017.01.013.
- Cabrera, E.,et al., “AtaMoS TeC Project: Soiling impact on bifacial modules with different mounting geometry in the atacama desert in Chile,” 2018 IEEE 7th World Conference on Photovoltaic Energy Conversion (WCPEC) (A Joint Conference of 45th IEEE PVSC, 28th PVSEC & 34th EU PVSEC) (2018). Waikoloa, HI, USA. doi: https://doi.org/10.1109/PVSC.2018.8547697
- Cen, Z., P. Kubiak, C. M. López, and I. Belharouak. 2018. Demonstration study of hybrid solar power generation/storage micro-grid system under Qatar climate conditions. Solar Energy Materials and Solar Cells 180:280–88. doi:https://doi.org/10.1016/j.solmat.2017.06.053.
- Chandreasekharam, D.,et al. 2015b. Geothermal energy resources of Jizan, SW Saudi Arabia. Journal of African Earth Sciences 109:55–67. doi:https://doi.org/10.1016/j.jafrearsci.2015.05.016.
- Charabi, Y., and A. Gastli. 2013. Integration of temperature and dust effects in siting large PV power plant in hot arid area. Renewable Energy 57:635–44. doi:https://doi.org/10.1016/j.renene.2013.02.031.
- Commissioning of First Wind Turbine in Turaif, http://www.saudiaramco.com/en/home/news-media/news/first-wind-turbine.html. (accessed 20 April 2020)
- Concentrated Solar power (CSP) Project, https://www.nrel.gov/csp/solarpaces/. (accessed 2 April 2021)
- Costa, S. C. S., A. S. A. C. Diniz, and L. L. Kazmerski. 2018. Solar energy dust and soiling R&D progress: Literature review update for 2016. Renewable and Sustainable Energy Reviews 82:2504–36. doi:https://doi.org/10.1016/j.rser.2017.09.015.
- Dehwah, A. H. A., M. Asif, and M. T. Rahman. 2018. Prospects of PV application in unregulated building rooftops in developing countries: A perspective from Saudi Arabia. Energy and Build 171:76–87. doi:https://doi.org/10.1016/j.enbuild.2018.04.001.
- Demirbas, A. 2016. Potential of geothermal energy in the Kingdom of Saudi Arabia. energy sources. Part A: Recovery, Utilization, and Environmental Effects 38:2238–43.
- Demirbas, A.,et al. 2017. renewable energy resource facilities in the Kingdom of Saudi Arabia: Prospects, social and political challenges. Energy Sources, Part B: Economics, Planning, and Policy 12(1):8–16. Part B12. doi:https://doi.org/10.1080/15567249.2014.996303.
- El-Sharkawy, I. I., H. AbdelMeguid, and B. B. Saha. 2014. Potential application of solar powered adsorption cooling systems in the Middle East. Applied Energy 126:235–45. doi:https://doi.org/10.1016/j.apenergy.2014.03.092.
- Fattouh, B., A. Sen, and T. Moerenhout, Striking the right balance? GCC energy pricing reforms in a low-Price environment, (Oxford Institute for Energy Studies, Oxford 2016). https://doi.org
- Ferroukhi, R.,et al. 2013. renewable energy in the GCC: Status and challenges. International Journal of Energy Sector Management 7:84–112. doi:https://doi.org/10.1108/17506221311316498.
- Friess, W. A., and K. Rakhshan. 2017. A review of passive envelope measures for improved building energy efficiency in the UAE. Renewable and Sustainable Energy Reviews 72:485–96. doi:https://doi.org/10.1016/j.rser.2017.01.026.
- Gettings, M. E., “Heat-flow measurements at shot points along the 1978 Saudi Arabian seismic deep-refraction line, part 2: Discussion and interpretation, U.S. Geological Survey Open-File Report,” 82-794. https://pubs.usgs.gov/of/1982/0794/report.pdf. 1982. p. 43.
- Ghaith, F. A., and -H.-H. Razzaq. 2017. Performance of solar powered cooling system using Parabolic Trough Collector in UAE. Sustainable Energy Technologies and Assessments 23:21–32. doi:https://doi.org/10.1016/j.seta.2017.08.005.
- Giusti, L., and M. Almoosawi. 2017. Impact of building characteristics and occupants’ behaviour on the electricity consumption of households in Abu Dhabi (UAE). Energy and Buildings 151:534–47. doi:https://doi.org/10.1016/j.enbuild.2017.07.019.
- Griffiths, S. 2017. A review and assessment of energy policy in the Middle East and North Africa region. Energy Policy 102:249–69. doi:https://doi.org/10.1016/j.enpol.2016.12.023.
- Griffiths, S., and R. Mills. 2016. Potential of rooftop solar photovoltaics in the energy system evolution of the United Arab Emirates. Energy Strategy Reviews 9:1–7. doi:https://doi.org/10.1016/j.esr.2015.11.001.
- Hadjipanayi, M., I. Koumparou, N. Philippou, V. Paraskeva, A. Phinikarides, G. Makrides, V. Efthymiou, and G. E. Georghiou. 2016. Prospects of photovoltaics in southern European, Mediterranean and Middle East regions. Renewable Energy 92:58–74. doi:https://doi.org/10.1016/j.renene.2016.01.096.
- Hasan, A., H. Alnoman, and A. Shah. 2016. Energy efficiency enhancement of photovoltaics by Phase change materials through thermal energy recovery. Energies 9 (10):782. doi:https://doi.org/10.3390/en9100782.
- Hijazi, J., and S. Howieson. 2018. Displacing air conditioning in Kingdom of Saudi Arabia: An evaluation of ‘fabric first’ design integrated with hybrid night radiant and ground pipe cooling systems. Building Services Engineering Research & Technology 39 (4):377–90. (2018).doi:https://doi.org/10.1177/0143624417753923.
- Hussein, M. T.,et al. 2013. Geothermal power potential at the western coastal part of Saudi Arabia. Renewable and Sustainable Energy Reviews 26:668–84. doi:https://doi.org/10.1016/j.rser.2013.05.073.
- Ibarra, M.,et al. Parabolic trough collector power plant performance simulation for an interactive solar energy Atlas of Saudi Arabia. 2016. doi: https://doi.org/10.1063/1.4949250.
- Jacobson, Z., M. A. Delucchi, Z. A. F. Bauer, S. C. Goodman, W. E. Chapman, M. A. Cameron, C. Bozonnat, L. Chobadi, H. A. Clonts, P. Enevoldsen, et al. 2017. 100% clean and renewable wind, water, and sunlight all-sector energy roadmaps for 139 countries of the world. Joule 1 (1):108–21. doi:https://doi.org/10.1016/j.joule.2017.07.005.
- Jahangiri, M.,et al. 2016. Finding the best locations for establishment of solar-wind power stations in Middle-East using GIS: A review. Renewable and Sustainable Energy Reviews 66:38–52. doi:https://doi.org/10.1016/j.rser.2016.07.069.
- Jamil, M., F. Ahmad, and Y. J. Jeon. 2016. renewable energy technologies adopted by the UAE: Prospects and challenges – A comprehensive overview. Renewable and Sustainable Energy Reviews 55:1181–94. doi:https://doi.org/10.1016/j.rser.2015.05.087.
- Javed, W.,et al. 2017. Characterization of dust accumulated on photovoltaic panels in Doha, Qatar. Solar Energy 142:123–35. doi:https://doi.org/10.1016/j.solener.2016.11.053.
- Jones, R. K.,et al. 2016. Optimized cleaning cost and schedule based on observed soiling conditions for photovoltaic plants in central Saudi Arabia. IEEE Journal of Photovoltaics 6 (3):730–38. doi:https://doi.org/10.1109/JPHOTOV.2016.2535308.
- Juaidi, A.,et al. 2016. An overview of energy balance compared to sustainable energy in United Arab Emirates. Renewable and Sustainable Energy Reviews 55:1195–209. doi:https://doi.org/10.1016/j.rser.2015.07.024.
- Jurgenson, S., F. M. Bayyari, and J. Parker. 2016. A comprehensive renewable energy program for Saudi Vision 2030. Renewable Energy Focus 17 (5):182–83. doi:https://doi.org/10.1016/j.ref.2016.08.006.
- KAPSARC. 2016. Opportunities and challenges in reforming energy prices in Gulf Cooperation Council countries, in KS-1629-WB028A. 20. https://www.kapsarc.org/wp-content/uploads/2016/06/KS-1629-WB028A-Opportunities-and-Challenges-in-Reforming-Energy-Prices-in-GCC-Countries.pdf
- Kazem, H. A.,et al. 2017. Techno-economic feasibility analysis of 1 MW photovoltaic grid connected system in Oman. Case Studies in Thermal Engineering 10:131–41. doi:https://doi.org/10.1016/j.csite.2017.05.008.
- Kazem, H. A., and M. T. Chaichan. 2016. Experimental analysis of the effect of dust’s physical properties on photovoltaic modules in Northern Oman. Solar Energy 139:68–80. doi:https://doi.org/10.1016/j.solener.2016.09.019.
- Key world energy statistics, http://www.iea.org/statistics forInternational Energy Agency, Secure Sustainable Together 2017.
- Kharseh, M., M. Al-Khawaja, and F. Hassani. 2015. Comparison between different measures to reduce cooling requirements of residential building in cooling-dominated environment. Energy and Build 88:409–12. doi:https://doi.org/10.1016/j.enbuild.2014.12.019.
- Krane, J., and S. Y. Hung. 2016. Energy subsidy reform in the persian Gulf: The end of the big oil giveaway. https://www.bakerinstitute.org/files/10489/
- Krarti, M. 2017. Economic analysis of energy projects. Energy-Efficient Electrical Systems for Buildings 285–324. https://www.intechopen.com/books/energy-efficient-buildings/energy-efficient-building-design-in-the-context-of-building-life-cycle
- Krarti, M.et al. 2017. Macro-economic benefit analysis of large scale building energy efficiency programs in Qatar. International Journal of Sustainable Built Environment 6 (2):597–609. doi:https://doi.org/10.1016/j.ijsbe.2017.12.006.
- Krarti, M., K. Dubey, and N. Howarth. 2017. Evaluation of building energy efficiency investment options for the Kingdom of Saudi Arabia. Energy 134:595–610. doi:https://doi.org/10.1016/j.energy.2017.05.084.
- Lahn, G., and F. Preston. 2013. Targets to promote energy savings in the Gulf Cooperation Council states. Energy Strategy Reviews 2 (1):19–30. doi:https://doi.org/10.1016/j.esr.2013.03.003.
- Lahn, G. 2018 https://www.chathamhouse.org/sites/files/chathamhouse/publications/research/Food%20Fuel%20and%20Utilities%20Price%20Reforms%20in%20the%20GCC%20A%20Wake-up%20Call%20for%20Business.pdf for Fuel, Food and utilities price reforms in the GCC: A wake-up call for business. Royal Institute of International Affairs, London. 1–28
- Lari, M. O., and A. Z. Sahin. 2017. Design, performance and economic analysis of a nanofluid-based photovoltaic/thermal system for residential applications. Energy Conversion and Management 149:467–84. doi:https://doi.org/10.1016/j.enconman.2017.07.045.
- Lashin, A.,et al. 2014. Geothermal energy resources of wadi Al-Lith, Saudi Arabia. Journal of African Earth Sciences 97:357–67. doi:https://doi.org/10.1016/j.jafrearsci.2014.05.016.
- Lashin, A.,et al., “Geothermal energy resources of Saudi Arabia: Country update,” in Proceedings World Geothermal Congress. Melbourne, Australia (2015). doi: https://doi.org/10.1016/j.jafrearsci.2014.05.016
- Lashin, A., and N. Al-Arifi. 2014. Geothermal energy potential of southwestern of Saudi Arabia “exploration and possible power generation” : A case study at Al Khouba area – Jizan. Renewable and Sustainable Energy Reviews 30:771–89. doi:https://doi.org/10.1016/j.rser.2013.10.037.
- Lešnik, M., V. Žegarac Leskovar, and M. Premrov. 2019. Scientific research related to building renovation. Int J Green Energy 69–159.ISBN 978-3-030-11476-3
- Li, G.,et al. 2017. Research and current status of the solar photovoltaic water pumping system – A review. Renewable and Sustainable Energy Reviews 79:440–58. doi:https://doi.org/10.1016/j.rser.2017.05.055.
- Lim, X. Y., D. C. Y. Foo, and R. R. Tan. 2018. Pinch analysis for the planning of power generation sector in the United Arab Emirates: A climate-energy-water nexus study. Journal of Cleaner Production 180:11–19. doi:https://doi.org/10.1016/j.jclepro.2018.01.158.
- Lopez-Ruiz, H. G., J. Blazquez, and M. Vittorio. 2020. Assessing residential solar rooftop potential in Saudi Arabia using nighttime satellite images: A study for the city of Riyadh. Energy Policy 140:111399. doi:https://doi.org/10.1016/j.enpol.2020.111399.
- Lude, S.,et al. 2015. Optimization of the technology Mix for the Shagaya 2 GW renewable energy Park in Kuwait. Energy Procedia 69:1633–42. doi:https://doi.org/10.1016/j.egypro.2015.03.120.
- Mahalik, M. K., M. S. Babu, N. Loganathan, and M. Shahbaz. 2017. Does financial development intensify energy consumption in Saudi Arabia? Renewable and Sustainable Energy Reviews 75:1022–34. doi:https://doi.org/10.1016/j.rser.2016.11.081.
- Martín-Pomares, L.,et al.Analysis of the long-term solar potential for electricity generation in Qatar. Renewable and Sustainable Energy Reviews 73:1231–46.2017.doi: https://doi.org/10.1016/j.rser.2017.01.125.
- Mas’ud, A.,et al. Solar energy potentials and benefits in the Gulf Cooperation Council Countries: A review of substantial issues. Energies 11:372.2018.doi: https://doi.org/10.3390/en11020372.2
- Matar, W. 2015. Beyond the end-consumer: How would improvements in residential energy efficiency affect the power sector in Saudi Arabia? Energy Effic 9 (3):771–90. doi:https://doi.org/10.1007/s12053-015-9392-9.
- Matar, W. 2017. A look at the response of households to time-of-use electricity pricing in Saudi Arabia and its impact on the wider economy. Energy Strategy Reviews 16:13–23. doi:https://doi.org/10.1016/j.esr.2017.02.002.
- Matar, W.,et al. 2017. Efficient industrial energy use: The first step in transitioning Saudi Arabia’s energy mix. Energy Policy 105:80–92. doi:https://doi.org/10.1016/j.enpol.2017.02.029.
- Matar, W., and M. Anwer. 2017. Jointly reforming the prices of industrial fuels and residential electricity in Saudi Arabia. Energy Policy 109:747–56. doi:https://doi.org/10.1016/j.enpol.2017.07.060.
- Mehmood, U., F. A. Al-Sulaiman, and B. S. Yilbas. 2017. Characterization of dust collected from PV modules in the area of Dhahran, Kingdom of Saudi Arabia, and its impact on protective transparent covers for photovoltaic applications. Solar Energy 141:203–09. doi:https://doi.org/10.1016/j.solener.2016.11.051.
- Mezghani, I., and H. Ben Haddad. 2017. Energy consumption and economic growth: An empirical study of the electricity consumption in Saudi Arabia. Renewable and Sustainable Energy Reviews 75:145–56. doi:https://doi.org/10.1016/j.rser.2016.10.058.
- Mikayilov, J. I., M. Galeotti, and F. J. Hasanov. 2018. The impact of economic growth on CO2 emissions in Azerbaijan. Journal of Cleaner Production 197:1558–72. doi:https://doi.org/10.1016/j.jclepro.2018.06.269.
- Mugnier, D., U. Jakob, and P. Kohlenbach, “Assessment on the Commercial Viability of solar cooling technologies and applications in the Arab Region,” United Nations Environment Programme, Nairobi, Kenya 79 (2016).
- Munawwar, S., and H. Ghedira. 2014. A review of renewable energy and Solar Industry Growth in the GCC Region. Energy Procedia 57:3191–202. doi:https://doi.org/10.1016/j.egypro.2015.06.069.
- Nematollahi, O.,et al. 2016. Energy demands and renewable energy resources in the Middle East. Renewable and Sustainable Energy Reviews 1:1172–81. doi:https://doi.org/10.1016/j.rser.2015.10.058.
- Niamir, L., T. Filatova, A. Voinov, and H. Bressers. 2018. Transition to low-carbon economy: Assessing cumulative impacts of individual behavioral changes. Energy Policy 118:325–45. doi:https://doi.org/10.1016/j.enpol.2018.03.045.
- Oxford Energy Org. 2016 https://www.oxfordenergy.org/wpcms/wp-content/uploads/2016/04/Striking-the-Right-Balance-GCC-Energy-Pricing-Reforms-in-a-Low-Price-Environment.pdf, Striking-the-Right-Balance-GCC-Energy-Pricing-Reforms-in-a-Low-Price-Environment.
- Papadopoulou, A.,et al., “Tools and Mechanisms Fostering EU GCC Cooperation on Energy Efficiency,” Proceedings of the World renewable energy Congress – Sweden, 8–13 May 2011, Linköping, Sweden ( 2011).
- Pillai, G., and H. A. Y. Naser. 2018. Techno-economic potential of largescale photovoltaics in Bahrain. Sustainable Energy Technologies and Assessments 27:40–45. doi:https://doi.org/10.1016/j.seta.2018.03.003.
- Pillai, G., and H. Y. Naser. 2017. Assessing the technical impact of integrating largescale photovoltaics to the electrical power network of Bahrain. Sustainable Energy Technologies and Assessments 20:78–87. doi:https://doi.org/10.1016/j.seta.2017.02.019.
- Qasem, H.,et al. 2012. Dust-induced shading on photovoltaic modules. Progress in Photovoltaics: Research and Applications 22 (2):218–26. doi:https://doi.org/10.1002/pip.2230.
- Qasem, H., T. R. Betts, and R. Gottschalg. 2013. Spatially-resolved modelling of dust effect on cadmium telluride photovoltaic modules. Solar Energy 90:154–63. doi:https://doi.org/10.1016/j.solener.2013.01.013.
- Rabia Ferroukhi, F. Renewable Energy Market Analysis: GCC (2019). Retrieved from: https://www.irena.org/-/media/Files/IRENA/Agency/Publication/2019/Jan/IRENA_Market_Analysis_GCC_2019.pdf. 2019. p. 154.
- Ramli, M.A.M., S. Twaha, and Z. Al-Hamouz. 2017. Analyzing the potential and progress of distributed generation applications in Saudi Arabia: The case of solar and wind resources. Renewable and sustainable energy reviews. 70: 287–297.
- Regulatory framework for small solar PV systems (PV size >1 kW &<2 MW) by Resolution No. (2/47/41) dated 29/April/1441. Retrieved from: https://www.ecra.gov.sa/ar-sa/ECRARegulations/Regulations/Documents/SolarReg.pdf.
- Rehman, S.,et al. 2017. Feasibility study of the grid connected 10 MW installed capacity PV power plants in Saudi Arabia. Renewable and Sustainable Energy Reviews 80:319–29. doi:https://doi.org/10.1016/j.rser.2017.05.218.
- Reiche, D. 2010. Energy Policies of Gulf Cooperation Council (GCC) countries—possibilities and limitations of ecological modernization in rentier states. Energy Policy 38 (5):2395–403. doi:https://doi.org/10.1016/j.enpol.2009.12.031.
- Renewables Information: Overview see:. www.iea.org/statistics/topics/renewables/. (accessed 21 April 2020)
- RETScreen 2018, http://www.nrcan.gc.ca/energy/software-tools/7465. (accessed 20 April 2020)
- Rifai, A.,et al. 2016. Mechanics of dust removal from rotating disk in relation to self-cleaning applications of PV protective cover. Solar Energy 130:193–206. doi:https://doi.org/10.1016/j.solener.2016.02.028.
- Rodriguez-Trejo, S., A. M. Ahmad, M. A. Hafeez, H. Dawood, V. Vukovic, M. Kassem, K. K. Naji, and N. Dawood. 2017. Hierarchy based information requirements for sustainable operations of buildings in Qatar. Sustainable Cities and Society 32:435–48. doi:https://doi.org/10.1016/j.scs.2017.03.005.
- Said, S. A., et al. 2010. Feasibility of using ground-coupled condensers in A/C systems. Geothermics 39 (2):201–04. doi:https://doi.org/10.1016/j.geothermics.2010.02.001.
- Said, S. A. M., and H. M. Walwil. 2014. Fundamental studies on dust fouling effects on PV module performance. Solar Energy 107:328–37. doi:https://doi.org/10.1016/j.solener.2014.05.048.
- Said, S. A. M., N. Al-Aqeeli, and H. M. Walwil. 2015. The potential of using textured and anti-reflective coated glasses in minimizing dust fouling. Solar Energy 113:295–302. doi:https://doi.org/10.1016/j.solener.2015.01.007.
- Said, Z., A. A. Alshehhi, and A. Mehmood. 2018. “Predictions of UAE’s renewable energy mix in 2030,”. Renew Energy 118:779–789. https://doi.org/10.1016/j.renene.2017.11.075 .
- Said, Z., and A. Mehmood. 2017. Standalone photovoltaic system assessment for major cities of United Arab Emirates based on simulated results. Journal of Cleaner Production 142:2722–2729 92017). doi:https://doi.org/10.1016/j.jclepro.2016.11.004.
- Said, S.A.M., et al., The effect of environmental factors and dust accumulation on photovoltaic modules and dust-accumulation mitigation strategies. Renewable and Sustainable Energy Reviews 2018. 82(8): p. 743-760.
- Salah, M. M., A. G. Abo-khalil, and R. P. Praveen. 2019. Wind speed characteristics and energy potential for selected sites in Saudi Arabia. Journal of King Saud University-Engineering Sciences. doi:https://doi.org/10.1016/j.jksues.2019.12.006.
- Saudi Arabia Awards First NREP Solar Project see, https://www.powersaudiarabia.com.sa/web/attach/news/300MW-Sakaka-Solar-PV-Project-Awarded.pdf (accessed 28 March 2020)
- Saudi Arabia Kingdom Embassy. Saudi Arabia Inaugurates First Solar Power Plant 2011 see: https://www.saudiembassy.net/press-release/saudi-arabia-inaugurates-first-solar-power-plant
- Saudi Aramco and GE deliver the first wind turbine in the Kingdom of Saudi Arabia, http://www.saudiaramco.com/en/home/news-media/news/GE-turbine.html. ( accessed on June 18, 2018).
- Senshaw, D. A., and J. W. Kim. 2018. Meeting conditional targets in nationally determined contributions of developing countries: Renewable energy targets and required investment of GGGI member and partner countries. Energy Policy 116:433–43. doi:https://doi.org/10.1016/j.enpol.2018.02.017.
- Sgouridis, S.,et al. 2013. A sustainable energy transition strategy for the United Arab Emirates: Evaluation of options using an integrated energy model. Energy Strategy Reviews 2 (1):8–18. doi:https://doi.org/10.1016/j.esr.2013.03.002.
- Shaahid, S. M., and I. El-Amin. 2009. Techno-economic evaluation of off-grid hybrid photovoltaic–diesel–battery power systems for rural electrification in Saudi Arabia—A way forward for sustainable development. Renewable and Sustainable Energy Reviews 13 (3):625–33. doi:https://doi.org/10.1016/j.rser.2007.11.017.
- Shaahid, S. M., L. M. Al-Hadhrami, and M. K. Rahman. 2014. Review of economic assessment of hybrid photovoltaic-diesel-battery power systems for residential loads for different provinces of Saudi Arabia. Renewable and Sustainable Energy Reviews 31:174–81. doi:https://doi.org/10.1016/j.rser.2013.11.055.
- Sharples, S., and H. Radhi. Assessing the technical and economic performance of building integrated photovoltaics and their value to the GCC society. Renewable Energy 55:150–59.2013 doi: https://doi.org/10.1016/j.renene.2012.11.034.
- Sharqawy, M. H., et al. 2009. First in situ determination of the ground thermal conductivity for borehole heat exchanger applications in Saudi Arabia. Renewable Energy 34 (10):2218–23. doi:https://doi.org/10.1016/j.renene.2009.03.003.
- Shin, J.-Y., T. B. M. J. Ouarda, and T. Lee. 2016. Heterogeneous mixture distributions for modeling wind speed, application to the UAE. Renewable Energy 91:40–52. doi:https://doi.org/10.1016/j.renene.2016.01.041.
- Sim, L. F. 2014. Numerical modelling of a solar thermal cooling system under arid weather conditions. Renewable Energy 67:186–91. doi:https://doi.org/10.1016/j.renene.2013.11.032.
- Sources Renewable capacity. (2020). Retrieved from: https://www.irena.org/-/media/Files/IRENA/Agency/Publication/2020/Mar/IRENA_RE_Capacity_Highlights_2020.pdf?la=en&hash=B6BDF8C3306D271327729B9F9C9AF5F1274FE30B. (accessed 2 April 2020)
- Taleb, H. M., and S. Sharples. 2011. Developing sustainable residential buildings in Saudi Arabia: A case study. Applied Energy 88 (1):383–91. doi:https://doi.org/10.1016/j.apenergy.2010.07.029.
- The Bahrain World Trade Center, Has Built-In Wind Turbines see: http://www.amusingplanet.com/2015/11/the-bahrain-world-trade-center-has.html
- Touati, F.,et al. 2016. Investigation of solar PV performance under Doha weather using a customized measurement and monitoring system. Renewable Energy 89:564–77. doi:https://doi.org/10.1016/j.renene.2015.12.046.
- Touati, F.,et al. 2017. Long-term performance analysis and power prediction of PV technology in the State of Qatar. Renewable Energy 113:952–65. doi:https://doi.org/10.1016/j.renene.2017.06.078.
- Vision Realization, http://vision2030.gov.sa/en for Vision Realization Programs Overview 2016.
- World Proved Oil Reserves, http://peakoilbarrel.com/world-proved-oil-reserves-fact-fiction/for “Fact or Fiction” (last accessed June 4, 2018).
- Yip, C. M. A., U. B. Gunturu, and G. L. Stenchikov. 2016. Wind resource characterization in the Arabian Peninsula. Applied Energy 164:826–36. doi:https://doi.org/10.1016/j.apenergy.2015.11.074.
- Zell, E.,et al. 2015. Assessment of solar radiation resources in Saudi Arabia. Solar Energy 119:422–38. doi:https://doi.org/10.1016/j.solener.2015.06.031.
