
 ?Mathematical formulae have been encoded as MathML and are displayed in this HTML version using MathJax in order to improve their display. Uncheck the box to turn MathJax off. This feature requires Javascript. Click on a formula to zoom.
ABSTRACT
Given the increasing damage effect of climate change, the Canadian government has taken a further step to ensure that carbon pricing is implemented in all provinces to reduce its GHGs emissions as a means of addressing climate change. Thus, this paper examines the effect of carbon pricing on energy consumption which is the main source of CO2 emission to enhance our understanding beyond carbon-pricing effects on households and revenue recycling in the prior research. Our study analyzes the energy efficiency of Canada using the province-level data between 2000 and 2021, by developing an SFA production model to understand the drivers of energy consumption and then compute the total factor energy efficiency index while controlling for the role of carbon pricing. Our empirical results reveal that increased labor input, as well as output, mitigate the rising capital-induced energy consumption, while carbon pricing policy plays no significant role in influencing energy consumption. However, the effectiveness of carbon pricing is found in reducing province-level energy efficiency. This striking evidence suggests that policymakers should consider a labor-oriented energy saving scheme and conduct a comprehensive review of the current carbon pricing policy in order to align with energy efficiency interventions toward the achievement of Canada’s Paris Agreement targets.
1. Introduction
The issue of increasing energy demand and the need to reduce greenhouse gas (GHG) emissions presents a significant challenge to developed economies like Canada. These emissions primarily stem from the extensive utilization of fossil fuels in economic activities. Strategies like imposing fines on fossil fuel usage and incentivizing renewable energy adoption, have been advocated as effective measures to reduce emissions (Khurshid et al. Citation2023; Yang, Jahanger, and Hossain Citation2023a). Consequently, the Pan Canadian Framework on Clean Growth and Climate Change was introduced in 2016, aiming to reduce emissions by 30% below 2005 levels by 2030 and achieve net-zero emissions by 2050 (Statistics Canada Citation2017). In addition, the federal government augmented the emission reduction target to 40% in 2021.
The federal government pricing system has two parts: a regulatory charge on fossil fuels like gasoline and natural gas which is known as the fuel charge, and the Output-Based Pricing system, which is a performance-based system for industries (GOC Citation2021). However, different provinces and territories use either or both pricing systems. For example, the fuel charge is used in Ontario, Manitoba, Yukon, Alberta, Saskatchewan, and Nunavut, while Prince Edward Island, Yukon, Nunavut, and partly Saskatchewan use the output-based pricing system (GOC Citation2022). Furthermore, the flexibility in Canada’s approach allows provinces and territories to design their own pricing system to suit their local needs or adopt the federal pricing system as illustrated in .
Figure 1. Carbon pricing in Canadian provinces (Source: ECCC Citation2023).
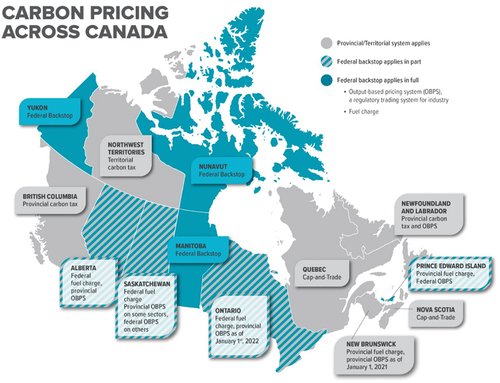
This framework necessitates all Canadian provinces to implement carbon pricing, with a gradual increase in the carbon price from Cad$10 per ton in 2018 to an anticipated Cad$170 per ton by 2030. The implications of this carbon pricing mechanism on households and industrial sectors have created concerns among researchers (Parry Citation2021; Winter, Dolter, and Fellows Citation2023). Notably, recent research in Canada indicates that an increase in carbon tax to Cad$50 would lead to an almost 25% rise in industry cost (Parry and Mylonas Citation2017); to Cad$170 based on the Canadian Government target would reduce economic growth by 1.8%, employment rate by 0.8%, and account for 2.5% of welfare losses in Canada (Mckitric and Aliakbari Citation2021). The disparity in the impact of diverse carbon pricing policy as indicated in across Canadian provinces underscores the need for comprehensive examination, particularly regarding its effect on energy efficiency.
While substantial investments in energy efficiency programs focus on providing efficient equipment for industries, it remains unclear to the extent to which such programs influence energy consumption in carrying out their production activities. Therefore, this calls for a comprehensive strategy to maximize energy efficiency potential across the provinces. Our paper responds to this call by investigating the role of carbon pricing in influencing energy efficiency across Canadian provinces, using the microeconomic production framework.
Thus, we establish a novelty by deriving an energy input model from a production function framework, which quantifies the impact of carbon pricing on both energy consumption and inefficiency while accounting for the cross-sectional dependence among the Canadian provinces. Then, we use this novel model to provide answers to the following research questions: How does the energy input relate to carbon pricing, labor, capital, and output? Then, what is the impact of carbon pricing on total factor energy efficiency? Given our empirical framework, we provide useful policy insights through the following channels: first, we create a robust framework for policymakers to have a better understanding of the impact of their carbon pricing on energy efficiency in order to address policy bias from using single-factor energy efficiency scores. Second, our model allows policymakers to have evidence-based options that can be explored to reduce energy consumption and improve energy efficiency. Third, we demonstrate the policy implications of allowing province spillover in improving energy efficiency programs that would align with carbon pricing targets.
The remainder of our paper is organized as follows. Section 2 reviews the literature on energy efficiency measurement and determinants. Then, it presents potential drivers of CO2 emissions including the role of environmental policy established in the previous research. Section 3 sets out the theoretical framework and describes the econometric methodology, while Section 4 explains the variables and the data used in implementing our empirical strategy. Section 5 presents the results and discussion. Section 6 outlines the conclusions of our study.
2. Literature review on energy efficiency
2.1. Definition of energy efficiency
Decoupling economic growth from energy consumption is vital to meeting climate change goals, and energy efficiency is one of the ways to achieve such decoupling. Energy efficiency is a pivotal part of building a cleaner energy future, and it provides many benefits to both individuals and society at large, through significant carbon reduction emissions and lower energy costs (IEA Citation2020b). Renewable energy technologies are also working toward these goals; however, energy efficiency has been identified to be the most cost-effective means to achieve these outcomes. Also, for renewable energy technologies such as wind and solar energy, integrating them with energy efficiency helps to amplify their benefits. According to the IEA (Citation2020b), improved energy efficiency will be responsible for the largest contribution to the GHG emission reductions required to meet the 2015 Paris Agreement commitments. What then is Energy Efficiency?
Energy efficiency means the use of less energy to perform the same task or the use of the same energy to perform more tasks – which implies eliminating energy waste (Environmental and Energy Study Institute Citation2021). Simply put, energy efficiency means using less energy to get the same job done – and in the process, cutting energy bills and reducing pollution (Energy Star Citation2022). According to the Cambridge Dictionary, “Energy efficiency is used to describe things that use only as much energy as is needed without wasting any.” While there may be various definitions of energy efficiency in different sectors such as in transportation, buildings, products, or energy generation and consumption, one term is common in most of the definitions, “avoiding energy waste.” In Canada, achieving energy efficiency remains a great concern as about 60% of the primary energy produced is wasted in conversion and 40% of the greenhouse gas emission reduction can be achieved through energy efficiency (Love Citation2018). Thus, this concern requires a better understanding of energy efficiency drivers.
2.2. Drivers of energy efficiency
While attempting to study potential drivers of energy efficiency, literature still explores appropriate methods to measure energy efficiency. These measurement indicators can be broadly grouped into two, namely, single-factor energy efficiency and total factor energy efficiency. The single-factor energy efficiency measurement proxies energy efficiency by the ratio of output (GDP) to energy consumption. However, this measurement fails to account for energy efficiency due to other factors such as input substitution and industry structure (IEA Citation2020a), fuel mix, and weather (Ang Citation2006). In addition, it produces a weak association between energy intensity and energy efficiency (Adom et al. Citation2018). These limitations led to the use of total factor energy efficiency measurement that considers all drivers of energy efficiency by employing either parametric or non-parametric methods (He et al. Citation2021). While the parametric methods such as stochastic frontier analysis (SFA) rely on fundamental economic theories such as production theory, the non-parametric methods such as data envelopment analysis (DEA) do not require a specific production or cost function form (Filippini and Hunt Citation2015) in their setting (see He et al. Citation2021 for further extensions of DEA).
2.3. Models of energy efficiency
Several studies have employed many evaluation models for energy efficiency which are broadly categorized into two, namely: single-factor and multifactor evaluation models (Na et al. Citation2019). The single-factor or partial productivity literature measures energy efficiency by relating only energy input to output. These models proxy energy efficiency measurement by using the following indicators: thermodynamic, thermos-physical, thermal-economic, and economic indicators. The thermodynamic indicator which measures energy efficiency as a ratio of the energy output process to all energy inputs in the process, is based on the first-law thermal efficiency of a process (Utlu and Hepbasli Citation2007). However, its failure to account for the quality of energy leads to the use of the second law which relates the actual efficiency of a process to its ideal efficiency while calculating energy efficiency. These two indicators ignore other factors of production such as labor and capital in obtaining energy efficiency (Na et al. Citation2019).
The thermal-economic technique which combines energy input and output value in deriving energy efficiency is based on either energy productivity or energy intensity (Subrahmanya Citation2006). The energy intensity also known as energy consumption per output value is expressed as a ratio of energy consumption to GDP in a specific time, in which its low value suggests less energy dependence for a country (Hang and Tu Citation2007). Despite this method’s advantage of simple calculation, easy understanding, and little human interference (Na et al. Citation2019), the method is practically unreliable due to the dynamic nature of the economic structure, technological level, population, and resource (Calcagnini, Giombini, and Travaglini Citation2016). On the other hand, energy productivity which is an inverse of energy intensity (Wang Citation2007) denotes higher efficiency when its value is higher and is used to improve the traditional productivity that is restricted to labor and capital. In addition, this approach matches the Patterson’s energy efficiency definition (Patterson Citation1996). An economic single-factor model considers energy efficiency in relation to both input and output values (Al-Mofleh et al. Citation2009). This model which defines energy efficiency as a ratio of energy input value to the economic performance of a product allows for energy price as well as changes in energy supply and demand in its calculation (Na et al. Citation2019). However, the implementation of the method is difficult due to frequent changes in the energy price (Arrow et al. Citation1961).
While the literature has applied the above-explained methods to study the drivers of energy efficiency, because of their simple calculation and easy understanding, these techniques are not appropriate to measure the potential technical efficiency that aligns with reality. Thus, this calls for a multifactor evaluation model of energy efficiency (Na et al. Citation2019) which accounts for multiple inputs (such as labor and capital) and outputs (such as pollutants and assets) (Edziah et al. Citation2021; Zhao and Lin Citation2019). This multifactor evaluation model can be implemented using both SFA and DEA approaches. The SFA approach measures energy efficiency by implementing a production or cost theory that is based on a prior functional form. The functional form decomposes its error term into inefficiency and random error, which is then utilized to derive efficiency (Liu et al. Citation2023) .
On the other hand, the DEA approach does neither require any functional form nor statistical underpinnings to estimate parameter coefficients (Na et al. Citation2019; Liu et al. Citation2023). For instance, the DEA estimates energy efficiency by the distance between each of the decision-making units (DMUs) and their efficiency frontier. The literature on the DEA method has implemented its different versions due to the assumption on a scale of return. For instance, the Charnes, Copper, and Rhodes (CCR) version assumes an unchanged return scale (Na et al. Citation2019), but it is varied in the Banker, Charnes, and Cooper (BCC) version. In addition, the slack-based model (SBM) version allows for the possibility of unequal weights in the case of undesirable outputs/inputs (Sabouhi and Mardani Citation2017). Given the different evaluation models of energy efficiency, it is worthily important to present the empirical literature on their applications.
2.4. Related applications of energy efficiency
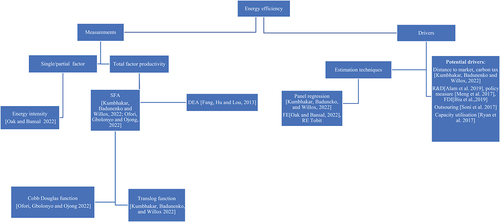
The empirical literature on energy efficiency is highly diverse in terms of energy efficiency measurements, and estimation techniques employed to calculate energy efficiency and determine its drivers. Their research scope also exhibits variation in their level of analysis and contexts. shows the pattern of variations in the most related empirical works. For instance, Oak and Bansal (Citation2022) used the single-factor measurement to capture energy efficiency when analyzing Indian manufacturing firms despite the weakness and inappropriateness of this measure. Other empirical studies address this concern by using either the stochastic frontier efficiency (Kumbhakar, Badunenko, and Willox Citation2022; Ofori, Gbolonyo, and Ojong Citation2022) or data envelopment analysis (Fang, Hu, and Lou Citation2013) which performs a deterministic frontiers examination (Liu et al. Citation2023). The SFA method is established to be more appropriate because of its ability to handle data outliers, measurement errors, omitted variable bias (Mutz, Bornmann, and Daniel Citation2017), and dealing with the nature of macroeconomic data which may contain considerable statistical noise (Filippini and Hunt Citation2015). In addition, this approach can decompose efficiency scores into transient and persistent components (Agradi, Adom, and Vezzulli Citation2022). Given these relative advantages of the SFA method, our paper employs the SFA technique to derive our province-level efficiency scores for Canada. In addition, we derive these scores using a Cobb Douglas production functional form following the approach of Ofori, Gbolonyo, and Ojong (Citation2022) due to the limited data availability at the Canadian province level while acknowledging the advantage of a translog functional form which is more flexible (Kumbhakar, Badunenko, and Willox Citation2022).
Figure 2. Energy efficiency literature ecosystem.
In terms of the energy efficiency determinants, the previous studies have identified potential drivers of energy efficiency such as firm size and age (Goldar Citation2013; Sahu and Narayanan Citation2011), technological improvement (Goldar Citation2011), R&D investment (Alam et al. Citation2019, Goldar Citation2011; Sahu and Narayanan Citation2011), outsourcing (Soni, Mittal, and Kapshe Citation2017), capital intensity (Goldar Citation2011; Sahu and Narayanan Citation2011), FDI (Bu, Li, and Jiang Citation2019; He et al. Citation2012; Hübler and Keller Citation2010), and policy measures proxied as Energy Star (Meng et al. Citation2017), and PAT (Perform, Achieve, and Trade) Scheme (Oak and Bansal Citation2022). While positive influences on energy efficiency are established from R&D, FDI, and policy measures, negative effects on the energy efficiency are attributed to capital intensity (Sahu and Narayanan Citation2011), and capacity utilization (Ryan Citation2018). In addition, no energy-reducing effect of FDI inflows is found in the work of Hübler and Keller (Citation2010) when analyzing the energy efficiency of 60 developing countries using a macro-level cross-country technique. This inconclusive effect in the literature also extends to outsourcing (Soni, Mittal, and Kapshe Citation2017), and policy measures (Rezessy and Bertoldi Citation2011). Thus, our research contributes to these studies by examining the impact of a carbon tax on energy efficiency rather than economic and environmental performance (Kumbhakar, Badunenko, and Willox Citation2022; Tan et al. Citation2020) in the context of Canadian provinces where the scanty study is noted. To implement a robust analysis in achieving the main aim of our paper, this subsequent subsection reviews the literature on the role of carbon tax in energy efficiency and CO2 emissions.
2.5. Impact of carbon tax on energy efficiency
In recent times, literature on energy studies has delved into unraveling means through which two critical issues of abatement of greenhouse gas (GHGs) emissions and deep decarbonization to avert dangerous climate change can be simultaneously resolved. This literature can be broadly classified into two streams. The first stream of literature focuses on exploring the potential drivers of GHGs emissions using the Environmental Kuznets Curve (EKC) framework, while the second stream examines the impact of carbon pricing and related benefits such as energy efficiency and innovation (Acemoglu et al. Citation2012; Ambec et al. Citation2013) on emissions and energy consumption. Along with this focus, the effectiveness of carbon pricing is also examined in achieving cost-effectively desirable solutions toward reaching the Paris Agreement (Haug, Eden, and de Oca Citation2018; Mehling and Tvinnereim Citation2018; Stiglitz et al. Citation2017Yang, Jahanger, and Hossain Citation2023a).
The first stream literature implements different approaches in different contexts over different sample periods to understand the determinants of carbon emissions and investigate the validity of the EKC hypothesis (Jahanger et al. Citation2023, Citation2023, Citation2023; Jiang et al. Citation2022; Yu, Nie, and Jahanger Citation2024; Zeraibi et al. Citation2023). For instance, Jahanger et al. (Citation2023) examined the dynamic effects of atomic energy and ICT on carbon emissions by applying their novel non-parametric technique known as the method of moments of quantile regression (MMQR) to a panel dataset of top nuclear energy countries from 1990 to 2017. They find that both nuclear energy and ICT mitigate carbon emissions, along with their findings confirming the existence of the EKC hypothesis. The validity of the EKC hypothesis is also established in the context of Mexico using quarterly data from 1990 to 2018 while implementing the Quantile Autoregressive Lagged (QARDL) method (Jahanger et al. Citation2022). In addition, they find that renewable energy and globalization significantly oppositely influence Mexico’s CO2 emissions.
However, an increase in economic growth and economic complexity reduces carbon footprint, while urbanization, greenfield investment, and financial inclusion spur the carbon footprint among BRICS countries between 2003 and 2018, based on the estimation results from employing the Pooled Mean Group (PMG-ARDL) approach (Zeraibi et al. Citation2023). The rebound effect of economic growth on the ecological footprint is also found through increased consumption of fossil energy when testing the alternative N-shaped EKC hypothesis among the top nuclear energy-producing countries over the period 1990–2018 using the novel dynamic common correlated effect (DCCE) method (Jahanger et al. Citation2023).
Under the first literature stream, some studies such as Yu, Nie, and Jahanger (Citation2024); Jiang et al. (Citation2022); implement input-output and structural decomposition techniques to examine the growth of energy-related CO2 emissions in China. For instance, Yu, Nie, and Jahanger (Citation2024) analyzed the growth trend of energy-related CO2 emissions in the light sectors using enterprise-level data between 2007 and 2017. They find that energy structure, energy intensity, and input structure have the potential of offsetting increased CO2 emissions arising from growing energy utilization and final demand products. Their findings are consistent with the prior research (Jiang et al. Citation2022) that links significant energy-related CO2 emissions in China’s power and heating industry to energy intensity, input structure, and energy structure.
On the other hand, the second literature stream (e.g., Khan, Khurshid, and Cifuentes-Faura Citation2023; Khurshid et al. Citation2023, Citation2023; Yang, Jahanger, and Hossain Citation2023a) has investigated the impact of carbon pricing and its identified benefits on the level of GHGs emissions in different contexts and sample periods while employing different estimation techniques. For instance, Khurshid et al. (Citation2023) utilize a PMG-ARDL approach to examine the influence of carbon taxes on GHGs emissions, along with other explanatory variables such as green innovation and renewables in the context of the OECD transport and industry sectors between 1990 and 2020. Their findings show that carbon taxes as well as innovation limit emissions, while the deployment of renewable-based transport mitigates climate-related welfare costs. Thus, they conclude that carbon pricing is an effective policy instrument in reducing emissions, but its effectiveness is sufficient when combined with other mitigation drivers such as renewable technologies and green energy. Similar results are also found in the context of 25 EU economies over the period 1994–2020, with the conclusion that green taxes are effective short-term instruments to reduce transport-related and total emissions (Khurshid, Khan, and Cifuentes-Faura Citation2023).
Using the enterprise-level data, Yang, Jahanger, and Hossain (Citation2023b) apply a time-varying difference in difference (DiD) technique to examine the effect of low-carbon city pilot (LCCP) policy on emissions in China over the period of 2006–2014. They find a significant negative influence of the LLCP on firm-level emissions, and its effect magnitude varies in terms of firm ownership, type, and location. In addition, a weaker effect is found in state-owned enterprises compared to foreign and private-owned enterprises. Thus, they suggest a need for considering regional, industrial, and ownership differences in the further implementation of the LCCP policy. In the same vein, the LCCP intervention significantly reduces firm-level electricity consumption in China, in addition to firm size and labor input while implementing the DiD method for the period 2007–2014 (Yang, Jahanger, and Hossain Citation2023a). Exploring a different view, Khan, Khurshid, and Cifuentes-Faura (Citation2023) examine the link between geopolitical risks and environmental policy across 19 EU countries over the sample period of 1994–2020 using a panel bootstrap Granger causality method. Their results reveal a significantly unidirectional causality from geopolitical risks to the effectiveness of environmental policy in some EU countries such as Denmark, France, and Germany, but the reverse causality is only found for Latvia and no significant links for the remaining countries.
Given the above-reviewed literature, it becomes clear that there are two extreme groups in the literature. The first group mainly focuses on providing appropriate measurements for energy efficiency and understanding the energy efficiency determinants, while the second group explores determinants of GHGs emissions. Thus, our paper fills the research vacuum between these literature groups by developing a novel theoretical-grounded model to examine the impact of carbon pricing policy on appropriately measured energy efficiency. This novelty allows policymakers to explore alternative non-monetary incentives to stimulate energy efficiency and extends the existing knowledge in the academic environment on how input structure and carbon pricing influence energy efficiency in the context of Canada.
3. Methodology
Rather than using an economic-thermodynamic indicator of energy efficiency (Patterson Citation1996), we develop a basic production framework that is used to provide a better proxy for energy efficiency. Our production framework that considers energy as an additional input to capital and labor is specified:
Where denotes output (in the form of final product and services);
represents energy consumption; and
denotes non-energy inputs such as capital and labor while
represents provinces.
Considering the nature of data availability, we derive energy efficiency through expanding EquationEquation (1)(1)
(1) using an input requirement Cobb-Douglas function specified:
Where is energy input,
denotes output and
are non-energy inputs;
represents the associated vector of parameters to be estimated and error term
is decomposed into the two independent components
, reflects the energy efficiency used as an indicator of the level of inefficiency in the use of energy while the second component
is non-negative and time-varying random disturbance. In addition,
follows a half-normal distribution while
follows a normal distribution (Filippini and Hunt Citation2015). We control for carbon pricing policy in the energy input requirement equation as well as in the inefficiency equation, while addressing exogeneity and cross-sectional dependence issues.
EquationEquation (2)(2)
(2) indicates the minimum amount of required energy input in each province given the province’s output and other factors of production such as capital and labor. Then, we obtain the level of energy efficiency
for each Canadian province in each year as:
where is the energy consumption of the frontier.
4. Variable description and data source
This paper analyzes the determinants of energy input efficiency in Canada using provincial panel data (as listed in ) while controlling for the role of carbon pricing policy. Owing to the missing energy data of three provinces, the sample consists of 10 provinces’ panel data of Canada spanning between 2000 and 2021. We obtained the provinces’ data from Statistics Canada and the Canada Energy Regulator, and these data are expressed in either real or physical terms, as listed in .
Table 1. Variable description and data source.
Table 2. Province-wise summary statistics.
5. Empirical results
5.1. Summary statistics
We perform a statistical analysis and model estimations using Stata, for only 10 provinces that have data for the above-mentioned variables, as explained in Section 4. summarizes descriptive statistics of these variables by the whole sample and provinces. Only four Canadian provinces (Ontario, Quebec, Alberta, and British Columbia) whose averaged outputs exceed the average sample, but their output standard deviation is below the total sample counterpart. Another striking point is that Alberta’s output volatility (captured by standard deviation) is higher than Quebec’s output fluctuation. A similar pattern is observed for the remaining variables’ mean and standard deviation except that energy consumption on average records the highest value for Alberta () whose economy is mainly driven by the energy sector.
The correlation matrix result reported in shows a strong linear relationship among the concerned variables, which ranges between 0.7823 (between L and E) and 0.9836 (between Y and K).
Table 3. Correlation matrix.
5.1. Results of the SFA model
Owing to our small sample size, we implement the SFA model Cobb Douglas functional form to minimize the sample loss. This SFA model is used to obtain a frontier model which includes energy input. shows the different estimation results of the SFA model labeled by Columns 1–5. In Columns 1–2, we perform the true fixed model suggested in Green (Citation2005) while Column 3 does not account for the fixed province-specific effect. Results of Columns 4–5 are presented to show the impact of exogeneity and endogeneity assumptions on the estimated models, in which the endogeneity test indicates that the exogeneity assumption is valid.
Table 4. Energy input efficiency SFA regression results.
Our baseline model result in Column 1 shows that the province’s energy consumption decreases with its output. With the significant output elasticity of −0.742 at a 5% level, implies that a 1% rise in output leads to a 0.742% fall in energy consumption on the sample average, holding other things constant. However, an increase in capital input marginally raises energy consumption on average with the elasticity of 0.0490 at a 10% level, while an upsurge in labor input substantially reduces the amount of energy consumed at a 5% significance level. An exogenous factor proxied by trend leads to a rise in energy consumption.
Extending the baseline model to include carbon pricing in Column 2, our results reveal an insignificant negative influence from carbon pricing while other explanatory variables’ impacts exhibit slight changes in terms of their magnitudes. Allowing for time-invariant inefficiency in Column 3 substantially reduces the effect magnitudes from all the explanatory variables but increases both the magnitude and explanatory power of carbon pricing. In addition, the effect of carbon pricing on energy consumption turns out to be positive and statistically significant at a 10% level. These results are also robust while relaxing the assumption of exogeneity and dealing with endogeneity issues as shown in Columns 4 and 5 respectively.
In summary, the SFA results in show that energy input efficiency is mainly driven by output, labor, and technological process (proxied by the trend variable) while establishing the positive role of carbon pricing on energy input inefficiency which is theoretically unexpected and marginally significant. The positive coefficient of carbon pricing (0.213) means that the introduction of carbon pricing reduces the energy efficiency in the production process among the concerned provinces.
In the context of the related literature, the effect of the province’s output size on energy consumption is found to be negative, in line with the result of Yang, Jahanger, and Hossain (Citation2023b) indicating that firm size significantly limits the amount of electricity consumed by the Chinese enterprises, but contrasts with the positive finding found in Zeraibi et al. (Citation2023). Regarding input structure effect on energy consumption, our result is consistent with the previous literature (Yu, Nie and Jahanger Citation2024; Jiang et al. Citation2022) showing up the fact that input structure is critically important in reducing energy consumption through labor input (Yang, Jahanger, and Hossain Citation2023a) as more employed labor reduces province-energy consumption. However, more capital input is expected to increase energy consumption, which is affirmed by the literature (Sahu and Narayanan Citation2011).
In contrast, we find a positive effect of carbon pricing on energy consumption in Canadian provinces at a marginally significance level. This result is not in line with the conclusion provided by the previous literature (Khurshid et al. Citation2023, Citation2023b; Yang, Jahanger, and Hossain Citation2023b), which might be due to different contexts and techniques utilized in our study. In addition, our paper focuses on energy consumption as a prime contributor of CO2 emissions instead of electricity consumption in Yang, Jahanger, and Hossain (Citation2023a) and CO2 emissions (Khurshid et al. Citation2023, Citation2023b). We also establish the role of carbon pricing policy in energy efficiency as identified in the literature (Oak and Bansal Citation2022; Meng et al. Citation2017), but through reducing energy efficiency as theoretically unexpected.
Based on the SFA model results in Column 2 of , we calculate the total factor energy input efficiency of the 10 provinces as shown in . As it can be observed in the table, the energy efficiency of Canada shows variation across provinces () and time (). In , the highest average energy efficiency index using the SFA technique is Ontario (0.967), followed by British Columbia (0.961) while the lowest (0.909) is attributed to Novia Scotia. The highest energy efficiency index attributes to Ontario province might be due to the structure of economic activities in the province. Ontario is the leading manufacturing and the most populous province in Canada. In addition, it is home to Toronto which is one of the biggest cities in the world. Its relative economic advantages in terms of the biggest economic size and more labor-intensive production structure compared to other provinces might be responsible for its highest energy efficiency score because its carbon pricing is similar to other provinces except for Quebec and Nova Scotia.
Figure 3. Plot of average energy input efficiency index from 2005 to 2020.
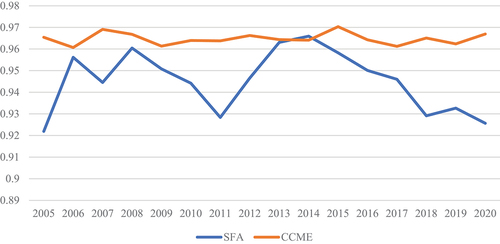
Table 5. Canadian provinces’ energy efficiency index.
However, in the common correlated method (CCME), Nova Scotia has the highest average energy input efficiency, with a slight difference among the provinces. The range of these indices in terms of their minimum and maximum scores for each province can be found in Appendix A1. Allowing for other provinces’ spillover in the CCME, Nova Scotia scores the highest energy efficiency because it is the second-smallest province by area whose economic activities depend on fishery and one of two Canadian provinces that implemented Cap-and-Trade policy. In addition, its energy efficiency program includes the transportation sector which might significantly benefit from other province spillovers. However, Quebec, which is the largest province by area, turns out to have the lowest energy efficiency score because of its open economy driven by the more capital-intensive service sector. This striking observation is that the two provinces Nova Scotia and Quebec implemented the same carbon pricing instruments, but their energy performance scores differ due to their economic structure and geographical characteristics.
The average sample total factor energy efficiency is evaluated and analyzed across the sample periods, and their indices are depicted in . The efficiency of the average sample was relatively high in 2014 under the SFA technique, but in 2015 under the CCME technique, these two periods coincided with the end of the Kyoto Protocol and the introduction of the Paris Agreement. Afterward, there is a continuous fall in the efficiency index which is more pronounced using the SFA. This also buttresses the weak contribution of carbon pricing to energy efficiency in Canadian provinces.
6. Conclusion
Our empirical paper investigates the impact of carbon pricing policy on energy efficiency in Canadian provinces over the period from 2000 to 2021. We employ an empirical strategy by developing a theoretically embedded stochastic frontier model to bridge the research gap between the appropriate energy efficiency measurement and the determinants of carbon emissions. In addition, our developed model addresses potential policy recommendation bias arising from the assumption of exogeneity and cross-sectional independence.
Implementing our robust estimation techniques, we establish the significant role of production input structure in reducing energy consumption, thus suggesting that existing energy efficiency programs in Canada should not rely solely on providing energy-efficient equipment (which might amplify energy consumption) for its industry but can also stimulate economic activities and engage more labor participation in order to significantly offset the increased capital-induced energy consumption. This invariably leads to substantial emission reductions in the country. However, the negative effect of carbon pricing on energy efficiency provides an important signal for policymakers and researchers to conduct a comprehensive review of the current Canadian carbon pricing policy to align carbon pricing instruments with energy efficiency programs. This alignment can provide a quick milestone toward the achievement of the country’s Paris Agreement targets.
Our study’s limitations provide opportunities for future research. First, it would be interesting to replicate our approach in other countries in order to develop more general empirical evidence. Second, future research can extend our results to industry-level samples among Canadian provinces in order to account for all possible sources of heterogeneities related to production input structure, energy structure, and energy intensities. Third, it is also advisable for future research to consider the impact of different carbon pricing instruments (e.g., carbon tax vs cap-and-trade) on energy consumption and efficiency.
Disclosure statement
No potential conflict of interest was reported by the author(s).
Additional information
Funding
References
- Acemoglu, D., P. Aghion, L. Bursztyn, and D. Hemous. 2012. The environment and directed technical change. American Economic Review 102 (1):131–66. doi:10.1257/aer.102.1.131
- Adom, P., K. Amakye, and C. Quaidoo. 2018. Estimate of transient and persistent energy efficiency in Africa: A stochastic frontier approach. Energy Conversion and Management 166:556–68. doi:10.1016/j.enconman.2018.04.038
- Agradi, M., P. K. Adom, and A. Vezzulli. 2022. Towards sustainability: Does energy efficiency reduce unemployment in African societies? Sustainable Cities and Society 79:103683. doi:10.1016/j.scs.2022.103683
- Alam, M., P. X. Zou, R. A. Stewart, E. Bertone, O. Sahin, C. Buntine, and C. Marshall. 2019. Government championed strategies to overcome the barriers to public building energy efficiency retrofit projects. Sustainable Cities and Society 44:56–69. doi:10.1016/j.scs.2018.09.022
- Al-Mofleh, A., S. Taib, M. A. Mujeebu, and W. Salah. 2009. Analysis of sectoral energy conservation in Malaysia. Energy 34 (6):733–39. doi:10.1016/j.energy.2008.10.005
- Ambec, S., M. A. Cohen, S. Elgie, and P. Lanoie. 2013. The Porter hypothesis at 20: Can environmental regulation enhance innovation and competitiveness? Review of Environmental Economics and Policy 7 (1):2–22. doi:10.1093/reep/res016
- Ang, B. W. 2006. Monitoring changes in economy-wide energy efficiency: From energy–GDP ratio to composite efficiency index. Energy Policy 34 (5):574–82. doi:10.1016/j.enpol.2005.11.011
- Arrow, K. J., H. B. Chenery, B. S. Minhas, and R. M. Solow. 1961. Capital-labor substitution and economic efficiency. The Review of Economics and Statistics 43 (3):225–50. doi:10.2307/1927286
- Bu, M., S. Li, and L. Jiang. 2019. Foreign direct investment and energy intensity in China: Firm-level evidence. Energy Economics 80:366–76. doi:10.1016/j.eneco.2019.01.003
- Calcagnini, G., G. Giombini, and G. Travaglini. 2016. Modelling energy intensity, pollution per capita and productivity in Italy: A structural VAR approach. Renewable and Sustainable Energy Reviews 59:1482–92. doi:10.1016/j.rser.2016.01.039
- ECCC. 2023. Environmental and Climate Change Canada. Ontario.
- Edziah, B. K., H. Sun, E. Anyigbah, and L. Li. 2021. Human capital and energy efficiency: Evidence from developing countries. American Journal of Industrial and Business Management 11 (6):599–610. doi:10.4236/ajibm.2021.116038
- Energy Star. 2022. energystar.gov. Retrieved from Energy Star. https://www.energystar.gov/about/about_energy_efficiency
- Environmental and Energy Study Institute. 2021. EESI. Retrieved from EESI Website. https://www.eesi.org/topics/energy-efficiency/description
- Fang, C. Y., J. L. Hu, and T. K. Lou. 2013. Environment-adjusted total-factor energy efficiency of Taiwan’s service sectors. Energy Policy 63:1160–68. doi:10.1016/j.enpol.2013.07.124
- Filippini, M., and L. C. Hunt. 2015. Measurement of energy efficiency based on economic foundations. Energy Economics 52:S5–16. doi:10.1016/j.eneco.2015.08.023
- GOC. 2021. Review of the federal Output-Based Pricing System Regulations. Retrieved from government of Canada. https://www.canada.ca/en/environment-climate-change/services/climate-change/pricing-pollution-how-it-will-work/output-based-pricing-system/review.html
- GOC. 2022. Retrieved from Saskatchewan. https://www.saskatchewan.ca/government/news-and-media/2022/november/22/federal-government-approves-saskatchewans-output-based-performance-standards-program
- Goldar, B. 2013. Energy use efficiency of India’s organised manufacturing. Review of Market Integration 5 (2):131–54.
- Greene, W. 2005. Fixed and random effects in stochastic frontier models. Journal of Productivity Analysis 23:7–32.
- Hang, L., and M. Tu. 2007. The impacts of energy prices on energy intensity: Evidence from China. Energy Policy 35 (5):2978–88. doi:10.1016/j.enpol.2006.10.022
- Haug, C., A. Eden, and M. M. de Oca. 2018. Addressing the distributional impacts of carbon pricing policies. Berlin: Adelphi.
- He, Y., B. Liu, X. Zhang, H. Gao, and X. Liu. 2012. A modeling method of task-oriented energy consumption for machining manufacturing system. Journal of Cleaner Production 23 (1):167–74. doi:10.1016/j.jclepro.2011.10.033
- He, P., Y. Sun, H. Niu, C. Long, and S. Li. 2021. The long and short-term effects of environmental tax on energy efficiency: Perspective of OECD energy tax and vehicle traffic tax. Economic Modelling 97:307–25. doi:10.1016/j.econmod.2020.04.003
- Hübler, M., and A. Keller. 2010. Energy savings via FDI? Empirical evidence from developing countries. Environment and Development Economics 15 (1):59–80. doi:10.1017/S1355770X09990088
- IEA. 2020a. Canada 2022 energy policy review. Accessed May 15, 2023. https://www.iea.org/reports/canada-2022.
- IEA. 2020b. Energy efficiency. Paris: IEA.
- Jahanger, A., M. Z. Chishti, J. C. Onwe, and A. Awan. 2022. How far renewable energy and globalization are useful to mitigate the environment in Mexico? Application of QARDL and spectral causality analysis. Renewable Energy 201:514–25. doi:10.1016/j.renene.2022.10.081
- Jahanger, A., M. R. Hossain, J. C. Onwe, S. O. Ogwu, A. Awan, and D. Balsalobre-Lorente. 2023. Analyzing the N-shaped EKC among top nuclear energy generating nations: A novel dynamic common correlated effects approach. Gondwana Research 116:73–88. doi:10.1016/j.gr.2022.12.012
- Jahanger, A., I. Ozturk, J. C. Onwe, T. E. Joseph, and M. R. Hossain. 2023. Do technology and renewable energy contribute to energy efficiency and carbon neutrality? Evidence from top ten manufacturing countries. Sustainable Energy Technologies and Assessments 56:103084. doi:10.1016/j.seta.2023.103084
- Jahanger, A., U. Zaman, M. R. Hossain, and A. Awan. 2023. Articulating CO2 emissions limiting roles of nuclear energy and ICT under the EKC hypothesis: An application of non-parametric MMQR approach. Geoscience Frontiers 14 (5):101589. doi:10.1016/j.gsf.2023.101589
- Jiang, T., Y. Yu, A. Jahanger, and D. Balsalobre-Lorente. 2022. Structural emissions reduction of China’s power and heating industry under the goal of “double carbon”: A perspective from input-output analysis. Sustainable Production and Consumption 31:346–56. doi:10.1016/j.spc.2022.03.003
- Khan, K., A. Khurshid, and J. Cifuentes-Faura. 2023. Is geopolitics a new risk to environmental policy in the European union? Journal of Environmental Management 345:118868. doi:10.1016/j.jenvman.2023.118868
- Khurshid, A., K. Khan, Y. Chen, and J. Cifuentes-Faura. 2023. Do green transport and mitigation technologies drive OECD countries to sustainable path? Transportation Research Part D: Transport & Environment 118:103669. doi:10.1016/j.trd.2023.103669
- Khurshid, A., K. Khan, and J. Cifuentes-Faura. 2023. 2030 agenda of sustainable transport: Can current progress lead towards carbon neutrality? Transportation Research Part D: Transport & Environment 122:103869. doi:10.1016/j.trd.2023.103869
- Khurshid, A., K. Khan, S. F. Saleem, J. Cifuentes-Faura, and A. C. Calin. 2023. Driving towards a sustainable future: Transport sector innovation, climate change and social welfare. Journal of Cleaner Production 427:139250. doi:10.1016/j.jclepro.2023.139250
- Kumbhakar, S. C., O. Badunenko, and M. Willox. 2022. Do carbon taxes affect economic and environmental efficiency? The case of British Columbia’s manufacturing plants. Energy Economics 115:106359. doi:10.1016/j.eneco.2022.106359
- Liu, M., X. Yang, J. Wen, H. Wang, Y. Feng, J. Lu, H. Chen, J. Wu, and J. Wang. 2023. Drivers of China’s carbon dioxide emissions: Based on the combination model of structural decomposition analysis and input-output subsystem method. Environmental Impact Assessment Review 100:107043. doi:10.1016/j.eiar.2023.107043.
- Love, P. 2018. Fundamentals of energy efficiency; policies, programs & best practices. Ontario: MediaEdge.
- Mckitric, R., and E. Aliakbari. 2021. Estimated impacts of a $170 carbon tax in Canada. Montreal: Fraser Institute.
- Mehling, M. and E. Tvinnereim. 2018. Carbon pricing and the 1.5 C target: Near-term decarbonisation and the importance of an instrument mix. Carbon & Climate Law Review 12 (1):50–61.
- Meng, F. G. Liu, Z. Yang, M. Casazza, S. Cui, and S. Ulgiati. 2017. Energy efficiency of urban transportation system in Xiamen, China. An integrated approach. Applied Energy 186:234–48.
- Mutz, R., L. Bornmann, and H. D. Daniel. 2017. Are there any frontiers of research performance? Efficiency measurement of funded research projects with the Bayesian stochastic frontier analysis for count data. Journal of Informetrics 11 (3):613–28. doi:10.1016/j.joi.2017.04.009
- Na, H., T. Du, W. Sun, J. He, J. Sun, Y. Yuan, and Z. Qiu. 2019. Review of evaluation methodologies and influencing factors for energy efficiency of the iron and steel industry. International Journal of Energy Research 43 (11):5659–77. doi:10.1002/er.4623
- Oak, H., and S. Bansal. 2022. Enhancing energy efficiency of Indian industries: Effectiveness of PAT scheme. Energy Economics 113:106220. doi:10.1016/j.eneco.2022.106220
- Ofori, I. K., E. Y. Gbolonyo, and N. Ojong. 2022. Foreign direct investment and inclusive green growth in Africa: Energy efficiency contingencies and thresholds. Energy Economics 106414. doi:10.1016/j.eneco.2022.106414
- Parry, I. 2021. Four charts on Canada’s carbon pollution pricing system. IMF Country Focus. https://www.imf.org/en/News/Articles/2021/03/17/na031821-four-charts-on-canadas-carbon-pollution-pricing-system
- Parry, I. W., and V. Mylonas. 2017. Canada’s carbon price floor. National Tax Journal 70 (4):879–900. doi:10.17310/ntj.2017.4.09
- Patterson, M. G. 1996. What is energy efficiency?: Concepts, indicators and methodological issues. Energy Policy 24 (5):377–90. doi:10.1016/0301-4215(96)00017-1
- Rezessy, S., and P. Bertoldi. 2011. Voluntary agreements in the field of energy efficiency and emission reduction: Review and analysis of experiences in the European Union. Energy Policy 39 (11):7121–29. doi:10.1016/j.enpol.2011.08.030
- Ryan, N. 2018. Energy productivity and energy demand: Experimental evidence from Indian manufacturing plants ( No. w24619). National Bureau of Economic Research.
- Sabouhi, M., and M. Mardani. 2017. Linear robust data envelopment analysis: CCR model with uncertain data. International Journal of Productivity and Quality Management 22 (2):262–80. doi:10.1504/IJPQM.2017.086369
- Sahu, S. K., and K. Narayanan. 2011. Total factor productivity and energy intensity in Indian manufacturing: A cross-sectional study. International Journal of Energy Economics & Policy 1 (2):47–58.
- Soni, A., A. Mittal, and M. Kapshe. 2017. Energy intensity analysis of Indian manufacturing industries. Resource-Efficient Technologies 3 (3):353–57. doi:10.1016/j.reffit.2017.04.009
- Statistics Canada. 2017. Carbon pricing in the Canadian system of macroeconomic accounts. Catalogue No. 13-605-X. ISSN 1705-9658. https://www150.statcan.gc.ca/n1/pub/13-605-x/2017001/article/14838-eng.pdf
- Stiglitz, J. E. N. Stern, M. Duan, O. Edenhofer, G. Giraud, E. L. La Rovere, A. Morris, E. Moyer, M. Pangestu, and P. R. Shukla. 2017. Report of the high-level commission on carbon prices.
- Subrahmanya, M. B. 2006. Labour productivity, energy intensity and economic performance in small enterprises: A study of brick enterprises cluster in India. Energy Conversion and Management 47 (6):763–77. doi:10.1016/j.enconman.2005.05.021
- Tan, X., Y. Choi, B. Wang, and X. Huang. 2020. Does China’s carbon regulatory policy improve total factor carbon efficiency? A fixed-effect panel stochastic frontier analysis. Technological Forecasting and Social Change 160:120222. doi:10.1016/j.techfore.2020.120222
- Utlu, Z., and A. Hepbasli. 2007. A review and assessment of the energy utilization efficiency in the Turkish industrial sector using energy and exergy analysis method. Renewable and Sustainable Energy Reviews 11 (7):1438–59. doi:10.1016/j.rser.2005.11.006
- Wang, C. 2007. Decomposing energy productivity change: A distance function approach. Energy 32 (8):1326–33. doi:10.1016/j.energy.2006.10.001
- Winter, J., B. Dolter, and G. K. Fellows. 2023. Carbon pricing costs for households and the progressivity of revenue recycling options in Canada. Canadian Public Policy 49 (1):13–45. doi:10.3138/cpp.2022-036
- Yang, S., A. Jahanger, and M. R. Hossain. 2023a. Does China’s low-carbon city pilot intervention limit electricity consumption? An analysis of industrial energy efficiency using time-varying DID model. Energy Economics 121:106636. doi:10.1016/j.eneco.2023.106636
- Yang, S., A. Jahanger, and M. R. Hossain. 2023b. How effective has the low-carbon city pilot policy been as an environmental intervention in curbing pollution? Evidence from Chinese industrial enterprises. Energy Economics 118:106523. doi:10.1016/j.eneco.2023.106523
- Yu, Y., J. Nie, and A. Jahanger. 2024. An evaluation of the energy-related carbon dioxide emissions from China’s light sector to achieve sustainable development goals. Evaluation Review 48 (1):7–31. doi:10.1177/0193841X231164880
- Zeraibi, A., A. Jahanger, T. S. Adebayo, M. Ramzan, and Y. Yu. 2023. Greenfield investments, economic complexity, and financial inclusion-environmental quality nexus in BRICS countries: Does renewable energy transition matter? Gondwana Research 117:139–54. doi:10.1016/j.gr.2022.12.020
- Zhao, H., and B. Lin. 2019. Will agglomeration improve the energy efficiency in China’s textile industry: Evidence and policy implications? Applied Energy 237:326–37. doi:10.1016/j.apenergy.2018.12.068
Appendices
Table A1. Province differences in energy input efficiency.
Table A2. Average energy input efficiency index by periods.
Table A3. Average energy input efficiency index and its rank by periods.