

ABSTRACT
Energy generation involves intricate engineering processes that directly and indirectly produce carbon dioxide emissions. Sustainable energy production through bioprocessing has recently garnered increased attention. However, due to the intricacies of these technologies, there is a pressing need to develop numerical models capable of assimilating chemical, biological, and physical parameters. Such models play a vital role in simulating bioenergy production processes and optimizing the desired production yields, facilitating the transition toward industrial-scale bioenergy production. This work seeks to delineate and examine appropriate mathematical models for deployment in bioenergy production processes. These models serve multiple critical functions, including estimation, comprehension, and optimization of the response, identification of inhibitory effects, determination of more efficient and reliable operational conditions, and interpretation of the significance of the kinetic parameters of the chosen models.
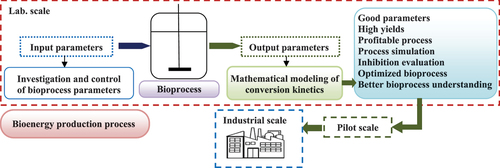
GRAPHICAL ABSTRACT
Symbols list
| α’ | = | Growth associated coefficient |
| β’ | = | Non-growth associated coefficient (h−1) |
| β0 | = | Intercept |
| βi | = | Coefficients variables (i = 1, 2…,) |
| λj | = | Lag-phase time for the production of each species j (h) |
| μ | = | Specific growth rate (h−1) |
| μm (or μmax) | = | Maximum specific growth rate in the exponential phase (h−1) |
| νi,j | = | Stoichiometric coefficient of the component j involved in the process i (catabolism and anabolism reactions) |
| ρT,i | = | Specific rate of mass transfer of gas i |
| A | = | Ratkowsky parameter (mL 0.5/°C) |
| ai | = | predictor variables |
| b | = | Ratkowsky parameter (1/°C) |
| Bx | = | Contois constant |
| Ci | = | Inhibitor concentration (mmol L−1) or (mg L−1) |
| e | = | Euler’s number (2.718) |
| Ea | = | Activation energy for cell growth |
| Ea,P | = | Activation energy for bioenergy production |
| Eb | = | Inactivation energy for cells decay |
| F | = | volumetric flow or feeding rate (m3/d) |
| I | = | Light intensity (W/m2) |
| I0 | = | Light intensity (μE m−2s−1) for which μ takes the value of 0 for any large enough value of X. |
| Im | = | Maximum light intensity (μE m−2s−1) |
| In | = | inhibition functions |
| j | = | Species: Pi, products; X, cell biomass, S, substrate (g. L−1); P, bioenergy (ml L−1) |
| kα | = | Adjustment constant |
| kd | = | Endogenous decay coefficient (h−1) |
| Kh | = | Hydrolysis constant |
| Ki, j | = | Inhibition constant for each species j (mmol L−1) |
| KI, J | = | Light saturation constant for each species J (m2/W) |
| km | = | Dissociation constant (g. L−1) represents the substrate concentration required to achieve 50% of the maximum specific substrate degradation rate |
| Ks, j | = | Monod half-velocity constant or half-saturation constant for each species j (g. L−1) |
| KsIatt | = | Half-saturation constant of attenuated light (μE m−2s−1) |
| m and m’ | = | Shape parameter or mathematical constant |
| ms | = | Maintenance coefficient (g. gcell−1) |
| N | = | Observed data points |
| n | = | Constant for Luong model which accounts for the relationship between µ and S |
| Pi | = | Aqueous products formation (g L−1) |
| Pmax | = | Maximum bioenergy production potential (ml L−1) |
| q j,max | = | Maximum specific production rate of each space j (mL g cell −1 h−1) or (g. g cell−1 h−1) |
| qp,i | = | Specific bioenergy production rate in the presence of inhibitor (mL g cell −1 h−1) |
| qp,i0 | = | Initial velocity in the absence of inhibitor (mL g cell −1 h−1) |
| R2 | = | Regression coefficient |
| Rj | = | kinetic rates for each species (negative if consumed) (g L−1.h−1) |
| Rj,max | = | Maximum production rate of each space j (mL/L.h) (g L−1h−1) |
| Roverall | = | Overall volumetric bioenergy production rate (mL L−1.h−1) |
| RMSE | = | Root Mean Square Error |
| S0 | = | Initial substrate concentration (g. L−1) |
| Sc | = | Characteristic threshold concentration or Maximum inhibitory concentration of S (g L−1) |
| Smin | = | Limited nutrient concentration (g. L−1) |
| SSreg | = | Sum of the squares of the distances of the points from the best-fit curve determined by nonlinear regression |
| SStot | = | Sum of the square of the distances of the points from a horizontal line via the designation of all Y values |
| t | = | Fermentation time (h) |
| T | = | Temperature (Kelvin) |
| Ta | = | Reference temperature for cell growth |
| Ta,P | = | Reference temperature for enzyme activation |
| Tb | = | Reference temperature for cell decay |
| Tb,P | = | Reference temperature for enzyme inactivation |
| tx | = | Adjustment constant |
| V | = | Working volume of the culture (mL) or (m3) |
| Vgas | = | Reactor headspace volume (m3) |
| X’ | = | Fractional weight or the glucose consumption degree |
| X0 | = | Initial biomass concentration (g-cell L−1) |
| Xmax | = | Maximum attainable cell density (g-cell L−1) |
| y | = | Response variable |
| Yexp | = | Experimental data |
| Yj/S | = | Yield of each species j (mol H2/mol S) or (g. g−1) |
| Yj/x | = | Yield of each species j (g. g −1) |
| Ymodel | = | Estimation model |
| Yp,max | = | Maximum value of Yp |
Disclosure statement
No potential conflict of interest was reported by the author(s).