
 ?Mathematical formulae have been encoded as MathML and are displayed in this HTML version using MathJax in order to improve their display. Uncheck the box to turn MathJax off. This feature requires Javascript. Click on a formula to zoom.
ABSTRACT
Raw and waste wool were studied for the removal of heavy metal ions such as Zn(II) and Cu (II) from wastewater. Characterization of both wool samples was done by attenuated total reflection-Fourier transform infrared (ATR-FTIR) spectroscopy, X-ray photoelectron spectroscopy (XPS), and zeta potential analysis. The sorption kinetics of metal ions on wool samples was also studied, and compared with different models for adsorption kinetics and adsorption isotherms. The maximum Zn(II) sorption efficiency of 95.5% was achieved on raw wool at a contact time of 3 h and a Zn(II) concentration of 6.25 mg/l. An efficiency above 94% was obtained for Cu(II) sorption at initial concentrations of 6.25 mg/l and 12.5 mg/l after 3 h. In the case of waste wool, the maximum efficiency of Zn(II) and Cu(II) sorption was reached after 24 h at 34.4%, and after 3 h at 60.4%, respectively. The best fit for the sorption kinetics was obtained with a pseudo-second-order model, and the Redlich-Peterson isotherm represents the sorption results very well. The regeneration of raw wool and waste wool regarding Zn(II) was successful, while that of Cu(II) failed from either of the wool fibers.
摘要
研究了原毛和废羊毛对废水中Zn (II) 和Cu (II) 等重金属离子的去除效果. 通过衰减全反射傅里叶变换红外 (ATR-FTIR) 光谱、X射线光电子能谱 (XPS) 和zeta电位分析对两种羊毛样品进行了表征. 研究了金属离子在羊毛样品上的吸附动力学, 并与不同的吸附动力学模型和吸附等温线进行了比较. 在接触时间为3小时, 锌 (II) 浓度为6.25mg/l时, 原毛对锌 (II) 的最大吸附效率为95.5%. 在初始浓度为6.25mg/l和12.5mg/l的条件下, 3小时后, 铜 (II) 的吸附效率达到94%以上. 在废羊毛的情况下, 锌 (II) 和铜 (II) 的最大吸附效率分别在24小时后达到34.4%和3小时后达到60.4%. 用拟二级模型得到了吸附动力学的最佳拟合, Redlich-Peterson等温线很好地代表了吸附结果. 关于Zn (II) 的原毛和废毛的再生是成功的, 而关于Cu (II) 的再生是失败的.
Introduction
Heavy metals present in wastewater pose a major problem in water pollution. These can originate from the industries’ wastewater effluents, such as the metal industry, the leather industry, the textile industry, as well as the production of fertilizers, pesticides and mining (Babincev et al. Citation2020). Even small concentrations of heavy metals can be harmful to human health and the environment, thus, removing heavy metals from aqueous solutions is extremely important.
Wool α-keratin fibers, which form long polypeptide chains, have unique physical and chemical properties that make them extremely versatile. In this respect, wool fibers are chemically quite different from the predominant textile fiber cotton, which is composed of cellulose (Braaten Citation2005). Their structure is mimicked as a composite material, and consists of keratin, cortical cells, cuticular cells and a cell membrane complex (Varghese and Mittal Citation2018). The possibility of a dynamic streaming potential measurement has been explored for the characterization of protein (Norde and Rouwendal Citation1990). The rate of adsorption is significantly faster for multivalent ions in an aqueous solution. The pH dependence of the zeta potential and a shift in the isoelectric point are, thus, considered, to confirm the divalent and multivalent ion adsorption (Freudenberg et al. Citation2007).The surface zeta potential of raw and waste wool fibers was calculated from the measurement of the streaming potential, which has been largely employed to study the charging behavior of natural fibers such as cellulose (Stana-Kleinschek et al. Citation2002) and lignocellulose (Bismarck et al. Citation2002). Less information is reported on the zeta potential of protein fibers such as hair (Parreira Citation1980) or wool (Grancaric, Tarbuk, and Pusic Citation2006). Since the zeta potential results for wool fibers are rather scarce in the literature, we consider our approach of using the streaming potential measurement as a novel contribution to study the adsorption of the metal ions Cu(II) and Zn(II) on raw and waste wool fibers.
Due to the various beneficial properties of wool, there has been an increased demand for the production of surface-modified fibers with even better properties to adapt to a variety of applications (Greenwood and Kendall Citation1999). It was shown long ago that functional groups of wool are involved in the sorption reaction for the removal of toxic metal ions from contaminated water (Balkosë and Baltacioglu Citation1992), and remains an interesting topic since Cu(II) (Williams, Aderhold, and Edyvean Citation1998) and Zn(II) were bound to carboxyl groups in the cross chains of the protein (Babincev et al. Citation2020). A huge amount of waste and unusable wool is discarded and the challenge is to recycle or reuse it, due mainly to restricting the environmental issues. Globally, an estimated amount of 100,000 t of waste wool is produced annually (Su et al. Citation2020). The textile industry generates a considerable amount of waste woolduring weaving (Aluigi et al. Citation2013), that also represent problematic wastes, which is mostly burned or landfilled. The latter causes damage to the soil, plants and humans (Kyere et al. Citation2018). Thus, improper disposal of these biological wastes contributes to environmental damage and the transmission of diseases, and, therefore, these methods are largely banned. (Tesfaye, Sithole, and Ramjugernath Citation2017). For this reason, and due to the growing interest for sustainable use of natural resources, ensuring complete recycling of waste wool is of great interest. Su et al. (Citation2020) have shown that glutathione can degrade wool fibers effectively by reducing the disulfide bonds. In another study, the enzymatic treatment of wool was investigated to degrade wool fibers selectively. (Navone et al. Citation2020). A complete removal of wool fibers was achieved from textile blends. Keratin hydrolyzate has also been incorporated as a foaming agent in dyeing processes for cotton and wool fibers (Bhavsar et al. Citation2017). Novel methods for the extraction of the protein keratin were recently considered and exploited for the conversion into a number of high-value biomaterials and bio-products for various applications in the medical, pharmaceutical, cosmetic, textile, plastics and packaging industries (Tesfaye, Sithole, and Ramjugernath Citation2017). In order to avoid such complexity and high cost, it is extremely interesting to use (in a cycle) waste wool further as it is. In this regard, waste wool as a cleaning or sorbent agent can have an environmentally friendly and costly perspective with fairly simple application.
In this study, we thus aimed at comparing the efficiencies of raw wool and waste wool for the removal of Zn(II) and Cu(II) from effluents. Raw and waste wool samples were characterized aiming at determining the surface properties as an elemental composition using ATR FTIR, XPS, and charge behavior by zeta potential, which was further related to their sorption ability for Zn(II) and Cu(II) ions. A comprehensive sorption analysis was carried out to demonstrate the potential of waste wool compared to raw wool as a sorbent for the removal of metal ions, with the aim of reusing the waste wool rather than disposing of it.
Materials and methods
Raw and waste wool sample preparation
Raw wool (RW), purchased by the Slovene company Soven, contains fats and many other ionic impurities. It was, thus, treated with 0.001 M HCl in order to remove the impurities of the RW and waste wool (WW). The wool was then washed with deionized water to obtain constant conductivity. The sample was dried in an oven at 40°C overnight, and the dried wool was cut into small pieces.
Characterization of the wool
ATR FTIR was used for the characterization of the RW and WW. A Perkin Elmer Spectrum GX NIR FT – Raman spectrometer (Waltham, USA) was used, equipped with an ATR diamond crystal. All spectra were recorded at an ambient temperature over an interval between 650 to 4000 cm−1.
X-ray photoelectron spectroscopy (XPS) was used to analyze the difference in the chemical composition between the RW and WW. The XPS analysis was performed with an XPS spectrometer, PHI-TFA 5600 XPS (Physical Electronics Inc., USA). The base pressure in the XPS chamber was 6.10−8 Pa. The samples were excited by X-rays with a monochromatic Al Kα1.2 radiation of a photon energy of 1486.6 eV (at 200 W). The diameter of the analysis area was 400 μm. Detection of energy of the emitted photoelectrons was performed by a hemispherical analyzer positioned at an angle of 45°. The survey-scan spectra were acquired at a pass energy of 187.85 eV, whereas for carbon C1s, individual high-resolution spectra were taken at a pass energy of 23.5 eV with a 0.1 eV energy step. An additional electron gun was used for neutralization of the electron charge during the measurements. All spectra were referenced to the main C1s peak of the carbon atoms, which was assigned a value of 284.8 eV. The elemental composition was calculated from the survey spectra. The concentration of different chemical states of carbon in the C1s peak was determined by fitting the curves with symmetrical Gauss-Lorentz functions. The widths of the peaks were fixed during the fitting procedure.
The surface and interfacial charges at the wool fiber-water interfaces were investigated by measurements of the streaming potential with the instrument SurPASS 3 (Anton Paar GmbH, Austria). The streaming potential results were then used to calculate the surface zeta potential. The zeta potential is supposed to complement the results obtained for the adsorption kinetics and adsorption equilibrium analyses (Luxbacher Citation2018). Approximately 500 mg of either RW or WW were inserted into the cylindrical compartment of the sample holder (cylindrical cell) to prepare a compressed sample plug. The pH dependence of the zeta potential was determined by using aqueous KCl solutions at different ionic strengths (0.001 mol/l, 0.003 mol/l, 0.01 mol/l) and 0.05 mol/l HCl and 0.05 mol/l KOH, respectively, for pH adjustment. To investigate the adsorption of the metal ions Zn(II) and Cu(II), aqueous solutions of CuSO4 x 5 H2O and ZnSO4 x 7 H2O with a concentration of 0.025 mol/l (ionic strength 0.1 mol/l) were prepared as stock solutions.
Atomic absorption spectroscopy (AAS) was performed by using a Perkin Elmer 3110 spectrophotometer. The concentration of Zn(II) and Cu(II) ions was determined based on the calibration curves in a range from 0 mg/L to 4 mg/L. AAS measures the content of Zn(II) in the medium at a wavelength of 213.9 nrm and of Cu(II) at a wavelength of 324.8 nm. Each measurement was done in triplicate, and the average value is reported.
Sorption process of heavy metal ions on wool fibers
Sorption was performed at concentrations of 6.25 mg/l, 12.5 mg/l, and 25 mg/l Zn(II) or Cu(II) at pH 7. In an Erlenmeyer flask, we added 0.2 g of each RW to 20 ml of a solution of Zn(II) or Cu(II) at the corresponding concentration. The sorbent solutions were stirred on a shaker at 240 rpm and at room temperature for 1 h, 3 h, 5 h and 24 h, respectively. The supernatant was then separated, and the RW was stored at room temperature. The Zn(II) or Cu(II) concentrations were determined for the prepared samples by the AAS method. EquationEquation 1(1)
(1) was used to calculate the removal efficiency η of metal ions from the solution (%), where c0 is the initial and ce is the equilibrium concentration of metal ions in the sorbent solution (mg/l). The adsorption capacity of metal ions qe on wool (mg/g) was determined by EquationEquation 2
(2)
(2) , where mv represents the mass of the sorbent and Vr represents the volume of the metal ion solution.
The sorption kinetics of Zn(II) and Cu(II) ions were described by the pseudo-first order (EquationEquation 3(3)
(3) ) and pseudo-second order (EquationEquation 4
(4)
(4) ) kinetics models. The pseudo-first order model assumes that the adsorption is controlled by diffusion, while the pseudo-second order model assumes that the adsorption is controlled by chemisorption (Sen Gupta and Bhattacharyya Citation2011). qe and qt represent the concentration of sorbed metal ions per unit of sorbent (mg/g) in equilibrium, and at time (t), and k1 (h−1) and k2 (g/(mg h)) are constants of the pseudo-first order and of the pseudo-second order (Sen Gupta and Bhattacharyya Citation2011).
The Redlich – Peterson model is a hybrid isotherm containing the Langmuir and Freundlich isotherms. As a result, the adsorption mechanism does not follow an ideal single-layer adsorption (Barkhordar and Ghiaseddin Citation2004). Here (mg/g) is the equilibrium capacity of zinc (copper) ions,
(mg/l) represents the final concentration of metal ions in the solution, n is the exponent of the Redlich-Peterson model, and KRP (l/g) is the isothermal constant. The linear form is represented by EquationEquation 5
(5)
(5) (Ayawei, Ebelegi, and Wankasi Citation2017; Belhachemi; Belhachemi and Addoun Citation2012).
Regeneration
After sorption, the wool fibers were washed with deionized water to remove the metal ions that did not bind to the sorbent surface, and dried in an oven at 60°C for 1 h. Desorption was then performed with a 0.01 mol/l EDTA solution, where 0.1 g of wool was mixed with 100 ml of the EDTA solution. Desorption was performed in four repetitive cycles after 4 h. After desorption, the wool was washed with deionized water and dried for 1 h at 60°C . 0.2 g of wool sample was mixed with 20 ml of Zn(II) or Cu(II) solution at the selected concentration (6.25 mg/l) at the appropriate pH and contact time. Afterward, the remaining metal concentration was measured by the AAS method. The desorption percentage D (%) was calculated by EquationEquation 8(8)
(8) , where cD is the desorbed concentration of metal ions (mg/l) and cS is the sorbed concentration of metal ions (mg/l) (Ki et al. Citation2007)
Results and discussion
Characterization of wool
ATR FT-IR spectroscopy
RW has three main functional groups, which are the carboxyl group (–COOH) (Hanoar et al. Citation2012), the amino group (–NH2) and the hydroxyl group (–OH) (Zargarkazemi et al. Citation2015). shows a broad signal at 3279.75 cm−1, indicating an N-H bond, the presence of NH2 groups (arginine and lysine), and an O-H bond, the presence of – OH groups (serine, threonine and tyrosine) (IR spectroscopy). The signals at 1630.74 cm−1 and 1515.67 cm−1 indicate the -CONH2 bond (asparagine and glutamine) and the CONH- (peptide chain) bond. Between 1450 cm−1 and up to 1400 cm−1 the signal indicates a bond for COOH (aspartate and glutamate), and between 1100 cm−1 and 1000 cm−1 there is a signal for the bond -CH3 (alanine, valine, leucine, and methionine) (El-Sayed, Salama, and Kantouch Citation2015).
Figure 1. ATR FTIR transmission spectra of raw wool (blue) and of waste wool (black).
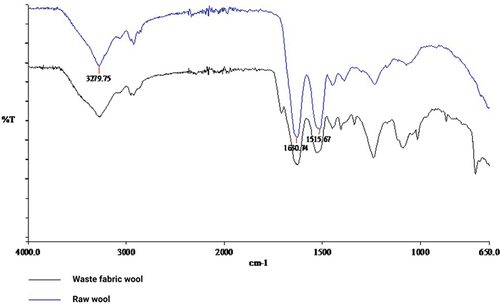
The WW had similar signals as RW. From we can see the signal of RW at 3279.75 cm−1 and in the WW, which indicates the N-H bond. The same signals as for RW at 1630.74 cm−1 and 1515.67 cm−1 were also observed for the WW, which indicates the – CONH2 bond and the -CONH bond. An identical signal in both WW and RW was also observed in the range between 1100 cm−1 and 1000 cm−1. An N-H tail, characteristic of primary and secondary amines was observed at 740 cm−1 (Wang et al. Citation2013).
XPS characterization
shows the XPS survey spectra of the RW and WW. It can be observed that O and C are the predominating peaks in the spectra, followed by N, proving that RW consists mostly of proteins. Other elements, such as S, that may also be a component in proteins, and Si, were also detected, but in very small quantities. The concentration of elements as deduced from the spectra in are shown in . The WW had a lower C content (69.4%) when compared to the degreased RW (74.8%), and a higher O content (21.3%) than RW (14%). However, we found a lower percentage of N content in WW of 4.5%, whereas, in RW, the share of N was almost 8.4%. A lower value of nitrogen in the WW was expected, due to rinsing the wool thoroughly with HCl in order to remove the major impurities.
Figure 2. XPS spectrum of raw wool (a) and waste wool (b).
Table 1. Elemental composition of raw wool and waste wool (%)
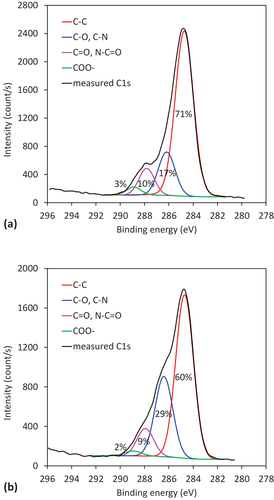
Contrary to XPS, the ATR FTIR analysis did not show any difference in the composition of the RW or WW; however, this may be explained by the different sampling depths of both methods. Because XPS is much more surface sensitive (the detection depth is in the range of just a few nm), we examined the XPS high-resolution carbon spectra of RW and WW additionally, to check the presence of possible binding sites (i.e. COOH groups) for heavy metal ions. Therefore, a comparison of high-resolution carbon spectra for Rw and WW are shown in more detail in . The spectra show the presence of four subpeaks, positioned at binding energies of 284.8 eV, 286.3 eV, 287.8 eV and 289 eV. The first peak corresponds to C-C bonds. The second peak is attributed to C-O and C-N bonds, and the third peak to the presence of C = O or N-C = O bonds. The last peak corresponds to COOH groups. This composition is in agreement with the expected wool composition, because they are composed of protein fibers. The content of all four types of groups is also shown in the high-resolution spectra in . The higher content of COOH groups for RW in comparison to WW, which indicates that we can expect better sorption properties of the RW, is shown in .
Figure 3. Carbon C1s peak of the XPS spectrum for raw (a) and waste wool (b).
Zeta potential
shows the pH dependence of the zeta potential for RW and WW at different ionic strengths of the aqueous KCl solution. Independent of the ionic strength, the isoelectric points (IEP) for both Rw and WW are located at pH 2.5. A closer look at the individual IEPs for each measurement indicates a marginal difference for RW (IEP 2.6 ± 0.1) and WW (IEP 2.3 ± 0.2). What is significant, however, is the difference in the negative plateau value of the zeta potential above pH 5. For a given ionic strength of the aqueous KCl solution, either 0.001 mol/l or 0.003 mol/l, the difference in the zeta potential (e.g., at pH 6) is approximately 20 mV. The evolution of the (negative) zeta potential with increasing the ionic strength of the aqueous KCl solution is representative for the streaming potential measurement of a permeable sample plug (Luxbacher Citation2018)
Figure 4. pH dependence of the zeta potential for raw wool fibers and waste wool at different ionic strengths of an aqueous KCl solution.
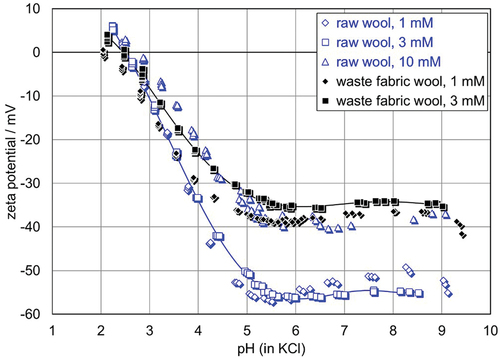
The difference in the plateau regions of the zeta potential for RW and WW is determined primarily by the higher hydrophilicity of the fibers. It seems that RW tends to be hydrophobic, which was to be expected. Also, when dyeing wool, the wool is pre-treated, which, together, results in greater hydrophilicity of this type of dyed wool. Since the WW was colored, a contribution of the charge of the dyestuff to the surface zeta potential may not be excluded a priori. Furthermore, the higher surface concentration of basic groups for WW may contribute to the observed shift in the zeta potential to a less negative plateau value.
Sorption experiment results
shows the effect of Zn(II) ion adsorption on the zeta potential of WW. The adsorption of 6.5 mg/l Zn(II) was performed at pH 6–7, followed by drying and re-soaking the sample in the aqueous 0.003 mol/l KCl solution. To reduce the effect of rinsing by the measuring solution and the removal of reversibly bound Zn(II) ions, the pH dependence of the zeta potential was first started at the native pH 4.9 of the aqueous KCl solution (, denoted #1) after a couple of rinse cycles (to establish equilibrium conditions). Obviously the application of Zn(II) ion adsorption has acidified the fibers’ surfaces. In the range of pH 3–5 the zeta potential increased almost linearly with decreasing pH. This evolution of zeta potential with pH is similar to the observed changes for the untreated WW, although the IEP after Zn(II) ion adsorption was shifted to a slightly higher pH of 2.8. After rinsing with an apparently sufficient amount of deionized water and exchanging the aqueous 0.003 mol/l KCl solution, the pH titration was continued toward the alkaline range (, denoted #2). The equilibrium pH of the initial measurement was shifted to an even lower pH of 4.4. The WW offers a high capacity for ion exchange, and retains some acid of the preceding measurement. The shift in the negative zeta potential at pH 4.4 from ζ = – 30 mV for the first titration to ζ = – 23 mV for the second titration, suggests a possible wrong assignment of the pH measured in the bulk aqueous solution to the zeta potential at the wool-water interface. However, the observation of the buffer capacity, which was superimposed on the pH dependence in the range of pH 4.4–5.1 (indicated by the high frequency of the zeta potential data), confirms an acidification of the WW during the first titration to a low pH. For the repetitive measurement the initial pH was adjusted to pH 8.5, and the titration was performed in a single measurement sequence. The range of pH where WW demonstrated the highest buffer capacity coincided with that for untreated WW (pH 5–6), but the IEP overlapped with that of WW after Zn(II) ion adsorption.
Figure 5. pH dependence of the zeta potential for waste wool after adsorption of Zn(II) ions. The zeta potential of the untreated waste wool is shown for comparison.
Figure 6. pH dependence of the zeta potential for raw wool fibers after adsorption of Zn(II) ions (a) and of Cu(II) ions (b). The zeta potential results for untreated raw wool and for raw wool after Zn(II) ion adsorption are shown for comparison.
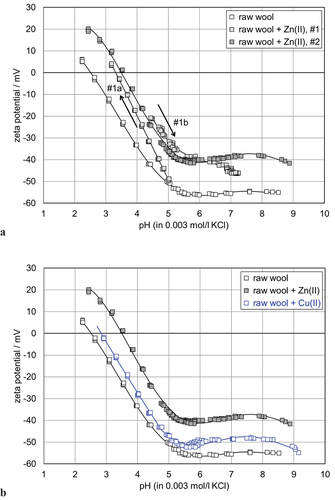
For RW we found a similar, but still different, behavior for the pH dependence of the zeta potential after adsorption of Zn(II) ions. shows clearly the shifts in the zeta potential and in the IEP for the first titration, from an apparently neutral (pH 5) to an acidic pH for RW, with adsorbed Zn(II) ions compared to the untreated RW. For the subsequent titration to higher pH after extensive rinsing with deionized water and exchange of the aqueous 0.003 mol/l KCl solution, we found an increase in the zeta potential and a shift in the pH range of significant buffer capacity of the RW. The repetitive titration for the second batch of RW after Zn(II) ion adsorption was again started in the alkaline range, and revealed a zeta potential (and IEP) in between the first and second runs for RW. For RW we can clearly see the presence of the divalent Zn(II) cations still attached to the surface, even after drying, re-soaking and repeated rinsing of the sample.
For RW we also tested the effect of Cu(II) ion adsorption. shows that the Cu(II) ions that remained adsorbed on the RW after drying, re-soaking and rinsing in dilute aqueous solutions, had little effect on the zeta potential. The titration curve was shifted in between those of the untreated RW and the RW after Zn(II) ion adsorption, with closer proximity to the RW.
In summary, it seems that RW shows a higher affinity toward Zn(II) ion adsorption than WW, and that the adsorption of Zn(II) ions is preferred compared to Cu(II) ions. However, when drawing this conclusion, we do not know the efficiency of metal ion desorption during the pre-soaking of the treated wool samples, the initial rinsing of the samples in the measuring cell to adjust the permeability, and the “rinsing” of the samples during the streaming potential measurement. Thus, we continue with detailed and quantitative sorption experiments.
shows the metal ion sorption efficiencies as a function of time for the RW. It is immediately noticeable that the sorption efficiency increased with time until it reached the equilibrium. An equilibrium for Zn(II) was reached only at a concentration of 6.25 mg/l after 5 h, at which point we achieved 95.9% efficiency, consuming almost all of the available Zn(II) ions in the solution. An equilibrium was not reached with 12.5 mg/l and 25 mg/l Zn(II), respectively, due to the excessive concentration of Zn(II) relative to the free binding sites of the deprotonated amino groups. After 24 h, the removal efficiency was 74.3% for a concentration of 12.5 mg/l Zn(II), and 58.6% for a concentration of 25 mg/l Zn(II).
Figure 7. Sorption efficiency of raw wool (a) and waste wool (b) for metal ions Zn(II) and Cu(II) as a function of sorption time and metal ion concentration.
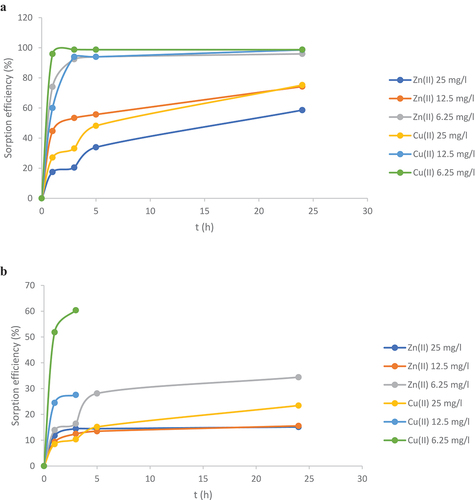
From the results shown in , the sorption efficiency of Cu(II) increased with time, and equilibrium was reached after 3 h at the concentrations of 6.25 mg/l and 12.5 mg/l Cu(II). The efficiency was above 94% for both concentrations. The lowest efficiency of sorption with Cu(II) was 74.2% with 25 mg/l Cu(II) after 24 h. Compared to the sorption of Zn(II), we achieved better sorption efficiency of Cu(II) on the degreased fibers.
shows the efficiency of the Zn(II) and Cu(II) sorption on WW as a function of time. The efficiency was again increasing with time. For Zn(II), equilibrium was reached at all concentrations after 5 h. The highest sorption efficiency was achieved at a concentration of 6.25 mg/l after 24 h, i.e., 34.4%. At 25 mg/L Zn(II) we only achieved 15% efficiency. Compared to RW, the efficiency of WW was significantly lower, which can be attributed to the lower proportion of specific binding sites (Ayawei, Ebelegi, and Wankasi Citation2017), the addition of dyes on the WW, and the presence of various processing chemicals in the WW that can prevent metal ion binding. (Babincev et al. Citation2020). shows that the efficiency of Cu(II) sorption increased with time and steady-state was reached after 3 h at two concentrations, 6.25 mg/l and 12.5 mg/l . The efficiency was 60.4% at 6.25 mg/l Cu(II) and 27.6% at 12.5 mg/l Cu(II). At a concentration of 25 mg/l Cu(II) steady-state was reached after 5 h with a sorption efficiency of 15.2%. We achieved better sorption on WW with Cu(II) than with Zn(II).
The equation for the pseudo-first order kinetics does not describe the sorption results well, as seen from . The sorption kinetics of Zn(II) and Cu(II) on RW and WW are described better by the pseudo-second-order model (Sen Gupta and Bhattacharyya Citation2011). Since the pseudo-second-order kinetics assume the sorption of metal ions on the sorbent surface by chemical rather than by physical forces, we conclude that functional groups such as amino and carboxylic acid are involved in the sorption of metals; i.e. through complexation of Zn(II) and Cu(II) ions with the protonated amino groups and deprotonated carboxylic acids. Moreover, a metal ion can also bind to OH groups in a coordination complex. (Al-Sogair et al. Citation2011).
Table 2. Sorption kinetics parameters for sorption of Zn(II) and Cu(II) on raw wool and waste wool at pH 7
The application of the Redlich-Peterson model, which incorporates elements from both the Langmuir and Freundlich isotherms, revealed a fit coefficient higher than 0.9936 (), which suggests that this model is suitable to describe the sorption results. The Redlich-Peterson isotherm equation is used mainly to explain the sorption mechanism as a mix of chemisorption and physisorption, and does not follow ideal monolayer adsorption (Brouers and Al-Musawi Citation2015). Quite often it is explained by the formation of a monolayer with multisite interaction phenomena at the same time (Ramadoss and Subramaniam Citation2019).
Table 3. Redlich-Peterson model for the sorption of Zn(II) and Cu(II) on raw and waste wool at pH 7
Regeneration results
The desorption efficiency of Zn(II) reached 90% in all four cycles for RW. This result promises the possibility of multiple sorption cycles without losing the high Zn(II) removal efficiency. The desorption of Cu(II) from the RW was not very effective. After the first cycle and 4 h we achieved a desorption of only 10.69%. Additional cycles were not performed, due to this low desorption value. Probably due to the strong binding of Cu(II) to the sorbent, we did not break this bond successfully by complexation with 0.01 M EDTA. The presence of crosslinking and impurities of RW may further hinder the desorption of Cu(II) ions from RW. From the obtained results, we conclude that RW is not suitable as a renewable material for Cu(II) sorption. The highest desorption of Zn(II) from WW with 78.56% was achieved after 4 h in the first cycle. Further desorption of Zn(II) in the second cycle was also successful. In the third cycle, however, the desorption was only 6.91%. WW can, thus, be used repeatedly to remove Zn(II) from wastewater. We were not as successful in removing Cu(II) from the WW as in removing Zn(II). Similarly to RW, the desorption efficiency was only 9.89%. Due to the similarity between the removal efficiencies of Cu(II) in RW and WW, we assume that Cu(II) binds more strongly on the RW surface than Zn(II), which was reported in another study (El-Sayed, Salama, and Kantouch Citation2015). The low desorption efficiency may be due to the use of EDTA only, as it does not replace or displace metal ions on RW. The low desorption efficiencies of WW and RW may be due to the loss of some electrically active sites during the desorption process with EDTA (Hanoar et al. Citation2012), and the irreversible transition of metal ions into metal oxides.
Conclusion
The efficiencies of RW and WW for the removal of Zn(II) and Cu(II) from effluents was studied by a combination of a solution-depletion method with the analysis of the surface zeta potential. The Redlich-Peterson isotherm equation describes the adsorption of Zn(II) and Cu(II) onto wool samples best. Based on the adsorption results, we can confirm that RW and WW are effective and sustainable sorbents for removing Zn(II) and Cu(II) from wastewater. Zn(II) adsorption onto RW and WW was strong, however, Cu(II) bound more strongly on the surface of wool than Zn(II). The zeta potential results reveal a stronger affinity of Zn(II) RW compared to WW, which complements the sorption efficiency experiments. Furthermore, the zeta potential of RW was affected more strongly by the sorption of Cu(II) than the zeta potential of WW by the sorption of Zn(II). Again, the sorption kinetics` data support this result. The parallel assessment of metal ion depletion in solution and the changes in the zeta potential of wool upon metal ion adsorption, looks promising for the characterization of the efficiency of sorbent materials for heavy metal ion removal. Such effective recycling of wool fibers will drive the textile industry toward a circular economy model.
Acknowledgments
The authors acknowledge Anja Petek for assistance in atomic absorption spectroscopy.
Disclosure statement
No potential conflict of interest was reported by the author(s).
Additional information
Funding
References
- Al-Sogair, F. M., B. P. Operschall, A. Sigel, H. Sigel, J. Scnabl, and R. K. O. Sigel. 2011. Probing the metal-ion-binding strength of the hydroxyl group. Chemical Reviews 111 (8):4964–5003. doi:10.1021/cr100415s.
- Aluigi, A., A. Corbellini, F. Rombaldoni, and G. Mazzuchetti. 2013. Wool-derived keratin nanofiber membranes for dynamic adsorption of heavy-metal ions from aqueous solutions. Textile Research Journal 83 (15):1574–86. doi:10.1177/0040517512467060.
- Ayawei, N., A. N. Ebelegi, and D. Wankasi. 2017. Modelling and Interpretation of adsorption isotherms. Journal of Chemistry 2017:1–11. doi:10.1155/2017/3039817.
- Babincev, L., D. Gurešić, N. Drašković, and S. Jović. 2020. Measurement of heavy metals in industrial wastewater by filters based on perlon and wool. Journal of Water Process Engineering 37:101354. doi:10.1016/j.jwpe.2020.101354.
- Balkose, D. and Baltacioglu, H. (1992) Adsorption of heavy metal cations from aqueous solutions by wool fibers. Journal of Chemical Technology & Biotechnology 54: 393–397 https://doi.org/10.1002/jctb.280540414.
- Barkhordar, B., and M. Ghiasseddin. 2004. Comparision of Langmuir and Freundlich Equilibriums in Cr, Cu and Ni Adsorption by Sargassum. Iranian Journal of Environmental Health Science Engineering 1 (2): 58–64.
- Belhachemi, M., and F. Addoun. 2012. Adsorption of congo red onto activated carbons having different surface properties: Studies of kinetics and adsorption equilibrium. Desalination and Water Treatment 37 (1–3):122–29. doi:10.1080/19443994.2012.661263.
- Bhavsar, P. S., M. Zoccola, A. Patrucco, A. Montarsolo, R. Mossoti, R. G. Rovero, M. Giansetti, and C. Tonin. 2017. Superheated water hydrolyzed keratin: A new application as a foaming agent in foam dyeing of cotton and wool fabrics. ACS Sustainable Chemistry & Engineering 4 (12):6722–31. doi:10.1021/acssuschemeng.7b02064.
- Bismarck, A., I. Aranberri-Askargorta, J. Springer, T. Lampke, B. Wielage, A. Stamboulis, I. Shenderovich, and -H.-H. Limbach. 2002. Surface characterization of flax, hemp and cellulose fibers; Surface properties and the water uptake behavior. Polymer Composites 23 (5):872–94. doi:10.1002/pc.10485.
- Braaten, A. W. 2005. Wool. In Encyclopedia of clothing and fashion, ed. V. Steele, Vol. 3. 441-443. Thomson Gale. Farmington Hills, MI: Charles Scribner’s Sons.
- Brouers, F., and T. J. Al-Musawi. 2015. On the optimal use of isotherm models for the characterisation of biosorption of lead onto algae. Journal of Molecular Liquids 212:46–51. doi:10.1101/017426.
- El-Sayed, A. A., M. Salama, and A. A. M. Kantouch. 2015. Wool micropowder as a metal ion exchanger for the removal of copper and zinc. Desalination and Water Treatment 56 (4):1010–19. doi:10.1080/19443994.2014.941300.
- Freudenberg, U., S. H. Behrens, P. B. Welzel, M. Müller, M. Grimmer, K. Salchert, T. Taeger, K. Schmidt, W. Pompe, and C. Werner. 2007. Electrostatic interactions modulate the conformation of collagen I. Biophysical Journal 92 (6):2108–19. doi:10.1529/biophysj.106.094284.
- Grancaric, A. M., A. Tarbuk, and T. Pusic. 2006. Electrokinetic properties of textile fabrics. Coloration Technology 121 (4):221–27. doi:10.1111/j.1478-4408.2005.tb00277.x.
- Greenwood, R., and K. Kendall. 1999. Selection of suitable dispersants for aqueous suspensions of zirconia and titania powders using acoustophoresis. Journal of the European Ceramic Society 19 (4):479–88. doi:10.1016/S0955-2219(98)00208-8.
- Hanaor, D.A.H., M. Michelazzi, C. Leonelli, and C. C. Sorrell. 2012. The effects of carboxylic acids on the aqueous dispersion and electrophoretic deposition of ZrO2. Journal of the European Ceramic Society. 32 (1): 235–244 https://doi.org/10.1016/j.jeurceramsoc.2011.08.015.
- Ki, C., E. Gang, I. Um, and Y. Park. 2007. Nanofibrous membrane of wool keratose/silk fibroin blend for heavy metal ion adsorption. Journal of Membrane Science 302 (1–2):20–26. doi:10.1016/j.memsci.2007.06.003.
- Kyere, V. N., K. Greve, S. M. Atiemo, D. Amoako, I. Aboh, and B. S. Cheabu. 2018. Contamination and health risk assessment of exposure to heavy metals in soils from informal e-waste recycling site in Ghana. Emerging Science Journal 2 (6):428–36. doi:10.28991/esj-2018-01162.
- Luxbacher, T. 2018. “Standard cotton fabric as a reference material for the streaming potential measurement.” Paper presented at 9th Internatioonal textil, clothing and design conference, Dubrovnik, Croatia, December 7-10.
- Navone, L., K. Moffit, K. A. Hansen, J. Blinco, A. Payne, and R. Speight. 2020. Closing the textile loop: Enzymatic fiber separation and recycling of wool/polyester fabric blends. Waste Management 102:149–60. doi:10.1016/j.wasman.2019.10.026.
- Norde, W., and E. Rouwendal. 1990. Streaming potential measurements as a tool to study protein adsorption kinetics. Journal of Colloid and Interface Science 139 (1):169–76. doi:10.1016/0021-9797(90)90454-V.
- Parreira, H. C. 1980. On the isoelectric point of human hair. Journal of Colloid and Interface Science 75 (1):212–17. doi:10.1016/0021-9797(80)90363-X.
- Ramadoss, R., and D. Subramaniam. 2019. Removal of divalent nickel from aqueous solution using blue-green marine algae: Adsorption modeling and applicability of various isotherm models. Separation Science and Technology 54 (6):943–61. doi:10.1080/01496395.2018.1526194.
- Sen Gupta, S., and K. G. Bhattacharyya. 2011. Kinetics of adsorption of metal ions on inorganic materials: A review. Advanced Colloid Interface Science 162 (1–2):39–58. doi:10.1016/j.cis.2010.12.004.
- Stana-Kleinschek, K., V. Ribitsch, T. Kreze, and L. Fras. 2002. Determination of the adsorption character of cellulose fibres using surface tension and surface charge. Materials Research Innovations 6 (1):13–18. doi:10.1007/s10019-002-0168-4.
- Su, C., J. S. Gong, J. Qin, J. M. He, Z. C. Zhou, M. Jiang, Z. H. Xu, and J. S. Shi. 2020. Glutathione enables full utilization of wool waste for keratin production and wastewater decolorization. Journal of Cleaner Production 270:122092. doi:10.1016/j.jclepro.2020.122092.
- Tesfaye, T., B. Sithole, and D. Ramjugernath. 2017. Valorisation of chicken feathers: A review on recycling and recovery route—current status and future prospects. Clean Technologies and Environmental Policy 19 (10):2363–78. doi:10.1007/s10098-017-1443-9.
- Varghese, A. M., and V. Mittal. 2018. Surface modification of natural fibers: Biodegradable and biocompatible polymer composites. Duxford: Woodhead Publishing.
- Wang, F., P. Liu, T. Nie, H. Wei, and Z. Cui. 2013. Characterization of a polyamine microsphere and its adsorption for protein. International Journal of Molecular Sciences 14 (1):17–29. doi:10.3390/ijms14010017.
- Williams, C. J., D. Aderhold, and R. G. J. Edyvean. 1998. Comparison between biosorbents fort he removal of metal ions from aqueous solutions. Water Research 32 (1):216–24. doi:10.1016/S0043-1354(97)00179-6.
- Zargarkazemi, A., M. Sadeghi-Kiakhani, M. Arami, and S. H. Bahrami. 2015. Modification of wool fabric using prepared chitosan-cyanuric chloride hybrid. The Journal of the Textile Institute 106 (1):80–89. doi:10.1080/00405000.2014.906097.