
 ?Mathematical formulae have been encoded as MathML and are displayed in this HTML version using MathJax in order to improve their display. Uncheck the box to turn MathJax off. This feature requires Javascript. Click on a formula to zoom.
ABSTRACT
Artificial neural networks (ANN) and response surface method (RSM) modeling were used to study the effect of water absorption on the behavior of jute (JF/epoxy) and sisal (SF/epoxy) biocomposite. The specimens were laminated with short fibers of different lengths (5 mm, 10 mm, and 15 mm) of jute and sisal until saturation lasted about 25 days. The kinetic behavior of water uptake was recorded and then compared to the curves predicted by the two models. The results showed that the water absorption of the jute and sisal biocomposites was fairly lower for the 5 mm length compared to the 10 mm and 15 mm lengths. The optimized solution is attained with 1.00 desirability for 14.73 mm fiber length and 482.85 h immersion time. The RSM model error percentages were higher than the ANN model indicating better accuracy in predicting the water uptake of biocomposites by the ANN model compared to RSM. The results of this investigation offer benefits for the application of jute and sisal fiber biocomposites at the elaboration and application stage; it is easy for engineers to identify the swelling factor of these biocomposites without the need for experiments, thus avoiding costs and time.
摘要
采用人工神经网络(ANN)和响应面法(RSM)模型研究了吸水率对黄麻(JF/环氧树脂)和剑麻(SF/环氧)生物复合材料性能的影响. 用不同长度(5 mm、10 mm和15 mm)的黄麻和剑麻短纤维层压试样,直至饱和持续约25天. 记录吸水的动力学行为,然后将其与两个模型预测的曲线进行比较. 结果表明,与10 mm和15 mm长度相比,5 mm长度的黄麻和剑麻生物复合材料的吸水率相当低. 对于14.73 mm的纤维长度和482.85 h的浸泡时间,最佳溶液的期望值为1.00. RSM模型误差百分比高于ANN模型,表明与RSM相比. 本研究的结果为黄麻和剑麻纤维生物复合材料在制备和应用阶段的应用提供了益处; 工程师很容易确定这些生物复合材料的溶胀因子,而无需实验,从而避免了成本和时间.
1. Introduction
Composite materials markets are rising in virtually every region of the world and in every application sector (Boumaaza, Belaadi, and Bourchak Citation2022a). Developing these materials based on natural fibers has many advantages, such as abundant availability, lower price, non-toxicity, biodegradability, eco-friendliness, and renewability (Boumaaza, Belaadi, and Bourchak Citation2022b; Sathiyamoorthy and Senthilkumar Citation2020). Plant fibers used as reinforcement in composite materials may be considered as an interesting alternative to replace synthetic fibers, particularly glass fibers, because of their low cost. On the other hand, these fibers show non-uniformity in their original characteristics (varying diameter of the fiber and variable length), usually resulting in a dispersion of their mechanical properties (Dembri et al. Citation2022; Lekrine et al. Citation2022). In addition to being biodegradable and ecological, they have several mechanical properties that meet industrial requirements. However, the main shortcoming is their sensitivity to humidity, which affects their properties during their use in aggressive environments. The phenomena of water diffusion within composite materials have shown that polymers are subject to different aging types, reflected by changes in specific material properties. By definition, the aging of a polymer results in a slow alteration of material properties, reversible or irreversible, resulting from their own instability or the environmental effect (Belaadi et al. Citation2022). For more severe conditions (immersion, high temperature), defects may be created within the matrix and/or the fiber–matrix interface, as well as material losses (washing). These damages are irreversible after drying. The moisture influence study on the degradation of mechanical properties is essential to increase the use of natural fibers of plant origin as reinforcement in composites. These polyester or epoxy matrix composites reinforced by plant fibers, notably sisal and jute, raise more and more the health issues level and environmental (Ramesh, Palanikumar, and Reddy Citation2013). This change reduces the effect of our growing needs on the environment and improves the environmental performance of materials (Summerscales et al. Citation2010). Chianelli-Junior et al. (Citation2013) discussed sisal fibers mechanical performance and its possibilities as a reinforcement for Recycled High-density Polyethylene (RHDPE). It has been observed that there is no change in tensile and bending test properties of RHDPE with the addition of sisal fibers. However, the ductility decreases in the presence of agave sisalana. The addition of banana fibers to agave sisalana with different mass fractions ranging from 25% to 75% improved mechanical properties and water absorption resistance (Venkateshwaran et al. Citation2011).
Various water aging studies of biocomposites based on natural fibers have been conducted (Aggarwal et al. Citation2013; Alamri and Low Citation2013; Dittenber and Gangarao Citation2012; Salleh et al. Citation2012) to infer the water absorption process and the moisture effect on mechanical and chemical properties. Hossain et al. (Citation2011) performed bending tests as well as absorption tests after water aging of jute fiber-reinforced biocomposite. The tests were carried out in distilled water for up to 60 days, and the result showed a remarkable decrease in the rupture stress as well as the bending module as a function of immersion time increase. A sisal/polyester biocomposite was aged in distilled water and then characterized in tensile and impact resistance (Athijayamani et al. Citation2009). The study deduced that hydrogen bonds between water molecules and fiber cellulose cause a decrease in the material static and dynamic mechanical properties with delamination at the fiber–matrix interface. A recent work conducted by Lekrine et al. (Citation2022) to study the Washingtonia filifera (WF) fiber content effect on the diffusion kinetics of HDPE/WF biocomposites by immersion in distilled water for 21 days (500 h). Their study showed that the absorption phenomenon was rapid in the first phase of tests until reaching the saturation level after 408 h of immersion. The water absorption increases with the increase in WF fiber content and the immersion time. A study of moisture effect on the mechanical properties of the epoxy matrix and flax fiber biocomposites was conducted by Scida et al. (Citation2013) to compare two types of architectures: unidirectional and twill. The authors noted that the twill reinforcement had greater absorption kinetics than the unidirectional and showed that the water absorption at saturation was more important for this architecture type.
Other research work has shown that biocomposites exposed in a wet environment have diminished elastic and rupture properties when water diffuses into the material. This loss related to water absorption has been observed in various biocomposites, such as those based on agave sisalana (Chow, Xing, and Li Citation2007; Marsh Citation2003), bamboo (Chen, Miao, and Ding Citation2009), or flax (Duigou, Davies, and Baley Citation2009) fibers. Recently, researchers have been active in overcoming these disadvantages by studying biodegradable fibers, such as jute (Ramakrishnan et al. Citation2018), sisal (Ibrahim et al. Citation2017) and bamboo (Prasanna, Ramanathan, and Raman Citation2016), to minimize environmental problems. The analysis of these environmental aging and moisture absorption problems is crucial for the development of biocomposites. Water affects plant fibers as a plasticizing agent that causes swelling and degradation. It is clear from the literature that determining the best conditions for water absorption of natural fiber biocomposites is a difficult task. Consequently, the present investigation focuses on both determination and the optimization of the fiber length of FJ/epoxy and SF/epoxy biocomposites of the water absorption kinetics. These biocomposites will be subjected to immersion tests in distilled water to study the effects of water absorption kinetics as a function of fiber length. The statistical treatment of the results was performed by the application of the analysis of variance ANOVA. This can be accomplished with the RSM-based desirability function to find the best multi-response results for water uptake, and the results can be predicted using RSM modeling.
2. Materials and methods
2.1. Material preparation
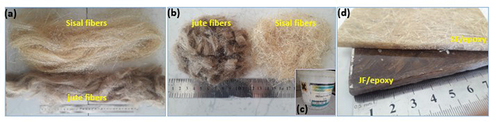
In this work, we used an epoxy resin with a density of 1.110 kg/m3; this resin is classified as MEDAPOXY STR supplied by the company GRANITEX (Algeria). The average tensile mechanical properties of this resin used in this paper were described previously (Cherief et al. Citation2020). The reinforcement materials investigated in this study were JF and SF fibers (). These fibers present a very interesting alternative, as they have the advantages of having highly competitive mechanical characteristics and being easily accessible. The constituents for this study were provided by the natural fiber cable and cord manufacturing plant in BLIDA. Three fiber lengths were chosen (5 mm, 10 mm, and 15 mm), and cut as short fibers. The biocomposites are prepared in laminate plates of 300 × 300 mm in size, with a thickness of 6 mm at room temperature (25°C) by contact molding and kept in the mold for 24 h to complete the resin polymerization. The plates obtained are left in the open air for 15 days, and then cut into samples of dimensions 40 × 40 mm using a diamond disc. Finally, the samples obtained were dried in an oven at a temperature of 65°C for 5 h.
Figure 1. (A) Sisal and jute long fibers, (b) Sisal and jute short fibers, (c) epoxy resin used in this work and (d) Biocomposites sample developed.
2.2. Water absorption tests
To measure the water absorption kinetics, tests were carried out on three series containing three samples of each fiber type. The samples have been taken from different biocomposite plates (JF/epoxy and SF/epoxy), and each plate has a different length of 5 mm, 10 mm, and 15 mm, having a volume fraction of 40%. The absorption kinetics has been characterized by immersing the samples in distilled water at room temperature (23°C) until full samples saturation. The time required to reach saturation is about 600 h, either about 16 days. The water absorption monitoring process of biocomposites consists of following over time samples mass evolution, measured at regular intervals throughout the period of immersion. At the time of mass measurement, the samples are taken out of the bath, lightly wiping them out using absorbent paper in order to remove the film of water present on their surface. Then, they are weighed before re-immersing them again. Each measurement during this process has been carried out in less than 5 min in order to limit any changes in the moisture content of the samples as much as possible. The tests were carried out according to the ASTM D1037-99 standard method at room temperature (23°C) using a precision scale of 0.0001 mg KERN PFB. During the immersion time, the gain in mass of a biocomposite sample at time t is characterized by the percentage of water absorbed (EquationEquation 1(1)
(1) ) in terms of mass (Wt) defined as the ratio of the difference between the mass of the original sample (that has never been immersed in water, that is, at t = 0 and noted m0) and mass of the samples after a given immersion time (mt) to the original mass sample (m0).
2.3. ANN modeling
The ANN modeling function is generally applied to replace the polynomial regression functions and provides a complex relationship between input and output variables. The ANN architecture includes a layer comprising the input, hidden, and output layers. These layers contain the neurons that receive the input data (Adda et al. Citation2021; Boumaaza et al. Citation2022). The number of neurons is directly related to the number of input variables, the output layer gives the results of the problem for the input values and between these two cells is the hidden layer, containing one or more layers, which is made up of neurons defining the internal activity of the network (Ighalo et al. Citation2021; Wang et al. Citation2020). Depending on the interconnection chosen, neurons are classified into two large families; the first illustrates static networks (not looped), and the second represents so-called looped dynamic networks. Neurons are interconnected by synapses that also allow for distributed parallel processing. These synapses have an essential advantage which is the ability to establish complex relationships between numerical variables without having a preconceived model (Wang et al. Citation2020). It is the training phase that offers this advantage. When the total sum of squared errors is close to zero, the ANN learning algorithm will be more efficient (Boumaaza, Belaadi, and Bourchak Citation2021; DeMuth et al. Citation2013). A multilayer feedforward neural network consisting of an input layer, hidden layers, and an output layer is used. The accuracy of the models is determined by ANN, checked by the values of correlation coefficient (R2) and the mean squared error (MSE). The values of these last two parameters the lower and positive they are, the more precise the ANN model is in the prediction. The two parameters are given by EquationEquations (2)(2)
(2) and (Equation3
(3)
(3) ) (Adeniyi, Ighalo, and Marques Citation2021).
2.4. RSM modeling
The response surface method (RSM) allows the analysis of multiple regressions by determining solutions for various linear and non-linear regression problems based on experimental data (Krishnaiah et al. Citation2015). It is a set of mathematical and statistical techniques useful for analyzing problems where several independent variables influence a dependent variable or response (Onu et al. Citation2021). This method is based on an empirical modeling process and aims at finding the relationship between input and output parameters, including water absorption and the changes in fiber length as a function of biocomposite immersion time. The response parameter values, WAS and WAJ, obtained from several experimental combinations are given in . The experimental design adopted in the present research is an orthogonal array of central composite designs (CCDs). This plan has been adopted to reduce the number of experiments. This would eventually reduce the time and cost of experiments. Two groups level is envisaged as the length of fibers (L) and the immersion time (W), with four levels in each group ().
Table 1. Experimental results for absorption of water of sisal and jute fiber biocomposite.
Table 2. Experiments design adopted in this work.
3. Results interpretation
3.1. Water absorption
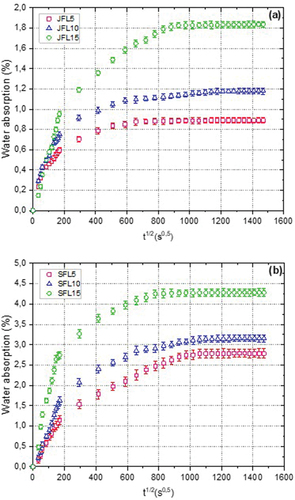
illustrates the water absorption results in weight percentage (wt.%) for the JF/epoxy and SF/epoxy biocomposites as a function of immersion time. The values shown in this figure are mean values with standard deviations based on measurements of three samples for each type of material considered. represent the progression of water uptake in JF/epoxy and SF/epoxy biocomposites, respectively, at different fiber lengths of 5 mm, 10 mm, and 15 mm. It is clear that the water uptake curves of the different biocomposites are similar and have two different water diffusion zones. In the first zone, water uptake increases proportionally as a function of the immersion time. This zone is quasi-linear for absorption values Wt less than 1% and 3% of JF/epoxy and SF/epoxy biocomposites, respectively. In the linear part of the curve, the water molecules diffusivity depends on the penetration speed of the water into the material. The second zone is non-linear until saturation, meaning that the mass gain gradually increases until the saturation level appears. The analysis also shows that JF/epoxy biocomposites are the least sensitive to water absorption compared to SF/epoxy biocomposites. The high water uptake is mainly due to the high hydrophilicity and internal structure of fibers (Célino et al. Citation2014; Komuraiah, Kumar, and Prasad Citation2014). The results obtained indicate that water absorption varies as a function of fiber length withJFL5 and SFL5 having an absorption content of 0.88% and 2.78%, which is relatively low compared to those of JFL10, JFL15, SFL10, and SFL15 (1.17%, 1.82%, 3.12%, and 4.26%, respectively). It is clear that biocomposites reinforced with sisal fibers absorb more water than those reinforced with jute fibers. The SFL15 biocomposite showed a water saturation of 4.4%, while for the HDPE/jute biocomposite, the saturation was 1.72% in the recent work of (Makhlouf et al. Citation2022). On the other hand, in the studies of (Ramesh, Palanikumar, and Reddy Citation2016a, Citation2016b), immersed sisal and jute composites and hybrid composites reinforced with sisal, jute, and glass fibers in distilled water for 5 h and 20 min. The authors found that jute and jute/glass fiber composites absorbed more water than sisal; sisal/glass fiber and sisal/jute/glass fiber composites.
Figure 2. Absorption curve of biocomposites test specimens.
3.2. ANN modeling
illustrates the ANN architecture that consists of three layers, including the input, the hidden layer, and the output. The purpose of this section is to present numerical modeling using the ANN method for the water diffusion process of the two JF/epoxy and SF/epoxy biocomposite materials. The distribution of the samples that have been used for ANN modeling is as follows: 22 for learning, 3 for validation, and 5 for testing. During this study, the Levenberg-Marquardt algorithm was chosen for ANN model training to predict the water uptake of the developed biocomposites. The network was repeatedly configured for learning once the collection of input and target data is performed. shows that the learning process stopped after 80 and 18 iterations, when the gradient recorded an optimized validation performance of 0.0014631 and 0.0038486 at the fifth iteration for the jute and sisal biocomposites, respectively (). ANN considers the stopping point as an optimal point, beyond which the validation error exceeds the tolerated thresholds. The errors generated in the network throughout training, validation, and testing have been represented using an error histogram, which is distributed over a 20-cell interval ( and ). ANN classifies the dotted lines in the diagrams as functions that are essential to achieving the objectives or as the best possible choices for constituting the data, so that the best fit is possible for each process in the network as well as for the whole network.
Figure 3. ANN architecture used in this work for (a) SF/epoxy and (b) JF/epoxy composites.
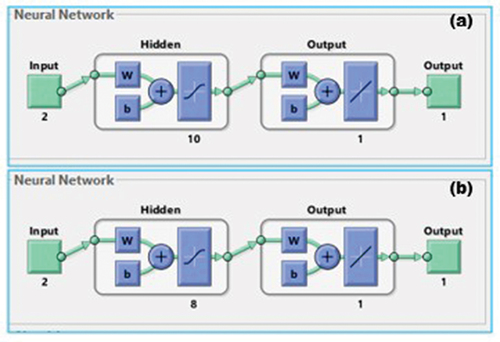
Figure 4. ANN validation, distribution of performance, training conditions, and error results for (a,c,e) SF/epoxy and (b,d,f) JF/epoxy biocomposites.
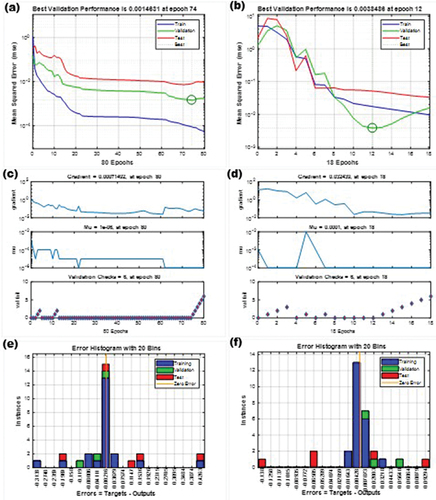
Table 3. Allocation of samples used in this study for ANN modeling.
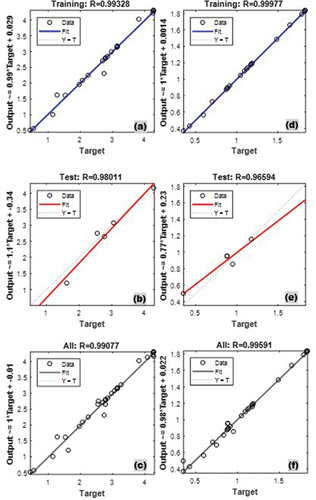
shows ANN modeling results compared to the experimental data for the SF/epoxy and JF/epoxy biocomposites during training, validation, and testing. The variability of the experimental data is illustrated by the coefficient of determination R2, which indicates the degree of the model predictions (Belaadi et al. Citation2020; Boumaaza, Belaadi, and Bourchak Citation2021). The accuracy level of the correlation for training, testing, and all the data is (0.99328 and 0.99997), (0.98011 and 0.96594), and (0.99077 and 99591) as shown in , ensuring the reliability of the model developed. Furthermore, the results of the values predicted by ANN are close to the parity threshold (); they perfectly agree with those obtained experimentally. Thus, the ANN method can reliably predict the water absorption of biocomposites.
Figure 5. ANN modeling results for (a-c) SF/epoxy and (d-f) JF/epoxy biocomposites.
3.3. RSM modeling
RSM method has been adopted to analyze the results obtained during the experiments and evaluate the contribution of fiber length and immersion time to the water absorption of the biocomposites. EquationEquations (4)(4)
(4) and (Equation5
(5)
(5) ) represent the quadratic models generated by the Design-Expert software. These are second-order mathematical equations based on RSM method for water absorption of the various biocomposites, WAS for sisal and WAJ for jute.
3.4. ANOVA analysis for water absorption
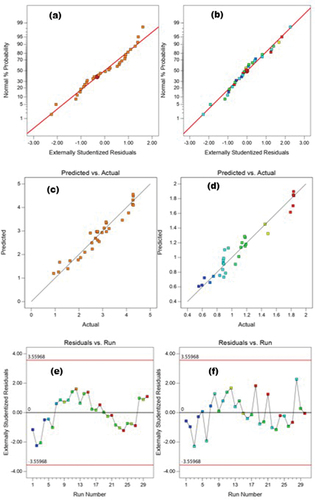
The ANOVA results in show that the quadratic model is statistically significant for the WAS and WAJ biocomposites. The p-values that are lower than 0.05 indicate the significance of the model terms. The model terms in this study, A, B, A2, and B2, were significant. Therefore, the p-values that are greater than 0.05 indicate that the model terms were significant. For values greater than 0.1000, the model terms are not significant. In the same way, the F-values of the WAS and WAJ models are 81.33 and 69.74, respectively, and the corresponding R2 values are 94.43% and 93.56%) indicating that the models are significant. The difference between the predicted and adjusted R2 values (91.02% and 88.90%, and 93.27% and 92.22%) is less than 0.2 for the WAS and WAJ models, respectively. The adequate accuracy value is the signal ratio noise. It is recommended to have a ratio higher than four. A ratio of 29.5517 and 29.4839 indicates that the signal is adequate for the two models. Therefore, the model can be used to investigate the design space. Consequently, an adequate fit between the independent factors and the responses is obtained with this regression model. The normal probability plots presented in proved the effect of minimum scattering occurred on the tendency line caused by the residual points coinciding with the normal probability. The relationship between the predicted and actual response to the biocomposite water absorption factor is presented in . The focus was on the residuals between actual and predicted values for model fit. Uniform variation in residuals was required, and the residual points were symmetrically arranged with grouping near the plot center (Rajabi et al. Citation2019) ().
Table 4. ANOVA for the quadratic response model of water uptake data.
Figure 6. Normal probability, predicted normal plot vs actual, residuals for (a,c,e) SF/epoxy and (b,d,f) JF/epoxy biocomposites.
3.5. Interaction among various parameters of the process RSM
The mapping of the response surface of water absorption of sisal and jute fiber reinforced biocomposites as a function of fiber type and immersion time is illustrated in . For the biocomposite constituting of sisal fibers, WAS was not greater than 2 when the fiber length was 5–12 mm and the immersion time was 1–108 h. In addition, WAS was greater than 4 when the fiber length was 13–15 mm and the immersion time was 110–600 h (). In the case of the biocomposite constituting of jute fibers, it was found that WAJ did not exceed 0.8 for a fiber length ranging from 5 to 11.5 mm and immersion time of 1 to 105 h. For the latter, it exceeded 1.8 when the fiber length was 13.2 to 15 mm and immersion time of 360–600 h ().
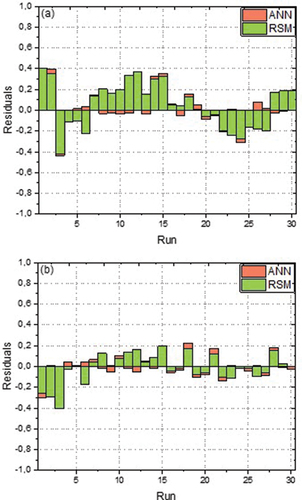
Figure 7. Water absorption data of residuals for RSM and ANN for (a) sisal/epoxy and (b) jute/epoxy biocomposites.
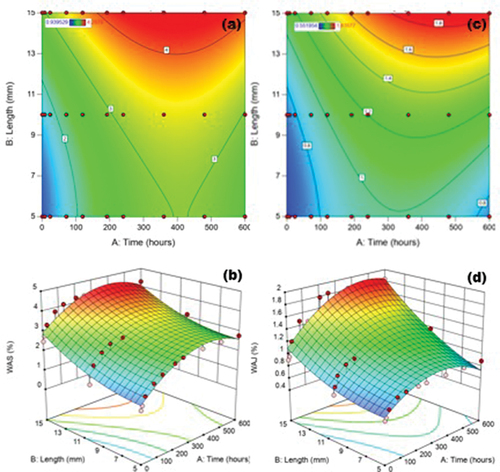
The 3D plots of the two output parameters WAS and WAJ are combined in . Again, a greater slope was found for fiber length and immersion time, revealing a significant effect on water absorption. This trend agrees with the ANOVA results reported in .
3.6. Comparison between RSM and ANN models
ANN and RSM models predicted results and experimentally observed results are shown in and . Both models adequately described the experimentally observed results, thereby providing an appropriate representation of the experimentally acquired results. However, RSM model error percentages in predicting water uptake were greater than those of the ANN model, as illustrated in , so it must be concluded that the ANN model provided higher prediction precision than the RSM model.
Table 5. Comparison between RSM and ANN approach for elaborate biocomposites.
Figure 8. Comparison between experimental and predicted RSM and ANN models water absorption data.
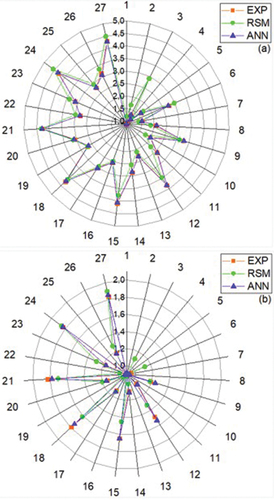
Figure 9. Desirability graph for optimization.
3.7. Optimization of biocomposites water absorption
In this context, RSM-based optimization is applied to maximize water absorption and ensure that factors are in the appropriate range (Boumaaza, Belaadi, and Bourchak Citation2021). To this end, many optimal solutions are proposed and the best solution is preferred. The optimal solution is the one that presents the highest desirability (Benzannache et al. Citation2021). The best-optimized solution is obtained when the desirability is equal to 1.00 for a fiber length of 14.73 mm and an immersion time of 482.85 h, as illustrated by the desirability ramp function ( and ).
Figure 10. Desirability graph for optimization.
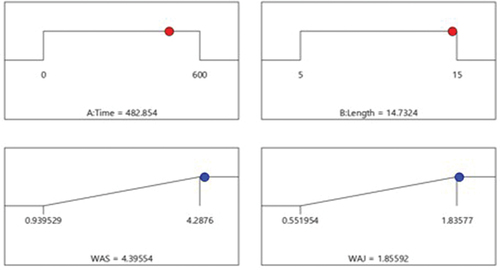
Table 6. Optimization of response parameters based on RSM.
4. Conclusion
In the current investigation, jute and sisal fibers reinforced epoxy composites laminate have been studied to evaluate the effect of fiber lengths and immersion time on water absorption in distilled water. The experimental results led to several conclusions: The water absorption was noticed to increase with the length of the fibers and the immersion time. In contrast, the adsorption process was fast at the initial stage of the experiments to achieve saturation in an immersion time of nearly 192 h. These results revealed that the biocomposites JFL5 and SFL5 showed a percentage uptake of 0.88% and 2.78%, which is comparatively lower than those of JFL10, JFL15, SFL10, and SFL15 (1.17%, 1.82%, 3.12%, and 4.26%), respectively. For biocomposites made of sisal and jute fibers, the obtained R2 values were 98.08% and 99.59%, respectively, in all the data and low MSE values (<1% by weight) revealing the developed model accuracy. The predicted ANN and RSM values agree perfectly with those obtained experimentally. However, ANN method can reliably predict the water uptake compared to the RSM of biocomposites made of jute and sisal fibers. Finally, the results of this study have positive implications in terms of cost-effectively designing sisal and jute fibers in biocomposites for future applications. As a continuation of this research, the program of experiments will investigate the fabrication of other biocomposites with different treatments of the fibers using different rates of alkaline treatment and immersion times.
Highlights
Hybrid biocomposites based on jute and sisal fibers.
Prediction of water absorption of biocomposites by varying fiber length.
Optimization using ANN and RSM approaches.
Ethics approval
The work contains no libelous or unlawful statements, does not infringe on the rights of others, or contains material or instructions that might cause harm or injury.
Disclosure statement
No potential conflict of interest was reported by the author(s).
Additional information
Funding
References
- Adda, B., A. Belaadi, M. Boumaaza, and M. Bourchak. 2021. Experimental investigation and optimization of delamination factors in the drilling of Jute Fiber–Reinforced polymer biocomposites with multiple estimators. International Journal of Advanced Manufacturing Technology 116 (9):2885–19. doi:10.1007/s00170-021-07628-9.
- Adeniyi, A. A., J. O. Ighalo, and G. Marques. 2021. Utilisation of machine learning algorithms for the prediction of syngas composition from biomass bio-oil steam reforming. International Journal of Sustainable Energy 40 (4):310–25. doi:10.1080/14786451.2020.1803862.
- Aggarwal, P. K., N. Raghu, A. Karmarkar, and S. Chuahan. 2013. Jute-polypropylene composites using m-TMI-grafted-polypropylene as a coupling agent. Materials & Design 43:112–17. doi:10.1016/j.matdes.2012.06.026.
- Alamri, H., and I. M. Low. 2013. Effect of water absorption on the mechanical properties of nanoclay filled recycled cellulose fibre reinforced epoxy hybrid nanocomposites. Composites Part A, Applied Science and Manufacturing 44 (1):23–31. doi:10.1016/j.compositesa.2012.08.026.
- Athijayamani, A., M. Thiruchitrambalam, U. Natarajan, and B. Pazhanivel. 2009. Effect of moisture absorption on the mechanical properties of randomly oriented natural fibers/polyester hybrid composite. Materials Science and Engineering A 517 (1–2):344–53. doi:10.1016/j.msea.2009.04.027.
- Belaadi, A., S. Amroune, Y. Seki, O. Y. Keskin, S. Köktaş, M. Bourchak, A. Dufresne, H. Fouad, and M. Jawaid. 2022. Extraction and characterization of a new lignocellulosic fiber from Yucca Treculeana L. Leaf as potential reinforcement for industrial biocomposites. Journal of Natural Fibers, March 1–16. doi:10.1080/15440478.2022.2054895.
- Belaadi, A., M. Boumaaza, S. Amroune, and M. Bourchak. 2020. Mechanical characterization and optimization of delamination factor in drilling bidirectional Jute Fibre-reinforced polymer biocomposites. International Journal of Advanced Manufacturing Technology 111 (7–8):2073–94. doi:10.1007/s00170-020-06217-6.
- Benzannache, N., A. Belaadi, M. Boumaaza, and M. Bourchak. 2021. Improving the mechanical performance of biocomposite plaster/Washingtonian filifera fibres using the RSM method. Journal of Building Engineering 33. doi:10.1016/j.jobe.2020.101840.
- Boumaaza, M., A. Belaadi, and M. Bourchak. 2021. The effect of alkaline treatment on mechanical performance of natural fibers-reinforced plaster: Part II optimization comparison between ANN and RSM statistics. Journal of Natural Fibers, August 1–16. doi:10.1080/15440478.2021.1964129.
- Boumaaza, M., A. Belaadi, and M. Bourchak. 2022a. The effect of alkaline treatment on mechanical performance of natural fibers-reinforced plaster: Optimization using RSM. Journal of Natural Fibers 18 (12):2220–40. doi:10.1080/15440478.2020.1724236.
- Boumaaza, M., A. Belaadi, and M. Bourchak. 2022b. Systematic review on reinforcing mortars with natural fibers: Challenges of environment-friendly option. Journal of Natural Fibers 1–25. doi:10.1080/15440478.2022.2060408.
- Boumaaza, M., A. Belaadi, M. Bourchak, M. Jawaid, and H. Satha. 2022. Comparative study of flexural properties prediction of Washingtonia Filifera Rachis biochar bio-mortar by ANN and RSM models. Construction and Building Materials 318:125985. doi:10.1016/j.conbuildmat.2021.125985.
- Célino, A., S. Fréour, F. Jacquemin, and P. Casari. 2014. The hygroscopic behavior of plant fibers: A review. Frontiers in Chemistry. doi:10.3389/fchem.2013.00043.
- Chen, H., M. Miao, and X. Ding. 2009. Influence of moisture absorption on the interfacial strength of Bamboo/Vinyl Ester composites. Composites Part A, Applied Science and Manufacturing 40 (12):2013–19. doi:10.1016/j.compositesa.2009.09.003.
- Cherief, M., A. Belaadi, M. Bouakba, M. Bourchak, and I. Meddour. 2020. Behaviour of lignocellulosic fibre-reinforced cellular core under low-velocity impact loading: Taguchi method. International Journal of Advanced Manufacturing Technology 108:223–33. doi:10.1007/s00170-020-05393-9.
- Chianelli-Junior, R., J. M. L. D. Reis, J. L. Cardoso, and P. F. Castro. 2013. Mechanical characterization of Sisal fiber-reinforced recycled HDPE composites. Materials Research 16:1393–97. doi:10.1590/S1516-14392013005000128.
- Chow, C. P. L., X. S. Xing, and R. K. Y. Li. 2007. Moisture absorption studies of sisal fibre reinforced polypropylene composites. Composites Science and Technology 67 (2):306–13. doi:10.1016/j.compscitech.2006.08.005.
- Dembri, I., A. Belaadi, M. Boumaaza, and M. Bourchak. 2022. Tensile behavior and statistical analysis of Washingtonia filifera fibers as potential reinforcement for industrial polymer biocomposites. Journal of Natural Fibers, May 1–16. doi:10.1080/15440478.2022.2069189.
- DeMuth, P. C., Y. Min, B. Huang, J. A. Kramer, A. D. Miller, D. H. Barouch, P. T. Hammond, and D. J. Irvine. 2013. Polymer multilayer tattooing for enhanced DNA vaccination. Nature Materials 12 (4):367–76. doi:10.1038/nmat3550.
- Dittenber, D. B., and H. V. S. Gangarao. 2012. Critical review of recent publications on use of natural composites in infrastructure. Composites Part A, Applied Science and Manufacturing 43 (8):1419–29. doi:10.1016/j.compositesa.2011.11.019.
- Duigou, A. L., P. Davies, and C. Baley. 2009. Seawater ageing of flax/poly(Lactic Acid) biocomposites. Polymer Degradation and Stability 94 (7):1151–62. doi:10.1016/j.polymdegradstab.2009.03.025.
- Hossain, M. K., M. W. Dewan, M. Hosur, and S. Jeelani. 2011. Mechanical performances of surface modified Jute Fiber reinforced biopolnanophased green composites. Composites Part B: Engineering 42 (6):1701–07. doi:10.1016/j.compositesb.2011.03.010.
- Ibrahim, I. D., R. E. S. TambaJamiru, W. K. Kupolati, and S. C. Agwuncha. 2017. Dependency of the mechanical properties of sisal fiber reinforced recycled polypropylene composites on fiber surface treatment, fiber content and nanoclay. Journal of Polymers and the Environment 25 (2):427–34. doi:10.1007/s10924-016-0823-2.
- Ighalo, J. O., C. A. Igwegbe, A. G. Adeniyi, and S. A. Abdulkareem. 2021. Artificial neural network modeling of the water absorption behavior of plantain peel and bamboo fibers reinforced polystyrene. Journal of Macromolecular Science, Part B, Part B 60:1–13. doi:10.1080/00222348.2020.1866282.
- Komuraiah, A., N. S. Kumar, and B. D. Prasad. 2014. Chemical composition of natural fibers and its influence on their mechanical properties. Mechanics of Composite Materials 50 (3):359–76. doi:10.1007/s11029-014-9422-2.
- Krishnaiah, D., A. Bono, R. Sarbatly, R. Nithyanandam, and S. M. Anisuzzaman. 2015. Optimisation of spray drying operating conditions of Morinda citrifolia L. fruit extract using response surface methodology. Journal of King Saud University-Engineering Sciences 27 (1):26–36. doi:10.1016/j.jksues.2012.10.004.
- Lekrine, A., A. Belaadi, A. Makhlouf, S. Amroune, M. Bourchak, H. Satha, and M. Jawaid. 2022. Structural, thermal, mechanical and physical properties of Washingtonia filifera fibres reinforced thermoplastic biocomposites. Materials Today Communications 103574. doi:10.1016/j.mtcomm.2022.103574.
- Makhlouf, A., A. Belaadi, M. Boumaaza, L. Mansouri, M. Bourchak, and M. Jawaid. 2022. Water absorption behavior of jute fibers reinforced HDPE biocomposites: Prediction using RSM and ANN modeling. Journal of Natural Fibers 1–18. doi:10.1080/15440478.2022.2114976.
- Marsh, G. 2003. Next step for automotive materials. Materials Today Today 6 (4):36–43. doi:10.1016/S1369-7021(03)00429-2.
- Onu, C. E., J. T. Nwabanne, P. E. Ohale, and C. O. Asadu. 2021. Comparative analysis of RSM, ANN and ANFIS and the mechanistic modeling in eriochrome black-T dye adsorption using modified clay. South African Journal of Chemical Engineering 36:24–42. doi:10.1016/j.sajce.2020.12.003.
- Prasanna, V., K. Ramanathan, and V. S. Raman. 2016. Tensile, flexural, impact and water absorption properties of natural fibre reinforced polyester hybrid composites. Fibres and Textiles in Eastern Europe 3 (117):90–94. doi:10.5604/12303666.1196617.
- Rajabi, M., P. Zahedi, Z. Hassannejad, and I. Haririan. 2019. Optimization of electrospinning parameters for producing silk fibroin/poly(Ethylene oxide) nanofibers using D-optimal method. Journal of Natural Fibers 16 (8):1113–23. doi:10.1080/15440478.2018.1453431.
- Ramakrishnan, S., K. Krishnamurthy, R. Rajasekar, and G. Rajeshkumar. 2018. An Experimental study on the effect of nano-clay addition on mechanical and water absorption behaviour of jute fibre reinforced epoxy composites. Journal of Industrial Textiles 49 (5):597–620. doi:10.1177/1528083718792915.
- Ramesh, M., K. Palanikumar, and K. H. Reddy. 2013. Mechanical property evaluation of sisal-jute-glass fiber reinforced polyester composites. Composites Part B Engineering 48:1–9. doi:10.1016/j.compositesb.2012.12.004.
- Ramesh, M., K. Palanikumar, and K. H. Reddy. 2016a. Evaluation of mechanical and interfacial properties of sisal/jute/glass hybrid fiber reinforced polymer composites. Transactions of the Indian Institute of Metals 69:1851–59. doi:10.1007/s12666-016-0844-5.
- Ramesh, M., K. Palanikumar, and K. H. Reddy. 2016b. Influence of fiber orientation and fiber content on properties of sisal-jute-glass fiber-reinforced polyester composites. Journal of Applied Polymer Science 133. doi:10.1002/app.42968.
- Salleh, Z., Y. M. Taib, K. M. Hyie, M. Mihat, M. N. Berhan, and M. A. A. Ghani. 2012. Fracture toughness investigation on long kenaf/woven glass hybrid composite due to water absorption effect. Procedia Engineering 41:1667–73. doi:10.1016/j.proeng.2012.07.366.
- Sathiyamoorthy, M., and S. Senthilkumar. 2020. Mechanical, thermal, and water absorption behaviour of jute/carbon reinforced hybrid composites. Sādhanā 45 (1):278. doi:10.1007/s12046-020-01514-y.
- Scida, D., M. Assarar, C. Poilâne, and R. Ayad. 2013. Influence of hygrothermal ageing on the damage mechanisms of flax-fibre reinforced epoxy composite. Composites Part B: Engineering: Engineering 48:51–58. doi:10.1016/j.compositesb.2012.12.010.
- Summerscales, J., N. P. J. Dissanayake, A. S. Virk, and W. Hall. 2010. A review of bast fibres and their composites. Part 1 - fibres as reinforcements. Composites Part A, Applied Science and Manufacturing 41 (10):1329–35. doi:10.1016/j.compositesa.2010.06.001.
- Venkateshwaran, N., A. ElayaPerumal, A. Alavudeen, and M. Thiruchitrambalam. 2011. Mechanical and water absorption behaviour of banana/sisal reinforced hybrid composites. Materials & Design 32 (7):4017–21. doi:10.1016/j.matdes.2011.03.002.
- Wang, X., Y. Li, Y. Yan, E. Wright, N. Gao, and G. Chen. 2020. Prediction on the viscosity and thermal conductivity of HFC/HFO refrigerants with artificial neural network models. International Journal of Refrigeration 119:316–25. doi:10.1016/j.ijrefrig.2020.07.006.