
 ?Mathematical formulae have been encoded as MathML and are displayed in this HTML version using MathJax in order to improve their display. Uncheck the box to turn MathJax off. This feature requires Javascript. Click on a formula to zoom.
ABSTRACT
Lustrous golden muga silk is endemic to the northeast part of India. Being pricey, the washing method plays a vital role in retaining the shininess of silk without compromising the fiber’s quality. Kolakhar has been used traditionally for washing muga silk. The present study targets maintaining the overall quality of muga silk washed with different agents. From the FTIR results, it was evident that all the agents had a similar effect with respect to bonds. Activated charcoal showed better results in the shining properties (glossiness 0.029, 1.471 and 0.400 at 20, 60 and 80 degree angle respectively) of muga justifying being the best washing agent compared to other agents (glossiness for detergent 0.000, 0.1257 and 0.514 at 20, 60 and 80 degree anglr respectively) without any damage to the fiber. The hue (angle 24.37), saturation (37.41%), and luminosity (68.52%) of activated charcoal wash fabrics reveal the visual change of the fabrics suggesting the formulation an excellent washing agent contributing to the increased shine in muga silk.
摘要
鲜艳的金色穆加丝绸是印度东北部特有的. 由于价格昂贵,洗涤方法在保持丝绸光泽而不影响纤维质量方面起着至关重要的作用. Kolakhar传统上用于洗涤木加丝绸. 本研究的目标是保持用不同试剂洗涤的木加丝的整体质量. 从FTIR结果来看,很明显,所有试剂对键具有相似的效果. 活性炭在木瓜的光泽性能(20、60和80度角的光泽度分别为0.029、1.471和0.400)方面显示出更好的结果,证明木瓜是最好的洗涤剂,而其他洗涤剂(20、80和60度角的洗涤剂光泽度为0.000、0.1257和0.514)对纤维没有任何损害. 活性炭洗涤织物的色调(角度24.37)、饱和度(37.41%)和亮度(68.52%)揭示了织物的视觉变化,表明该配方是一种优秀的洗涤剂,有助于提高木加丝绸的光泽.
Introduction
The rich heritage of Assamese culture holds muga in an exclusive position in the socio-economic life of Assam (Gangopadhyay Citation2008; Goswami, Nath, and Saharia Citation2015). This golden yellow silk thread is derived from semi-domesticated silkworm Antheraea assamensis and is rare with its texture, luster, and durability (Choudhury, Ramakrishnan, and Devi Citation2021; Gangopadhyay Citation2008; Tikader, Vijayan, and Saratchandra Citation2013). Muga silk is traditionally associated with north-eastern parts of India (mainly Assam). It is vastly accepted because of its amazing forbearance and shiny golden appearance (Choudhury, Ramakrishnan, and Devi Citation2021). One remarkable property of the muga silk fiber is lustre, which is correlated to the reflection of light. The fibers are running filaments composed of fibroin dipped with gum protein named sericin (Katpadi Mohammed and Naik Citation2021). Sericin is not present in the outer layer, but toward the inner-side binding the fiber layers in the cocoons which eventually gets degummed (Manjunath and Khatkar Citation2020). Rigid and harsh nature of silk indicates presence of excess sericin which also conceals the natural lustre of silks (Vyas and Shukla Citation2016). The brilliance of silk fabric is effected when comes in contact with slightly acidic solutions that is known to improve the arrangement of the level fibroin chains which in-turn deepens the light reflection. Whereas, it has been mentioned that chemical breakdown occurs with alkali contact that curtails the silk lustre (Padaki, Das, and Basu Citation2015). However, “Kolakhar” (an alkali) is being used for cleaning muga silk traditionally (Choudhury and Devi Citation2018). “Kolakhar” processed from the charred fruit (peel) of Musa balbisiana is a popular food enhancer in northeast India mainly in Assam. Potassium carbonate is the major component of Kolakhar (Deka and Talukdar Citation2007). Being a natural product, kolakhar composition varies from time to time which is also based on preparation method (Deka and Talukdar Citation2007). Kolakhar functions as the most efficient de-mineralizing agent and the credit for its cleaning of fiber and cloth is attributed to potassium carbonate (Choudhury and Devi Citation2018). The dry peel of M. balbisiana burns to ashes and is filtered through to get the liquor kolakhar (Choudhury and Devi Citation2018; Deka and Talukdar Citation2007). Kolakhar is also used as a traditional degumming agent during thread preparation from the insect larva (Chakravorty, Gogoi, and Meyer-Rochow Citation2015). Prolonged exposure to sunlight causes photochemical degradations of silk fibroin, which damages the silk fibers (Padaki, Das, and Basu Citation2015). Therefore, washing with normal detergent and sun drying may ruin the muga cloth. Silk processing leads to around 25% loss of weight which is also related to the origin and type of the silk used (Mahmoodi et al. Citation2010). Commercially, degumming is done via the soap and soda ash technique that removes sericin from fibroin proteins (Choudhury and Devi Citation2018; Gulrajani Citation1992). Therefore, kolakhar wash may be a better method for surface smoothening and cleaning muga silk cloth to get a shiny golden color. During the preparation of Kolakhar a substantial quantity of charcoal in the filtrate was found. Therefore, an experiment was conducted to find out if it is the crucial part of the kolakhar in cleaning the muga silk (A. assamensis) cloth. Commercially available activated Charcoal was also selected for the experiment. To compare the results, water-washed and detergent-washed muga were also used.
Materials and methods
Materials
Muga silk cloth pieces used in the current study were collected from Lakhimpur district, Assam known for its Silk production. Fruits of M. balbisiana were collected from a local banana plantation field. Activated charcoal (charcoal activated, 61750505001730, Merck Life Science)was purchased from Merck, India. Detergent used was a commonly available commercial powder laundry detergent from an international brand for washing by hand.
Methods
Preparation of the kolakhar
Kolakhar was prepared following the method described by Deka and Talukdar (Citation2007) with minor modification (Deka and Talukdar Citation2007). In short, dried peel of M. balbisiana fruit (500 g) is burned to charcoal and ashes. Three gram (3.00 g) of above is mixed with 60 ml sterile distilled water using a magnetic stirrer for 45 min at 500 rpm (Tarsons Motorless Magnetic stirrer 4050) before filtering through muslin cloth to obtain a black colored filtrate (30 ml used) and labeled as kolakhar. Kolakhar is stored at room temperature for future use.
Preparation of activated charcoal suspension
Activated charcoal suspension (ACS) was prepared in the same procedure as kolakhar. We obtained the gray-colored semi-transparent filtrate for Charcoal activated suspension as well. The pH of the AC was found to be 7.32.
Preparation of commercial detergent for washing
One gram (1.00 g) of the powder laundry detergent was dissolved in 30 ml of sterile distilled water at room temperature and labeled as Commercial detergent solution(CDS). The pH of the solution was measured and found to be 10.63. For water wash, 30 ml of sterile distilled water was taken to wash the fabric.
Washing of muga cloth
The muga clothes were cut into equal weight (Mettler toledo, ME204) pieces (60.0 mg) washed in kolakhar, ACS, and CDS with material-to-liquid ratio (MLR) 0.002/ml at 25°C. They were gently shaken and kept suspended in the solution for 30 minutes. After treating in the respective solutions, the pieces were taken out and rinsed thoroughly with distilled water to ensure the removal of all visible dark charcoal particles and the remains of detergent. Then the pieces were air-dried at 37°C and subsequently stored for further analysis. A control with only distilled water wash is also kept. Overall, five samples were considered for analysis, Raw Muga (RM), Water Wash Muga (WWM), Kolakhar Washed Muga (KWM), Charcoal Wash Muga (CWM) and Detergent Wash Muga (DWM).
Scanning electron microscopy (SEM)
Fibre morphology was investigated by scanning electron microscopy which analyses the outer surfaces of the silk cloth fibers. SEM (JEOL, JAPAN Model’s 6390 LV) at an accelerating voltage of 20KV was used to evaluate samples placed on an aluminum stub that had been vapor deposited with gold.
Hue, saturation, and luminosity (HSL)
For the determination of RGB values, the methodology described by Pan, Gao, and Liu (Citation2009) was followed with a few modifications. The washed muga pieces were scanned at 600 dpi using a Canon scanner (Lide 220) and scanning for RGB was at 300 × 500 pixels for maintaining constant condition (Pan, Gao, and Liu Citation2009).The scanned images were subjected to the determination of RGB values using ImageJ software. The software scanned the images and gave the associated RGB value and its mean values. Using these values Hue, Saturation and Luminosity was being calculated. Before going to the formulas the values were made in the range of 0–1 hence (Gowda and Yuan Citation2019; Saravanan, Yamuna, and Nandhini Citation2016).
Now, Luminosity was calculated with the formula (Gowda and Yuan Citation2019; Saravanan, Yamuna, and Nandhini Citation2016).
Saturation was calculated using the formula (Gowda and Yuan Citation2019; Saravanan, Yamuna, and Nandhini Citation2016).
Hue was calculated using the formula (Gowda and Yuan Citation2019; Saravanan, Yamuna, and Nandhini Citation2016).
Glossiness measurement
Glossiness of RM, WWM, KWM, CWM, and DWM was measured using digital Gloss meter (S.C.Dey and Co., Kolkata) with measuring angle at 20 °, 60 °, and 80 °.
Fourier transforms infrared spectra (FTIR) studies
The washed and control muga pieces were subjected to analysis using an FTIR spectrophotometer (IMPACT 410, NICOLET, USA). Measurement was taken in the range of 4000 to 400 cm−1 (step size 1.0 cm−1). The graphs and peak analysis were carried out in OriginPro 8.5.
Results and discussion
Comparison of SEM images
The SEM images of the washed and unwashed muga cloth pieces are presented in . The 500X and 2000X magnified images show the changes in the surface of the fiber due to treatment with different washing agents. Silk is known to have high bending deformation without breakage which confirms the observance of intact single fibers in all the treatments and RM (Shah, Porter, and Vollrath Citation2014). The SEM images disclosed some evidence for comparison of longitudinal fibrillation as well as peeling of fibers. The KWM, CWM, and WWM don’t show any damage at the fiber levels which can be inferred from SEM results. In the case of DWM, damage in fiber level can be seen in addition to the presence of sericin. Even though the fiber core (silk fiber) is a highly oriented crystalline fibrous structure that is insoluble in water, it is highly absorbent and gets wet easily by water (Mishra Citation2000). Due to wet abrasion, swelling of the fiber takes place that weakens the inter-microfibril interactions making the fiber susceptible to fibrillation (Ma et al. Citation2014). The micro-cracks visible in the case of DWM results in the roughness of fabrics and also will impair fabric tensile property eventually.
Figure 1. SEM images of 500X of a) RM, b) WWM, c) KWM, d) CWM, e) DWM and 2000X of f) RM, g) WWM, h) KWM, i) CWM, j) DWM.
Based on the findings physical damage of the fiber in case of DWM has been confirmed
Hue, saturation, and luminosity
In electronic systems as well as conventional photography, the Red Green Blue (RGB) color model is employed in detection and portraying of image to its display. An object reflects or emits some wavelength of light at various intensities while absorbing or not emitting other wavelengths. Colors are represented along three different relatively independent dimensions Hue, Saturation and Brightness deduced from RGB values. The RGB was calculated from the scanned images shown in .
Figure 2. Scanned images of a) RM, b) WWM, c) KWM, d) CWM, e) DWM.
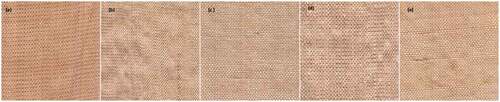
RM has a saturation percentage of 40.09 and accounts for a luminosity percent of 61.82. Luminosity percent of all treated samples lies between 66–69 resulting in 4–8% increase compared to RM. It was found that CWM shows the highest luminosity and emerges as a better result with combination of increased luminosity and decrease in saturation (compared to RM) without much deviation from the hue angle of the RM. The hue angle is considered to be a component similar to man’s vision in HSL color space (Pan, Gao, and Liu Citation2009). The hue angle deviation is more in the case of WWM, KWM, and DWM treatments indicating shifting from the original color.
Glossiness
Gloss is an important factor of appearance. The common characteristic of glossiness of an item is showing of bright highlights where an incident illumination is reflected in the specular direction. The glossiness of the samples at the three angles was different, however not much disparity can be observed among the treated samples. At 20°, the glossiness Unit (GU) was 0.100 (RM), 0.000 (WWM), 0.014 (KWM), 0.029 (CWM) and 0.000 (DWM). The GU at 60° was found to be 1.486 (RM), 1.314 (WWM), 1.286 (KWM), 1.471 (CWM) and 1.257 (DWM). At 80°, the GU values were 0.557 (RM), 0.429 (WWM), 0.314 (KWM), 0.400 (CWM) and 0.514 (DWM). The difference in all the angles were significantly different (p < .05). The details can be seen in . The results suggest CWM to have an ovelall better gloss when compared to the three angles as WWM and DWM have no glossiness at angle 20° and KWM having lower GU values in all the angles. The SEM images suggest the smooth surface of CWM and KWM compared to the fibrillated surface of DWM which can be a possible reason for having better glossiness in case of CWM and KWM.
Figure 3. Gloss Values at 20 °, 60 ° and 80 ° of a) RM, b) WWM, c) KWM, d) CWM, e) DWM.
FTIR
The FTIR data for the RM, WWM, KWM, CWM, and DWM are presented in . The FTIR spectra displays characteristic amide absorption bands of protein amide I (1600–1800 cm −1), amide II (1470–1570 cm −1), and amide III (1250–1350 cm −1) (Ji et al. Citation2020).
Figure 4. FTIR spectra of a) RM, b) WWM, c) KWM, d) CWM, e) DWM.
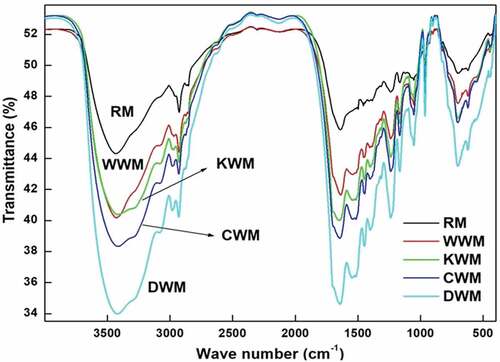
Bands at 3091, 3086, 3082, and 3083 cm −1 were seen for WWM, KWM, CWM, and DWM respectively which was missing in the case of RW. These bands are associated with Aromatic Carbon-Hydrogen frame and Terminal (Vinyl) Carbon-Hydrogen stretch (Coates Citation2000). The amide-A stretch is generally part of a Fermi resonance doublet lying between 3310 cm −1 and 3270 cm −1 and the second stretch (weak) absorbance lies from 3100 cm −1 to 3030 cm −1 and is attributed to amide-B. These two bands are prominent in WWM, KWM, CWM, and DWM; however, in the case of RM, the band is almost negligible (Barth Citation2007). The Carbon- Oxygen stretch vibration along with the desynchronize Carbon-Nitrogen stretching vibration, Nitrogen-Hydrogen in-plane bend and the Carbon-Nitrogen distortion that forms tremors in the amide-I region close to 1650 cm −1 which can be seen in all the samples 1637 cm −1 (RM and WWM), 1642 cm −1 (KWM), 1642 cm −1 (CWM) and 1641 cm −1 (DWM)) as in . β-sheets of RM and WWM (1637 cm −1) got shifted to random coils/extended chains in the case of KWM, CWM, and DWM (Barth Citation2007). Whereas, formation of a band can be seen in all samples from range 1697–1703 cm −1 in the Amide-I region which is attributed to β-sheets except for RM (Cai and Singh Citation2004). The β-sheets for WWM, KWM, and CWM are anti-parallel β-sheets (1699–1620 cm −1) (Boulet-Audet, Vollrath, and Holland Citation2015). The crystalline nature of a protein can be stipulated from β–sheet. Stress in the fibroin protein and change in it can be because of relaxation in the fibroin protein leading to β–sheet. Peaks near 1400 cm −1 in all the samples are due to CH4 group frequency of alanine. In amide II region, RM (1498 cm −1), WWM (1496 cm −1), KWM (1515 cm −1), CWM (1514 cm −1) and DWM (1514 cm −1) all fall in aromatic nitro compounds. Further, RM and WWM exhibit a peak at 1456 cm −1 and 1452 cm−1 respectively that is attributed to Methyl C-H asymmetric/symmetric stretch, aromatic ring stretch (Coates Citation2000). Whereas, KWM, CWM, and DWM peak lie at 1445 cm −1 that is limited to Methyl C-H asymmetric and symmetric stretch (Baskar et al. Citation2015). All peaks lie between 1340–1456 cm −1 which is generally assigned to the vibration mode of residues (Barth Citation2000). Amide III region has aromatic amino group with aromatic primary amine (Carbon-Nitrogen stretch) (1340–1250 cm −1), aromatic secondary amine (Carbon-Nitrogen stretch) (1350–1280 cm −1) and aromatic tertiary amine (Carbon-Nitrogen stretch) (1360–1310 cm −1) which overlaps all the samples, RM (1315 cm −1), WWM (1314 cm −1), KWM (cm −1), CWM (1314 cm −1) and DWM (1314 cm −1) (Coates Citation2000; Sari and Simarani Citation2019; Workman Citation2016). All peaks lie between 1340 cm−1-1456 cm−1 which is generally assigned to the vibration mode of residues (Barth Citation2000). Amide III region has aromatic amino group with aromatic primary amine at 1340 cm−1-1250 cm−1, aromatic secondary at 1350 cm−1-1280 cm−1 and aromatic tertiary amine at 1360 cm−1-1310 cm−1 which overlaps all the samples, RM (1315 cm−1), WWM(1314 cm−1), KWM(1314 cm−1), CWM(1314 cm−1) and DWM(1314 cm−1) (Workman Citation2016). Around 1400 cm−1 a distinct peak can be observed which is due to CH4 group frequencies of alanine, justifying its association with OH bend (Asapur, Mahapatra, and Banerjee Citation2020; Coates Citation2000). The modification in the molecular conformation was found similar in all the treatments suggesting similar effect of the treatments chemically on the fabric,
Table 1. Functional groups associated with the peaks of RM, WWM, KWM, CWM and DWM.
Conclusion
Comparing all the treated samples with RM, it can be comprehended that CWM exhibits the best shine by having the highest luminosity with the least deviation from the hue angle. CWM also proves to be fiber friendly as there is no damage in the fiber level as can be seen in the SEM images whereas other washing agents are associated with damaging the fiber, DWM showing the highest damage. WWM, KWM also exhibits swelling of fibers which is not overpowering in the case of CWM and DWM as can be seen in the optical microscope images. The FTIR result suggests some bond changes in the case of CWM, which are also evident in KWM and DWM. Considering the shininess after the result, it can be concluded that CWM is a better washing agent for Muga without compromising with the quality of the fiber as assured from the optical microscope images, SEM images, and FTIR results.
Research Highlights
A novel silk washing composition using water and activated charcoal.
Shininess of muga silk cloth increased after washing with this novel composition
There was no damage of muga silk after washing treatment with the novel composition.
The washing treatment is free of detergent/alkali.
Acknowledgment
Authors acknowledge the UGC funding with sanction no. F.30-405/2017 (BSR) dated 09/1/2018 as well as DBT funding with sanction no. BT/PR25000/NER/95/950/2017 dated 02/9/2019 for proving all the essential instruments and facilities.
Disclosure statement
No potential conflict of interest was reported by the author(s).
References
- Asapur, P., S. K. Mahapatra, and I. Banerjee. 2020. Secondary structural analysis of non-mulberry silk fibroin nanoparticles synthesized by using microwave and acetone method. Journal of Biomolecular Structure & Dynamics 40 (9):1–9. doi:10.1080/07391102.2020.1852970.
- Barth, A. 2000. The infrared absorption of amino acid side chains. Progress in Biophysics and Molecular Biology 74 (3–5):141–73. doi:10.1016/S0079-6107(00)00021-3.
- Barth, A. 2007. Infrared spectroscopy of proteins. Biochimica et Biophysica Acta (BBA)-Bioenergetics 1767 (9):1073–101. doi:10.1016/j.bbabio.2007.06.004.
- Baskar, G., J. Chandhuru, K. Sheraz Fahad, A. Praveen, M. Chamundeeswari, and T. Muthukumar. 2015. Anticancer activity of fungal L-Asparaginase conjugated with zinc oxide nanoparticles. Journal of Materials Science: Materials in Medicine 26 (1):1–7. doi:10.1007/s10856-015-5380-z.
- Boulet-Audet, M., F. Vollrath, and C. Holland. 2015. Identification and classification of silks using infrared spectroscopy. The Journal of Experimental Biology 218 (19):3138–49. doi:10.1242/jeb.128306.
- Cai, S., and B. R. Singh. 2004. A distinct utility of the amide iii infrared band for secondary structure estimation of aqueous protein solutions using partial least squares methods. Biochemistry 43 (9):2541–49. doi:10.1021/bi030149y.
- Chakravorty, J., M. Gogoi, and V. B. Meyer-Rochow. 2015. Cultural attributes and traditional knowledge in connection with the rearing of muga (Antheraea Assama= Assamensis) in the Dhemaji District of Assam, North-East India. Journal of Insect Biotechnology and Sericology 84 (1):1_017–1_28. doi:10.11416/jibs.84.1_017.
- Choudhury, M., and D. Devi. 2018. Demineralization of cocoons of antheraea assamensis helfer (Muga) for effective reeling. The Journal of the Textile Institute 109 (4):552–59. doi:10.1080/00405000.2017.1361146.
- Choudhury, M., E. Ramakrishnan, and D. Devi. 2021. Identification and characterization of methyl isoeugenol compound from the golden yellow hued muga silk fiber of India. Journal of Natural Fibers 18 (8):1069–82. doi:10.1080/15440478.2019.1686677.
- Coates, J. 2000. Interpretation of infrared spectra, a practical approach. In Encyclopedia of analytical chemistry, ed. R. A. Meyers, 10815–37. Chichester: John Wiley & Sons Ltd. doi:10.1002/9780470027318.a5606.
- Deka, D. C., and N. N. Talukdar. 2007. Chemical and spectroscopic investigation of kolakhar and its commercial importance. Indian Journal of Traditional Knowledge 6 (1):72–78.
- Gangopadhyay, D. 2008. Sericulture industry in India–a review. In India science and technology 2008, ed. P. Banerjee, 334–39. New Delhi: National Institute of Science Technology and Development Studies (NISTADS), CSIR.
- Goswami, N., D. Nath, and P. Saharia. 2015. A study on socio-economic assessment and adoption of scientific technologies by the muga rarers of Assam. International Journal of Scientific Research 4 (2):349–53.
- Gowda, S. N., and C. Yuan. 2019. Colornet: Investigating the importance of color spaces for image classification. In Computer vision – ACCV 2018. Lecture notes in computer science, ed. C. Jawahar, H. Li, G. Mori, and K. Schindler, vol. 11364, 581–96. Australia: Springer. doi: 10.1007/978-3-030-20870-7_36.
- Gulrajani, M. 1992. Degumming of silk. Review of Progress in Coloration and Related Topics 22 (1):79–89. doi:10.1111/j.1478-4408.1992.tb00091.x.
- Ji, Y., X. Yang, Z. Ji, L. Zhu, N. Ma, D. Chen, X. Jia, J. Tang, and Y. Cao. 2020. Dft-calculated Ir spectrum Amide I, Ii, and Iii band contributions of N-Methylacetamide fine components. ACS omega 5 (15):8572–78. doi:10.1021/acsomega.9b04421.
- Katpadi Mohammed, A. K., and S. V. Naik. 2021. A comparative study on the performance of different exhaustive agents used in modern dyeing Vis-À-Vis primitive dyeing of silk thread. Journal of Natural Fibers 1–7. doi:10.1080/15440478.2021.1929648.
- Mahmoodi, N. M., M. Arami, F. Mazaheri, and S. Rahimi. 2010. Degradation of sericin (Degumming) of persian silk by ultrasound and enzymes as a cleaner and environmentally friendly process. Journal of Cleaner Production 18 (2):146–51. doi:10.1016/j.jclepro.2009.10.003.
- Manjunath, R., and V. Khatkar. 2020. Investigation of structural morphology and mechanical behavior of muga silkworm (Antheraea Assamensis) cocoons. Journal of Natural Fibers 19 (8):1–13. doi:10.1080/15440478.2020.1824847.
- Ma, M., L. You, L. Chen, and W. Zhou. 2014. Effects of ultrasonic laundering on the properties of silk fabrics. Textile Research Journal 84 (20):2166–74. doi:10.1177/0040517514537370.
- Mishra, S. 2000. A text book of fibre science and technology. New Delhi: New Age International (P) Limited. doi: 10.1016/b978-1-78242-311-9.00001-x.
- Padaki, N. V., B. Das, and A. Basu. 2015. 1-Advances in Understanding the Properties of Silk. In Advances in silk science and technology, ed. A. Basu , 1st ed., 3–16. Cambridge, UK: Woodhead Publishing.
- Pan, R., W. Gao, and J. Liu. 2009. Color clustering analysis of yarn-dyed fabric in Hsl color space. Paper presented at the 2009 WRI World Congress on Software Engineering, Xiamen, China, May 19-21. doi: 10.1109/WCSE.2009.148.
- Saravanan, G., G. Yamuna, and S. Nandhini. 2016. Real time implementation of Rgb to Hsv/Hsi/Hsl and its reverse color space models. Paper presented at the 2016 International Conference on Communication and Signal Processing (ICCSP), Melmaruvathur, India, April 06-08. doi: 10.1109/ICCSP.2016.7754179.
- Sari, I. P., and K. Simarani. 2019. Comparative static and shaking culture of metabolite derived from methyl red degradation by lysinibacillus fusiformis strain W1b6. Royal Society Open Science 6 (7):190152. doi:10.1098/rsos.190152.
- Shah, D. U., D. Porter, and F. Vollrath. 2014. Opportunities for silk textiles in reinforced biocomposites: Studying through-thickness compaction behaviour. Composites Part A: Applied Science and Manufacturing 62:1–10. doi:10.1016/j.compositesa.2014.03.008.
- Tikader, A., K. Vijayan, and B. Saratchandra. 2013. Improvement of host plants of muga silkworm (Antheraea Assamensis) for higher productivity and better adaptation-a review. Plant Knowledge Journal 2 (2):83–88.
- Vyas, S. K., and S. R. Shukla. 2016. Comparative study of degumming of silk varieties by different techniques. The Journal of the Textile Institute 107 (2):191–99. doi:10.1080/00405000.2015.1020670.
- Workman, J. 2016. Near Infrared Spectroscopy. In Vol. 3 of the concise handbook of analytical spectroscopy: theory, applications, and reference materials. Singapore: World Scientific. doi:10.1142/8800-vol3.