
 ?Mathematical formulae have been encoded as MathML and are displayed in this HTML version using MathJax in order to improve their display. Uncheck the box to turn MathJax off. This feature requires Javascript. Click on a formula to zoom.
ABSTRACT
According to environmental issues and guidelines, increasing efforts are being focused on reducing the harmful impact of textile wastes either by lowering the use of chemicals or by recycling wastes into new products to give them a new life cycle. In this paper, we investigate the physical and chemical properties of wool wastes coming from tanning industry, where the process of pulling the wool from the hide is based on chemical processes. These so-called “’Pulled wool’” properties are compared to virgin raw wool obtained from the same pelt, to evaluate the degradation of the fiber induced by the chemicals. SEM observations indicate that the pulled wool fiber surface appeared rougher, and the scales appeared to have been affected. Based on the X-ray diffraction, the crystallinity of the pulled fibers appeared to have been slightly reduced. Attenuated ATR-FTIR analyses indicated some changes in chemical composition. HPLC tests showed an apparent increase in the amount of cystic acids indicating damage of some macromolecular chains crosslinking. Thus, some properties appeared significantly affected during the chemical unhairing process. Based on these characteristics of pulled wool, potential applications to valorize it could be suggested, as we show that it remains suitable for conventional textile processes.
GRAPHICAL ABSTRACT

摘要
根据环境问题和指导方针,正在加大努力,通过减少化学品的使用或将废物回收成新产品,使其具有新的生命周期,从而减少纺织品废物的有害影响. 在本文中,我们研究了制革工业产生的羊毛废料的物理和化学性质,其中从皮革中提取羊毛的过程基于化学过程. 将这些所谓的“牵拉羊毛”特性与从同一毛皮中获得的原始羊毛进行比较,以评估化学物质引起的纤维降解. SEM观察表明,拉伸的羊毛纤维表面看起来更粗糙,鳞片似乎受到了影响. 基于X射线衍射,拉伸纤维的结晶度似乎略有降低. 衰减的ATR-FTIR分析表明化学成分发生了一些变化. HPLC测试显示囊性酸的量明显增加,表明某些大分子链交联受损. 因此,在化学脱毛过程中,某些性能受到显著影响. 基于拉毛的这些特性,可以建议对其进行价值评估的潜在应用,因为我们表明它仍然适用于传统的纺织工艺.
Introduction
Textile challenges are nowadays oriented toward finding sustainable materials. The use of fibrous byproducts, is currently one of the most investigated environmental challenges both in research and at industry scale. Among these materials, wool constitutes a highly valuable natural fiber which is known to have excellent intrinsic properties and is therefore used as a high-quality textile material (Eslahi, Dadashian, and Nejad Citation2013). Wool consists of almost 95% of keratin. It has high amounts of proteins with high sulfur content, a quarter of which are made up of cystine. This chemical composition imparts astonishing mechanical properties in the keratins (Rogers Citation1985). Worldwide, there are various approaches to wool waste management and practical methods for wool fibers valorization, a number of which have been practiced for over 200 years (Russell et al. Citation2016). In the context of renewable resource exploitation, as an example, insulation made from sheep’s wool is being used to achieve sustainable or green products. Sheep’s wool has demonstrated some potential and has begun to be promoted as an alternative to non-ecological insulating materials (Parlato and Porto Citation2020). Artisanal scale, rugs and carpets manufacturing have also showed some promising potentials (Kumar, Prince, and Jose Citation2017). Carpets made with wool are generally adapted to extreme environments such hot and humid climates thus verifying the beneficial fiber characteristics. Currently, a high volume of wool known as “’pulled wool”,’ but often designated as waste, is generated from slaughter houses and tanneries (Fathima, Rao, and Nair Citation2012) during the unhairing process. It consists of wool removed from the hairy part of the hide of the sheep, which can be done by many methods, such as clipping, scalding, chemically, sweating, and also with enzymatic process. Chemical Unhairing is the most used process in the tannery industry (Helal and Mourad Citation2009). The use of lime and sodium sulfide in chemical treatment creates an extremely alkaline environment, resulting in the removal of the wool fiber from the hide. It affects the wool supply chain from the beginning. Consequently, a very important amount of post-consumer and post-industrial textile fiber wastes are being generated (Wang Citation2010). In view of this background, we propose in this paper a comparative study between raw and pulled wool fibers in terms of the physico-chemical composition and mechanical performance. This comparison is valuable for setting a new route to valorize pulled wool as the investigated properties allow an assessment of the potential applications of these fibers and to determine whether they are suitable for textile production.
Experimental
Materials
Considering the significant influence of sex and breed on wool fiber properties (Harizi and Abidi Citation2015), the selected pelts refer to male Barbary red face sheep (BTR). Sheep pelts were obtained from slaughter. We were used ten pelts in our investigation. Each hide was divided into two identical parts. One part was sheared and identified as raw wool (R). The second part was pulled (P) from the hide using the chemical process of tanning. For the shorn wool (R), we have chosen five on the right side and five others on the left, and vice versa for the pulled wool (P). Each part was divided into different zones; rump, back, side, and Neck as shown in . The comparison between the different zones will be the subject of another article. In this work, we focus on the side part. Approximately 100-g wool samples were taken from the mid-side, left and right, of each pelt and were put in plastic sample bags (Harizi et al. Citation2015).
Figure 1. Different sheep body parts.
The chemical tanning consists on the following steps: Sodium Sulfide Na2S was added to the water until the concentration of the solution reached 18°Be. After dissolving, lime was added to the solution in order to obtain a 35°Be concentration. The tanning process involves applying the resultant paste to the flesh side of the skin (Moghassem and Gharehaghaji Citation2008).
Yield determination
After recovery of the fiber, by either shearing or pulling, the clean weight yield (CWY) was determined following ASTM D584–96 (Reapproved 2005): samples were weighed immediately, immersed in a scouring bowl containing a solution of 0.3% sodium carbonate (Na2CO3) and 0.1% soap for 15 minutes at a temperature of 52 ± 3°C, before rinsing with clean water and drying to oven-dry condition before re-weighing.
Morphological study
Scanning Electron Microscopy (SEM) analysis was carried out with JEOL JSM5400 microscope at 15 kV acceleration voltage after gold coating.
Determination of mean diameter and fiber length
Measurement of the fiber diameter (FD) of pulled and raw wool was measured by projection microscope (magnification × 500 times) according to ASTM D 2130–90 (Reapproved 2001). The measurement is carried out on 300 fibers chosen at random (Shakyawar et al. Citation2013).
Wool fiber length (FL) measurements were obtained using the direct method according to ASTM D519 – 04 (Reapproved 2013). Fibers from the sample were normalized and arranged one by one, over a graduated scale to take the measurements.
Test of moisture regain
According to the standard NF G 08–001, the Moisture Regain (MR) of the samples were tested under standard conditions (25°C, 65% RH). It is calculated using Equationequation (1)(1)
(1) .
Where Ms and Mh represented, respectively, the dry weight and conditioned weight of samples.
Tensile properties
The dynamometer used for the tensile tests is a machine of the type LLOYD Instrument with a constant extension rate of 17 mm/min using 20 mm gauge length in accordance with the standard ISO 5079:1995(E). For each sample, mechanical properties of 50 fibers were tested then the mean value and the standard deviation were calculated.
X-ray diffraction analysis (×RD)
To determine the crystallinity of the samples under different conditions, the samples of raw and pulled wool fibers were placed within the chamber of analytical X-ray diffractometer 5° to 80° at a scan speed of 8 deg/minute. By using the X-ray patterns with Origin Pro 8, we determined crystallinity percentage. The degree of crystallinity (×c) is estimated by using the following Equationequations (2)(2)
(2) .
Where At is the total area under the curve of the diffracted intensity at 2θ = 5° to 45°, and Aa is the corresponding area under the baseline (Ogawa et al. Citation2000).
Attenuated total reflectance-Fourier transform infrared spectroscopy (ATR-FTIR) analysis
ATR-FTIR instrument (Spectrum Two™ FTIR, Perkin Elmer) was used to analyze the spectra of the samples. The absorbance of the infrared Spectra were collected from 100 scans, in the range 4000–400 cm−1.
Amino acid analysis
The chemical composition of wool fibers was determined by High-Performance Liquid Chromatography (HPLC). Wool samples were hydrolyzed with 6 M HCl for 24 h at 110°C in a nitrogen atmosphere. Free amino acid residues were derivatized with 6-aminoquinolyl-N-hydroxysuccimildyl carbamate (AQC by Waters) and eluted on a reversed-phase column. The quantitative amino acid composition was determined by calibration with the amino acid standard H (Pierce), cysteic acid, and lanthionine (TCI Europe) as external standards and α-aminobutyric acid as an internal standard (Zoccola et al. Citation2012).
Statistical analysis
Statistical analysis of data was based on the analysis of variance (ANOVA), using Minitab software and assuming a confidence level of 95% for statistical significance. Data were analyzed to investigate the effects of the chemical unhairing process on the wool fibers properties.
Results and discussion
To compare the physical and mechanical properties between raw and pulled wool, our samples were cleaned. Yield is a major determinant of the value of raw wool (Westmoreland, Schlink, and Greeff Citation2006). Except for the vegetable matter, scouring removes most of the grease, wax (fat), suint, and dirt from wool fibers (Memon, Wang, and Langat Citation2018). The (CWY) was calculated and the results are shown in .
Table 1. Properties of raw (R) and pulled (P) wool fibers.
This proportion varies with the sampling points. In general, it decreases in dirty places (Rump, Belly, and areas on which the animal lies down). Besides, the CWY is affected by the sample’s diameter; the side (#3) presents the cleanest region (Charlet, Leroy, and Cattin-Vidal Citation1953). The CWY of the raw wool averages 90.7 ± 2%, which is higher than that of the pulled wool samples, which was 51.2 ± 4.5%. This difference (44%) is due to residual chemical product used in the tanning and moisture content (Nasr, Abdelsalam, and Azzam Citation2013). The factor “process,” associated to the chemical process to pull the wool during tannery, reveals very significant changes (p < .01). Despite this low value, the (CWY) of pulled samples can be described as acceptable referring to the American Sheep Industry Association, which considers that washing performance is between 40% and 70% and referring to Tunisian sheep breed which wool yields ranging from 50% to 70% (Harizi et al. Citation2015).
Morphological study
The surface structure of the fiber is an important factor affecting its properties. Wool is a natural fiber, which intrinsically has a rough surface. The SEM images of examples of raw and pulled wool fiber are shown in . They suggest slight changes in the cuticle layer. For shorn wool, presented in , it can be clearly observed that scales have sharp edges and the cuticle layer has a smooth surface. However, for the pulled wool, represented in , the scales appear slightly damaged as compared to the shorn wool. Thus, the chemical treatment appears to make the scale edges blunt and also some roughness is induced on the cuticle surface. The treatment has an etching effect on the surface of the wool fiber.
Figure 2. Scanning electron micrographs of (a) raw and (b) pulled wool fibers (×2000).
For wool fiber, it is evident that the damage is essentially caused by the attack of protein by the alkaline treatment (Helal and Mourad Citation2009). In fact, tanning includes many steps (soaking, chemical unhairing, liming, fleshing, lime removal, bating, fat removal, etc.). Thus, the micro-morphology of pulled wool is systematically affected and its surface roughness is increased. Indeed, using lime and sodium sulfide in the chemical method, especially in high concentration, creates an extremely alkaline environment resulting in the pulping of fiber as well as its subsequent removal (Poole and Church Citation2015).
The morphological details of the scales are described as the number of scales per 100 µm, scale height and scale index. The number of scales per 100 µm is 8.6 and 8.4 and the scale height is 18.96 μm and 18.27 μm respectively for raw and pulled wool. These results are in agreement with those of Mahal et al. (Mahal, Johnston, and Burns Citation1951). In their investigation, they proved that the average number of scales per 100 µm for medium wool is in the order of eight. The scale index which is the ratio of scale height to (FD) (Mahal, Johnston, and Burns Citation1951), is equal to 0.743% for raw wool and 0.703% for pulled wool. presents raw wool and presents the fiber after alkali treatment. They show that height scales decreased, as a result, the scale index decreased. Therefore, it can be concluded that the chemical treatment may damage and change the edge of some scales. According to Rippon, friction is related to the scale index (Rippon Citation2008). Its lowering for pulled wool fibers accounts for the low directional frictional coefficient reported for this wool.
Fiber diameter
The average (FD) of wool is the single most important parameter that characterizes its fineness (Sitotaw et al. Citation2019) and a large part of its value. In addition, it is essential to the manufacturers’ advantage to know how much grade variation exists between raw and pulled wool in any given batch before determining its fair market value. It is useful to assess the variation of the (FD) between raw and pulled wool. The obtained values are presented in .
From the table above, the average mean fiber diameter of the shorn wool samples was 26.94 ± 4.21 µm. Therefore, according to the American Blood grade system, wool fibers of Breed Barbary of red face belong to the middle grade “3/8 Blood” (Clay Citation2007). The average mean fiber diameter of the pulled wool samples was 26.10 ± 5.67 µm. The difference between the averages of the diameters of raw and pulled samples is in the order of 1 µm. The factor “process” reveals significant changes (p < .05).
In fact, chemical processing changes the scales and expels the splinters without modifying the inner diameter of the wool fibers; therefore, it maintains its initial versatility. This result is in agreement with those of Harizi et al., who declared that, for wool fiber, the scale height is about 1 μm (Harizi et al. Citation2006). According to A988 Wool – Quality Evaluation and Manufacturing Processes, these samples with the associated diameters, standard deviation, and coefficient of variation can be used in light upholstery coatings and some carpets and tapestries.
Fiber length
Wool fiber length (FL) is a cornerstone factor that determines its end-use. The direct method was used to determine the (FL) of both raw and pulled wool. The obtained results are shown in . The (FL) of raw wool is 106.02 ± 16.89 mm higher than pulled one which‘s about 100.78 ± 15.32 mm. The factor “process” reveals significant changes (p < .05).
For manufacturers, it is of major importance to know the range of length as part of the process of assessing value. Mean fiber length is generally correlated with mean fiber diameter: wool fibers are usually longer as the diameters are higher (Charlet, Leroy, and Cattin-Vidal Citation1953). According to the Canadian Sheep Federation, for the wool fineness of 26 μm to 30.1 μm, the suggested length is between 75 and 90 mm. For our samples, the (FL) was 100.78 ± 15.32 mm with a (FD) of 26.10 ± 5.67 μm. Thus, the diameter–length ratio of the pulled samples can be considered as acceptable.
Fiber moisture regain
Moisture regain (MR) is the ability of a dry fiber to absorb moisture under given conditions of humidity. Owing to the presence of the amorphous region and the amide and carboxyl groups, wool fiber has a relatively high (MR) (Xu et al. Citation2006). It can reach 15.5% at 25°C (Huson Citation2018), which is the case with our samples. Wool fiber is strongly hygroscopic. It has a pronounced hydrophobic character on its surface. It absorbs water as vapor while the liquid water is pushed out of the fiber thanks to the cuticles (McKittrick et al. Citation2012). As revealed in , the average (MR) of pulled wool was 14.70 ± 0.73%, which was lower than the raw wool average of 15.25 ± 0.82%. This phenomenon can be explained by the damage of the scales, which were the cause of hydrophobicity on the surface of raw wool.
Moreover, it is known that greasy wool fiber is covered with greases and waxes (suintine) which represents up to 50% of the fleece weight. The greases are mainly composed of the suint (could be dissolved by cold water) and Lanolin (insoluble in water). Lanolin is very hygroscopic. It can absorb a third of its weight in water (Élie Citation2008). Furthermore, Lanolin is sensitive to alkali products, and as a result, its components decrease with the chemical unhairing process. Thus, the (MR) of pulled samples decreases (4%). Likewise, the factor “process” results reveal significant changes (p < .01).
Tensile properties
Tensile properties, breaking strength (BS), fiber tenacity (T), and fiber elongation at break (E) that connected with further processing behavior. The mechanical properties of raw and pulled wool are shown in . The data analysis indicate that the factor “process” has very significant effect (p < .01) on the wool’s breaking strength and significant effect (p < .05) on the fiber tenacity. The average values of tenacity (T) were measured as 22.36 cN/tex and 21.47 cN/tex, respectively for raw and pulled wool. And, the average elongations to break were 31.47 ± 2.80% for raw wool and 27.04 ± 3.22% for pulled wool. The factor “process” reveals very significant changes (p < .001).
Table 2. Mechanical properties of raw (R) and pulled (P) wool fibers.
Despite the average tenacity values of our samples of Barbery red face being lower than the average tenacity of Australian wool, which is considerably finer on average but around 35 cN/tex, the values obtained on our pulled wool samples appear adequate for textile industry processes like knitting and weaving. According to Harizi et al. (Citation2015), wool fibers should have tenacity values of at least 6 cN/tex to withstand breaking during processing
The apparently significant changes in the fiber properties and performance at the macroscale might be related to changes in the microscale composition of the fiber. A micro molecular investigation based on X-Ray diffraction and, Infra-red spectroscopy techniques, as well as the amino-acid bridges characterization is of relevance to have deeper insight on the multiscale behavior of the wool fiber submitted to chemical pulling during tanning.
XRD analysis
The X-ray diffraction results of raw and pulled samples are presented in . They show the typical diffraction pattern with a prominent 2θ peak at 20° and a minor peak at 10°. The α-keratin structure presents a crystalline spacing of 5.1Ǻ at the prominent peak and 9.8Ǻ at the minor peak. In addition, the ß-keratin structure presents a crystalline spacing of 4.65Ǻ at the prominent peak and 9.8Ǻ at the minor peak. The total crystallinity of wool samples equals the sum of α and β-crystallinity (Cao and Billows Citation1999). In this part, we investigate through X-ray diffraction analysis the differences in the total crystallinity between raw and pulled wool samples. The degrees of crystallinity were determined by the ratio of the whole diffraction of the crystalline phase and the amorphous phase of each sample.
Figure 3. X-ray diffraction spectra of raw and pulled wool fibers.
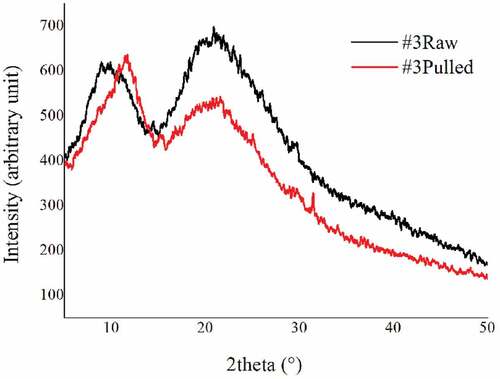
The results show that the degree of crystallinity was lower in the samples from the alkali treatment by 18%, from 41.4% to 34%. The factor “process” reveals very significant changes (p < .01). This difference in crystallinity may be explained by a transformation of a small amount of α-helical molecular chains into amorphous material (Cao Citation2000). Moreover, the crystallinity of the wool fiber is related to its physical, chemical as well as mechanical properties. Alkali treatment leads to reducing the crystallinity of wool fiber (Motaghi, Eskandarnejad, and Montazer Citation2014) that could be explained by the breaking of polypeptide chain. A part of the crystalline region vanishes. On the other hand, these changes could be attributed to the breaking of disulfide bonds in the pulled wool fiber (Barani and Calvimontes Citation2014). The apparent decrease in fiber crystallinity after chemical pulling may explain the reduction in tenacity and elasticity. Nevertheless, a study with ATR-FTIR techniques seems relevant as it allows deeper understanding the changes of the functional groups and the breaks of the peptide and disulfide bonds.
ATR-FTIR analysis
The wool hydrolysis process by alkali treatment involves the breakage of the peptide bonds and disulfide bonds of proteins, which results in the formation of amino acids. The alkaline hydrolysis of wool with sodium hydroxide, obtained during chemical treatment (Equationequation 3(3)
(3) ), resulted in breakage of disulfide, peptide, and side-chain amide bonds (Equationequation 4
(4)
(4) and Equation5
(5)
(5) ).
Infrared absorption spectra of raw and pulled wool are shown in . The characteristic absorption bands were assigned mainly to the peptide bond (CONH). The vibrations in the peptide bonds originate bands known as amide A, amide B, amide I, II, III. Respectively, raw and pulled fiber at 3278 cm−1 and 3272 cm−1 of amide A, and at 3068 cm−1 and 3058 cm−1 of amide B were observed. The amides A and B are connected with the stretching vibration of the N–H bond. The amide I peak appears approximately at 1636 cm−1 for both pulled and raw wool. This band is connected with the C=O stretching vibration. The amide II peak, which occurs at 1514 cm−1, is related to N–H bending and C–N stretching vibration. The amide III band falls at 1234 cm−1 for raw wool and 1232 cm−1 for pulled wool. It results from the combination of C–N and C–C stretching, and in N–H in-plane bending with C–O bending vibrations (Chandwani et al. Citation2016). The peaks that occur in the range between 1156 cm−1 and 1022 cm−1 () are related to the asymmetric and symmetric S–O stretching vibrations of the Bunte salts residues (Erra et al. Citation1997). The raw wool sample presented two peaks at around 1027 and 1042 cm−1 which are assigned to cysteine – S–sulfonate (–S – SO3-) and cysteic acid (–SO3H) were, respectively, shifted to 1025 and 1039 cm−1 for the pulled wool sample. Furthermore, more cystine oxides appeared which are assigned to cystine monoxide (–SO – S–) around 1092 cm−1 and cystine dioxide (–SO2–S–) around 1137 cm−1. This last point indicates that cysteine was oxidized by alkali treatment in chemical unhairing (Fernández-D’Arlas Citation2018).
Figure 4. ATR-FTIR spectra of raw and pulled wool fibers;(a) the 4000–400 cm −1 region,(b) the 1250–1000 cm −1 region, (c) the 1750–1350 cm −1 region.
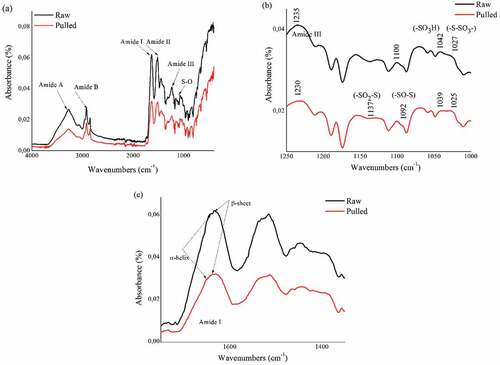
According Surewicz, Mantsch, and Chapman (Citation1993), the range between 1600 and 1700 cm−1 indicates the presence of secondary structure of a protein. For raw wool, the absorption at 1642 cm−1 is related to the crystalline α-helix structure. For the ß-sheet, it appears at 1633 cm−1. For the pulled wool, α-helix and ß-sheet occur respectively at 1650 cm−1 and 1633 cm−1. The amount of the absorbed light indicates the concentration of molecules that absorb the light (Ramaiah and Bhatia Citation2017). As shown in , it is clear that the intensity of α-helix’s peak was significantly less in the pulled wool sample. However, the range of the ß-sheet was larger.
These results will be improved by a more in-depth quantitative analysis, which would allow an assessment of the percentage per mole of each amino acid. Therefore, we explored the source of the changes in the functional groups already mentioned.
Amino acid analysis
The amino acid compositions of raw and pulled wool fibers are shown in . We can observe that the content of ½ cystine (the sum of cystine and cysteine) has apparently significantly decreased from 9.06 ± 0.06 to 6.24 ± 0.08 (mole %), while Cysteic acid appeared to have increased from 0.26 ± 0.01 to 0.35 ± 0.02 (mole %).
Table 3. The amino acids compositions of raw (R) and pulled (P) wool fibers.
The reaction of NaOH with the disulfide bonds results, therefore, from various chemical structures of cysteine. It depends on the bond of the sulfur molecule with the different chemical species found in the NaOH solution. We find cysteine, Cy-SH; Bunte Salt, Cy-S-SO3Na; cysteic acid, Cy-SO3H; cystine dioxide, Cy-SO2-S-Cy, and cystine monoxide, Cy-SO-S-Cy. A similar result was shown by (Norton and Nicholls Citation1964), who reported that cystine is modified and some main chain breakdown also occurs when wool is exposed to alkali. Furthermore, the amounts of amino acids that contribute to the α-helix formation in intermediate filaments (e.g lysine LYS, aspartic acid ASP, Histidine HIS and glutamic acid GLU) are greater in raw wool than pulled wool (Banerjee, Radvar, and Azevedo Citation2018) which explains the decrease of crystallinity.
Referring to (Aluigi et al. Citation2007), cystine contains sulfur, which gives the fiber a high elasticity and a high resistance to breakage. The lesser amount of cystine in pulled wool is the essential cause of the lower elasticity (14%).
The chemical treatment has an apparently effect on the variables of FD, which was correlated with the tensile properties (BS and T), FL, MR and Xc, which was highly correlated with (E). Thus, it is desirable to choose a method of unhairing pelts to produce a similar quality of raw wool. Our proposal for further study is to search for ecological methods, which preserve the intrinsic properties of wool and therefore its mechanical properties.
Conclusion
This research examined characteristics of pulled wool as a sustainable, biodegradable, and renewable resource with a particular fibrous structure and high content of protein. The chemical unhairing process used in the tannery appeared to induce changes in the wool properties. The fiber qualities of fineness, length, moisture regain, crystallinity, tensile properties, and elongation at break appeared to have been decreased, most probably due to the breakage of disulfide bridges and the removal of some substances within the pulled fibers microstructure. However, these fibers, which currently go to waste in some tanneries, remain suitable for various textile processes, and thus for various technical and conventional applications. Consequently, this research opens the way to a new source of wool fiber supply which is ecofriendly and economically viable, but also opens up opportunities to carry out further research toward less aggressive techniques to retrieve tannery wool, as it would allow better protection of the environment and obtain higher value recovery.
Highlights
The real quantification of pulled wool characteristics allows the increase of its potential use.
The raw and pulled wool fibers of Barbary Red Face have been thoroughly characterized.
Morphological, physical, chemical and mechanical properties of wool fibers are affected during the chemical unhairing process.
Disclosure statement
No potential conflict of interest was reported by the author(s).
References
- Aluigi, A., M. Zoccola, C. Vineis, C. Tonin, F. Ferrero, and M. Canetti. 2007. Study on the structure and properties of wool keratin regenerated from formic acid. International Journal of Biological Macromoleculess 41 (3):266–13. doi:10.1016/j.ijbiomac.2007.03.002.
- Banerjee, J., E. Radvar, and H. S. Azevedo. 2018. Self-assembling peptides and their application in tissue engineering and regenerative medicine. In Peptides and proteins as biomaterials for tissue regeneration and repair, 245–81. ScienceDirect. doi:10.1016/B978-0-08-100803-4.00010-3.
- Barani, H., and A. Calvimontes. 2014. Effects of oxygen plasma treatment on the physical and chemical properties of wool fiber surface. Plasma Chem Plasma Process 34 (6):1291–302. doi:10.1007/s11090-014-9581-x.
- Cao, J. 2000. Is the a–b transition of keratin a transition of a-helices to b-pleated sheets? Part I. In situ XRD studies. Journal of Molecular Structure 553 (1):101–07. doi:10.1016/S0022-2860(00)00538-X.
- Cao, J., and C. A. Billows. 1999. Crystallinity determination of native and stretched wool by X-ray diffraction. Polymer International 48 (10):1027–33. doi:10.1002/(SICI)1097-0126(199910)48:10<1027:AID-PI264>3.0.CO;2-9.
- Chandwani, N., P. Dave, V. Jain, S. K. Nema, and S. Mukherjee. 2016. Experimental study to improve anti-felting characteristics of merino wool fiber by atmosphere pressure air plasma . 1–16. (Research Report No. IPR/RR-776), Bhat, Gandhinagar 382 428, INDIA.
- Charlet, P., A. M. Leroy, and P. Cattin-Vidal. 1953. Variation des caractéristiques des fibres de laine, selon les régions du corps chez le mouton. [Variation in the characteristics of wool fibers, according to the body regions in sheep.]. Annales de Zootechnie 2 (2):177–88. doi:10.1051/animres:19530205.
- Clay, P. M. 2007. Wool grades guide B-409 cooperative extension service college of agriculture and home economics, the New Mexico State University. (Research Report No. 409). Retrieved from website:https://aces.nmsu.edu/pubs/_b/B409/.
- Élie, F. (2008, octobre). La Laine de mouton : Notions rudimentaires. [Sheep wool: rudimentary notions]. Retrieved from https://www.researchgate.net/publication/320408133.
- Erra, P., N. Gómez, L. M. Dolcet, M. R. Juliá, D. M. Lewis, and J. H. Willoughby. 1997. FTIR analysis to study chemical changes in wool following a sulfitolysis treatment. Textile Research Journal 67 (6):397–401. doi:10.1177/004051759706700602.
- Eslahi, N., F. Dadashian, and N. H. Nejad. 2013. Optimization of enzymatic hydrolysis of wool fibers for nanoparticles production using response surface methodology. Advanced Powder Technology 24 (1):416–26. doi:10.1016/j.apt.2012.09.004.
- Fathima, N., R. Rao, and B. U. Nair. 2012. Tannery solid waste to treat toxic liquid wastes: A new holistic paradigm. Environmental Engineering Science 29 (6):363–72. doi:10.1089/ees.2010.0445.
- Fernández-D’Arlas, B. 2018. Improved aqueous solubility and stability of wool and feather proteins by reactive-extraction with H2O2 as bisulfide (S-S) splitting agent. European Polymer Journal 103:187–97. doi:10.1016/j.eurpolymj.2018.04.010.
- Harizi, T., and F. Abidi. 2015. Characteristics of virgin and pulled wool fibres used in Tunisian handmade carpets. International Journal of Scientific & Technology Research 4 (10):368–72.
- Harizi, T., F. Abidi, R. Hamdaoui, and Y. B. Ameur. 2015. Variation in fleece characteristics of Tunisian sheep. International Journal of Textile Science 4 (5):97–101.
- Harizi, T., S. Msahli, M. Moslah, M. Hammadi, F. Sakli, and T. Khorchani. (Eds.) (2006, November). Caractérisation de la structure fine des fibres de dromadaire. [Characterization of the fine structure of camel fibers.]. Proceedings of the 2nd International Conference of Applied Research in Textile (CIRAT- 2), At Monastir, Tunisia. 30th November to 2nd December 2006
- Helal, A., and M. M. Mourad. 2009. Pulled wool as a recycled material. World Applied Sciences Journal 7 (6):693–98.
- Huson, M. G. 2018. Properties of wool. In Handbook of properties of textile and technical fibres, 59–103. ScienceDirect. doi:10.1016/B978-0-08-101272-7.00003-1.
- Kumar, A., L. L. Prince, and S. Jose. 2017. Sustainable wool production in India. In Sustainable fibres and textiles, 87–115. ScienceDirect. doi:10.1016/B978-0-08-102041-8.00004-4.
- Mahal, G. S., A. Johnston, and R. H. Burns. 1951. Types and dimensions of fiber scales from the wool types of domestic sheep and wild life. Textile Research Journal 21 (2):83–93. doi:10.1177/004051755102100205.
- McKittrick, J., P.-Y. Chen, S. G. Bodde, W. Yang, E. E. Novitskaya, and M. A. Meyers. 2012. The structure, functions, and mechanical properties of keratin. JOM 64 (4):449–68. doi:10.1007/s11837-012-0302-8.
- Memon, H., H. Wang, and E. Langat. 2018. Determination and characterization of the wool fiber yield of kenyan sheep breeds: An economically sustainable practical approach for kenya. Fibers 6 (3):1–12. doi:10.3390/fib6030055.
- Moghassem, A. R., and A. A. Gharehaghaji. 2008. Evaluating pile yarn characteristics in hand woven carpet using stress-strain behavior in compression. International Journal of Engineering, Transactions B: Applications 21 (3):303–12.
- Motaghi, Z., S. Eskandarnejad, and M. Montazer. 2014. The influence of the coarse wool treatment on fiber structure and physico-mechanical parameters. Journal of Natural Fibers 11 (1):1–12. doi:10.1080/15440478.2013.824850.
- Nasr, A. I., M. M. Abdelsalam, and A. H. Azzam. 2013. Effect of tanning method and region on physical and chemical properties of Barki sheep leather. Egyptian Journal of Sheep and Goat Science 8 (1):123–30.
- Norton, G. P., and C. H. Nicholls. 1964. The yellowing of wool by heat and alkali. Journal of the Textile Institute Transactions 55 (9):T462–76. doi:10.1080/19447026408662425.
- Ogawa, S., K. Fujii, K. Kaneyama, and K. Arai. 2000. A curingmethodfor permanent hair straightening using thioglycolicand dithiodiglycoliaccids. Journal of Cosmetic Science 51:379–99.
- Parlato, M. C. M., and S. M. C. Porto. 2020. Organized framework of main possible applications of sheep wool fibers in building components. Sustainability 12 (3):761–77. doi:10.3390/su12030761.
- Poole, A. J., and J. S. Church. 2015. The effects of physical and chemical treatments on Na2S produced feather keratin films. International Journal of Biological Macromolecules 73:99–108. doi:http://dx.doi.org/10.1016/j.ijbiomac.2014.11.003.
- Ramaiah, G. B., and D. Bhatia. 2017. Structural analysis of merino wool, pashmina and angora fibers using analytical instruments like scanning electron microscope and infra-red spectroscopy. International Journal of Engineering Technology Science and Research 4 (8):112–25.
- Rippon, J. A. 2008. Friction, felting and shrink-proofing of wool. In Friction in Textile Materials, 253–91. ScienceDirect. doi:10.1533/9781845694722.2.253.
- Rogers, G. E. 1985. Genes for hair and avian Keratins. Annals of the New York Academy of Sciences 455:403–25. doi:10.1111/j.1749-6632.1985.tb50425.x.
- Russell, S., P. Swan, M. Trebowicz, and A. Ireland. 2016. Review of wool recycling and reuse. In Natural fibres: advances in science and technology towards industrial applications, ed. R. Fangueiro and S. Rana, 415–28. Dordrecht: Springer Netherlands.
- Shakyawar, D. B., V. Kadam, A. K. Surya, A. Ahmed, P. K. Pareek, and P. Temani. 2013. Precise measurement of wool fibre diameter using computerized projection microscope. The Indian Journal of Small Ruminants 19 (2):192–94.
- Sitotaw, D. B., A. H. Woldemariam, A. F. Tesema, and A. B. Gebre. 2019. Characterizing the wool fiber fineness and crimps of menz, dorper and their crossbreed sheep. Journal of the Institution of Engineers (India): Series E 100 (2):121–29. doi:10.1007/s40034-019-00144-2.
- Surewicz, W. K., H. H. Mantsch, and D. Chapman. 1993. Determination of protein secondary structure by Fourier transform infrared spectroscopy: A critical assessment. Biochemistry 32 (2):389–94. doi:10.1021/bi00053a001.
- Wang, Y. 2010. Fiber and textile waste utilization. Waste Biomass Valor 1 (1):135–43. doi:10.1007/s12649-009-9005-y.
- Westmoreland, D. J., A. C. Schlink, and J. C. Greeff. 2006. Factors affecting wool scouring performance, yield and colour measurements of Western Australian fleece wools. Australian Journal of Experimental Agriculture 46 (7):921–25. doi:10.1071/EA05352.
- Xu, W., G. Ke, J. Wu, and X. Wang. 2006. Modification of wool fiber using steam explosion. European Polymer Journal 42 (9):2168–73. doi:10.1016/j.eurpolymj.2006.03.026.
- Zoccola, M., A. Aluigi, A. Patrucco, C. Vineis, F. Forlini, P. Locatelli, M. C. Sacchi, and C. Tonin. 2012. Microwave-assisted chemical-free hydrolysis of wool keratin. Textile Research Journal 82 (19):2006–18. doi:10.1177/0040517512452948.