
 ?Mathematical formulae have been encoded as MathML and are displayed in this HTML version using MathJax in order to improve their display. Uncheck the box to turn MathJax off. This feature requires Javascript. Click on a formula to zoom.
ABSTRACT
The aim of this paper is to develop an objective set of hand equations for bedsheet fabrics that are produced from conventional or non-conventional fibers such as cotton, polyester, modal, viscose, Excel, and their blends. In order to evaluate the fabric hand of bed sheets objectively, four primary hand values such as Sofutosa (soft feeling), Numeri (smoothness), Fukurami (fullness), and Koshi (stiffness) are selected by the opinion of experts. Eight basic mechanical properties have been used to develop primary and total hand equations. The computational (objective evaluation) methods of total hand values of bed sheets were developed by using subjective total hand values and low-stress mechanical properties of bedsheets by the stepwise block residual regression method. From the regression equation, the computational value of all samples has been generated to compare with the subjective and experimental values and investigate the correlation between experimental, subjective, and computational total hand value. According to the study, the correlation value (R) between experimental and computational is 0.856, and between subjective and computational is 0.964. In this study, the equation obtained shows a strong correlation between the subjective and experimental results, which confirms that the total hand value of the bed linen fabrics can be anticipated with a tolerable accuracy level.
摘要
本文的目的是为由常规或非常规纤维(如棉、聚酯、莫代尔纤维、粘胶纤维、擅长及其混纺纤维)生产的床单织物建立一套客观的手部方程式. 为了客观地评估床单的织物手感,根据专家的意见选择了Sofutosa(柔软感)、Numeri(平滑度)、Fukurami(丰满度)和Koshi(刚度)等四个主要手感值. 八个基本力学性质已被用于开发主要和全部手部方程. 通过使用主观总手值和床单的低应力机械性能,采用逐步块残差回归法,开发了床单总手值的计算(客观评估)方法. 根据回归方程,生成了所有样本的计算值,以与主观值和实验值进行比较,并调查实验值、主观值和计算总手值之间的相关性. 根据研究,实验和计算之间的相关值(R)为0.856,主观和计算之间为0.964. 在这项研究中,所获得的方程式显示了主观结果和实验结果之间的强相关性,这证实了可以以可容忍的精度水平预测床单织物的总手感值.
A good night’s sleep is one of the most important things one can give to their mind and body. There are many factors that directly or indirectly contribute to quality sleep (He, Lian, and Chen Citation2019; Li et al. Citation2021). Good blinds, color psychology, a great mattress, bedroom ambiance, and bedding quality are just a few of the attributes that must be carefully chosen (Troynikov, Watson, and Nawaz Citation2018). Studies have been done regarding the factor of bed sheet quality on human sleeping qualities at different times, which reveal the fiber material, thread count, and hand of the bed sheet are used to select the best quality bed sheet (Ahirwar and Behera Citation2021; Chanda et al. Citation2020; Dubale et al. Citation2021).
Sheeting of some kind has existed for millennia. It is unknown when sheeting was first used to retain the sleeper’s comfort, but it is probable that the first true bed sheets were linen (Handley Citation2018). Linen, derived from the flax plant, has been cultivated for centuries and was expertly cultivated, spun, and woven by the Egyptians (Lewis Citation2020). In the usage of sheeting cloth, people need some basic and essential properties from the fabric, such as high moisture absorbency, soft feeling, durability and longevity, insulation properties, breathability, hypoallergenic properties, easy care, and environmentally friendly sheets (Ayling-Smith Citation2018; Yen et al. Citation2020). Due to their comfort, level of hygiene, softness, and water absorption ability, cotton and cotton/polyester mixed yarns are used to make the bulk of bed linens. For home bedding, materials like cotton and its blends are regarded as optimal. The majority of individuals select these materials because they are affordable and have durable properties (Bilen Citation2021; Ejegu, Kumar, and Gupta Citation2021).
Natural fibers, regenerated cellulosic fibers, and synthetic fibers are chosen based on the ultimate application, cost, and durability of the textiles. They are also chosen based on their comfort and aesthetic features. In order to obtain a variety of structural and functional qualities as well as lower costs, bed linen is also manufactured from blends of other complementary natural and synthetic fibers. Fabrics made of linen exhibit good aesthetic and drape qualities (Hu, Wang, and Sun Citation2021; Vasile et al. Citation2019).
Cotton variety and thread count alone show a good quality bed sheet, but there are different factors that affect a sheet’s quality and feel. The majority of bed linens are either colored or printed, so the method needs to be chemical-free and skin-friendly. The fabric’s weave and composition also determine its breathability, or whether it will stay cool against our skin or warm up (Beyene and Kumelachew Citation2022; Khan et al. Citation2020; Roberts Citation2018).
The hand of textiles is a crucial element influencing the purchase of textiles by individuals. Knowing the hand features of produced textiles and being able to analyze or predict them on the basis of textile components could provide producers and hand analysis experts with a tool that would allow individuals to be assured of final products with the best hand features, which may also refer to the judgment of ergonomic or sensorial or thermal wear comfort (Ahirwar and Behera Citation2022; Zhang, Kan, and Zhou Citation2022).
Both subjective evaluation and objective measurements can be used to determine the fabric hand value. The traditional way of conveying clothes that relies on human experience, expertise, and varying sensitivity is known as subjective assessment (Sudhakar and Renjini Citation2022; Tadesse et al. Citation2019). The scientific method of determining the hand of a fabric by examining the connections between a person’s sensory responses and instrumental data. With the emergence of novel synthetic fiber types, different technological advancements, and new textile products, the significance of the objective evaluation of fabric hand is increasing. The handling value of the fabrics determines whether new textile goods succeed or fail. The panel of judges and the level of agreement among the judges’ rankings are crucial factors in the subjective evaluation of fabrics. Slide the fabric between fingers and thumb to evaluate the handle attributes, which include the fabric’s bulk, crispiness, smoothness, hardness, and softness (Abreu et al. Citation2014).
The Kawabata hand evaluation system for fabrics (KES-F) was developed in Japan by the Hand Evaluation and Standardization Committee (HESC, established in 1972) organized by Professor Kawabata (Phoophat et al. Citation2020; Utkun Citation2021). KES-H created an objective hand evaluation for fabrics used in men’s suits. This system measures the low-stress mechanical properties of fabrics, including tensile, shear, bending, and compression, and calculates the fabric’s total hand value. For the first time, the cloth hand was quantitatively measured in a single digit. Utilizing a collection of tools that gauge the fabric’s low-stress mechanical qualities, they converted the subjective assessment into an objective evaluation. Following its successful use in men’s suits, this technique was expanded to include other fabrics such as shirting, materials for ladies’ dresses, nonwoven fabrics, and some specialty fabrics like futon cloth terry fabrics, disposable diapers, top sheets, and blankets, among others (Matsudaira and Kubo Citation1996). Therefore, Kawabata and Niwa created a number of hand formulae for various textiles.
The anticipated discussion clearly demonstrates that objective evaluation of bed linen fabrics and fabric engineering are still in their early stages. The criteria for accepting the quality of a bed sheet have yet to be developed. These Kawabata hand equations cannot be applied to bed linen fabrics because they are specific to apparel fabrics and the pressures acting on bedding fabrics differ from those acting on other apparel fabrics. As a result, in this study, a computational method was used to create an objective hand evaluation system of bed linen fabrics. The computational method employed the stepwise block residual regression method. The computational method’s total hand values were validated using subjective total hand values and low-stress mechanical properties of bedsheets. From the regression equation, the computational value of all samples has been generated to compare with the subjective and experimental values and investigate the correlation between experimental, subjective, and computational total hand value.
Materials and methods
Materials
Bed sheet fabric
Under industrial manufacturing conditions, a diverse range of bed sheet samples is produced. Fabrics were created using the CCI Tech sample weaving machine. The samples are developed by selecting different types of natural and man-made fibers and their blends with cotton, viscose, modal, excel, polyester, modal/cotton, and cotton/viscous. To improve accuracy, four samples were taken from each sample, and the average of these was used as the final result. The detailed sample specifications are mentioned in .
Table 1. Fabric Samples and their specification.
Methods
Subjective evaluation of fabric
The subjective survey of the primary and total hand of bedsheet fabrics was conducted among 15 experts. The experts are textile engineers and researchers in textile technology. Before this Survey process, the experts are well-trained with the purpose of the study and the assessment methods. subjective survey is done by touch/rub/squeeze the sample fabrics by hand according to AATCC evaluation procedure (Abreu et al. Citation2014). This survey was divided into two parts, in the first step of the survey, the experts were asked to give a rating and percentage to the primary attributes of a good bed sheet fabric. In the second step of the survey, samples were supplied to them one by one, and they ranked the samples according to the intensity of feeling in primary hand expression and total hand expression. Samples were supplied to them one by one and they ranked the samples according to the intensity of feeling in primary hand expression and total hand expression. Primary hands were rated from 0 (No feeling) to 10 (Excellent hand feeling), and total hands were rated from 0 (Not useful) to 5 (Excellent).
Experimental evaluation of fabrics
The Kawabata evaluation system (KES) instruments measure sixty low-stress mechanical properties of the fabric, which helps us calculate the primary and total hand value of fabrics. In KES instruments, there are four different types of testing instruments which measure tensile and shear, bending, compression, and surface properties of samples. For KES machines, there are many formulas depending on the end-use application, but for these samples, the futon covering equation has been selected. For this formula, sixty low-stress mechanical properties and other related properties such as air resistance and water resistance should be measured (Matsudaira and Kubo Citation1996). A total of eighteen properties are included for calculating total hand value as described in the following methods.
KES-F1 Shear/Tensile Testing
This instrument measures the load-extension characteristics of fabric sample size of 200 mm width *200 mm of gauge length to a load of 500 gf/cm (490 N/m). In the second mode of operation, it measures the stress-strain characteristics of the same sample in cyclic shear deformation between a shear strain of + 8 deg and −8 deg.
KES-F2 Bending Testing
It used to measure the couple – curvature characteristics of a 200 mm width *10 mm length of sample in cyclic bending deformation between curvature of 2.5 cm–1 and −2.5 cm–1.
KES-F3 Compression Testing
This instrument measures the pressure – thickness characteristics of fabric up to a pressure of 50 gf/cm2.
KES-F4 Surface Testing
This instrument measures the frictional force generated when the fabric is moved under a metallic friction head. In its second mode of operation, it measures the vertical movement of a probe under a 10-gf load as it moves over the surface of the fabric.
Air Resistance testing
Air resistance of fabric was chosen on behalf of the thermal insulation value of cloth. (Matsudaira and Kubo Citation1996), it can be calculated with the following equation:
R = 12.45/x
Where R: air resistance (KPa•s/m)
X: the amount of air measured by the fragile method (cm 3/cm 2/s)
Water Regain
The water regain (%) at standard conditions (20°C, 65% RH) was chosen for bed sheet cloth comfortability. For example, the water regain of fabrics which are made of Modal/cotton (70%/30%) blended yarns was calculated on the weighted average of the water regain of each fiber. After measuring the low-stress mechanical properties of the fabric, the KES instrument has software that can calculate the total hand value of the fabric by using a different type of equation. Which of these equations is selected depends on the end-use application of the fabric.
Development of hand equation for bed sheet
A new equation was developed for the hand evaluation of bed sheet fabrics used in the algorithm as shown in .
Figure 1. Algorithm for hand evaluation.
Approach to calculate the THV computational method
The Kawabata evaluation system is one of the most frequently used systems for the prediction of hands. Fabric hand is derived from a combination of primary sensory elements such as softness, stiffness, and roughness, and the ultimate judgment of the hand of a fabric is dependent on the specification of the end-use area. The hand is primarily influenced by the mechanical property of a fabric (Bajzík Citation2016).
A method of stepwise block residual regression developed by Kawabata was used for regression to clarify the contribution of the basic mechanical properties on primary hands (Kawabata et al. Citation1994). a stepwise block regression method by considering many actual conditions and also eliminating the effects of the correlations between mechanical parameters X, This method was originally based on the stepwise regression analysis. In this Method Variables are grouped into the blocks, each block corresponding to a fabric property. In the first step, Y is regressed with each of the variable groups separately to choose the block with the highest regression accuracy. The resulting regression error is then regressed with each of the remaining blocks in the same manner as the first step. The first and second regression equations are added to form a new regression equation where the two blocks are regressed. The same procedure is repeated until the last block is completed. After the regression equation is complete, we again apply the stepwise regression to variables in the first block to reconstruct the regression equation for the first block, then the variables of the second block are regressed stepwise, and the new regression equations of the first and second blocks are added. [31].
Using this regression method, subjective primary hand value is regressed with the mechanical properties of each of the blocks, and the regression equations for each block are obtained as follows.
The square bracket indicates the normalized value and characteristic value of the corresponding block properties. All sets of Yc values are calculated using the above equation. The correlation between the above-mentioned three sets of Yc values and the experimental primary hand value Y is checked. The block that relates to the highest correlated set of Yc is picked up and named as the first block. The experimental hand value is replaced by the residual (Y-Yc) of the above-chosen first block and regressed with each of the remaining blocks separately by the same procedure as mentioned in the first step. The second block is determined in the same manner as described in the second step. Continuing the stepwise regression, the order of importance of each block is determined. Keeping the above order intact, the stepwise regression is applied for each characteristic value in each block, and the order of importance of each characteristic value in each block is determined. Finally, a linear equation for predicting Y is obtained. The above procedure is repeated for each primary hand expression. The order of the blocks indicates the importance of the blocks to the primary hand value Y. This is very useful for analyzing the expert’s hand feelings and for finding out the interrelation between the expert’s hand and the physical or mechanical properties of fabrics. The final equations obtained will have the form of EquationEquation 6(6)
(6) .
Where Y=hand value
Xi= ith characteristic value or its logarithm,
Xmi, σi = mean value and the standard deviation of the ith characteristic value, C0, Ci parameter (constant coefficient), N= total number of mechanical properties. With the help of different values of properties tested, different hand equations in the above format have been obtained as Y1, Y2, Y3, … … …Yk.
Development of Total Hand Equation
The translation equation from HV to THV developed for fabrics will take the form as follows:
Where,
Here, Yi = primary hand values, Mi1, Mi2 = mean values of Yi and Yi2, σi1, σi2 = standard deviation of Yi and Yi2, respectively. C00, Ci1, Ci2 = constant parameters and k = number of primary hands.
Results and discussions
Subjective evaluation of fabric
Six different fabric samples were used for subjective assessment, and a panel of 15 judges performed the subjective hand evaluation. These analyses were made under identical environmental conditions. In the first step of the survey, the evaluator was asked to give rank and percentage to the primary attributes of a good bed sheet fabric. The soft sensation receives 39% of the weightage while the smoothness, fullness, and stiffness sensations receive 26, 18, and 17%, respectively.
The second step of the survey, Based on the above rating, the evaluator is given their result as follows for each primary and total hand value as shown in . The result is based on the mean value of 15 evaluators.
Table 2. Subjective primary and Total Hand Values.
The experts select the criterion for fabric hand based on the end-use application of the fabric. Simultaneously, the proportion of importance of these terms in evaluating fabric quality was estimated. The evaluators selected Sofutosa, Numeri, Koshi, and Fukurami as four primary hand expressions for bed sheets. After selecting the primary hand expression for the bed sheet, then define each expression as follows.
A sofutosa is strongly related to flexibility, surface property, and compression. A koshi, or a stiff feeling from springy property, promotes its feeling. High-density fabrics possess this feeling strongly. A numeri hand expression depends on the properties that possess flexibility, smoothness, a touch of smooth bending and springy properties in bending. Fukurami’s hand expression relates to a springy property in compression and thickness accompanied by a warm feeling.
According to the expert assessment, a fabric made from modal fiber has a higher primary hand value in softness, smoothness, and stiffness, and it has a lower primary hand value in fullness. But the total hand value of modal is lower than modal cotton blend due to modal fabrics’ higher stiffness than modal-cotton fabrics.’ This is because modal fibers are dimensionally stable, highly wear resistant, and strong while maintaining a soft, silky feel compared to other fibers (Latif et al. Citation2019).
Polyester (PET) fabric, which has the lowest primary hand value in soft feeling, smoothness, and stiffness and is lower in fullness. Due to polyester fibers’ poor moisture absorption, their clothing makes the wearer feel hot and sticky. It also produces static electricity easily, which is reflected in clothing absorbing dust and clinging to the body, which, in fact, has poor comfort (Cavalcanti et al. Citation2021).
Based on the subjective result, the sample made from a modal cotton blend shows a higher total hand value than the other samples, but a fabric made from 100% polyester fiber shows less than the other samples but generally gets a fair hand value.
Developing computational hand equation for bed sheet
Stepwise block regression method was used to develop the hand equation (Bajzík Citation2016). According to the opinion of the judges, here the assumption is made that only three blocks of properties such as surface and compression characteristics also weight and thickness of sample has influence on the bed sheet. These characteristics can detail explained the hand behavior of bed sheet fabric. The measurement of each characteristic is mentioned in . It is done in Kawabata evaluation testing equipment’s and the result are mention as follow. The mechanical properties of the samples which mention in the below table and the subjective evaluation of primary and total hand value of fabrics used to make stepwise block regression.
Table 3. Mechanical property of samples.
Development of new primary hand equation SOFUTOSA (soft feeling)
As shown in , stepwise block regression is applied to the block and the order of blocks has been obtained according to their contribution to the primary hand. Then, keeping this order of block conserved, the stepwise block regression is again applied to individual properties of each block and the coefficients have been obtained as shown in .
Figure 2. Stepwise block regression for the analysis of PH1 SOFUTOSA (Soft feeling).
Table 4. Coefficient of Primary hand equation SOFUTOSA (Soft feeling).
The obtained first primary hand equation for SOFUTOSA (soft feeling) is shown as equation 1.
Development of new primary hand equation NUMERI (smoothness)
As shown in , stepwise block regression is applied to the block and the order of blocks has been obtained according to their contribution to the primary hand. Then, keeping this order of block conserved, the stepwise block regression is again applied to individual properties of each block and the coefficients have been obtained as shown in .
Figure 3. Stepwise block regression for the analysis of PH2 NUMERI (smoothness).
Table 5. Coefficient of Primary hand equation NUMERI (smoothness).
The obtained second primary hand equation for NUMERI (smoothness) is shown as EquationEquation 6(6)
(6) .
Development of new primary hand equation for FUKURAMI (fullness)
As shown in stepwise block regression is applied to the block and the order of blocks has been obtained according to their contribution to the primary hand. Then, keeping this order of block conserved, the stepwise block regression is again applied to individual properties of each block and the coefficients have been obtained as shown in .
Figure 4. Stepwise block regression for the analysis of PH3 FUKURAMI (fullness).
Figure 5. Stepwise block regression for the analysis.
Table 6. Coefficient of Primary hand equation FUKURAMI (fullness).
The obtained third primary hand equation for FUKURAMI (fullness) is shown as EquationEquation 6(6)
(6) .
Development of new primary hand equation for KHOSHI (stiffness)
As shown in , stepwise block regression is applied to the block and the order of blocks has been obtained according to their contribution to the primary hand. Then, keeping this order of block conserved, the stepwise block regression is again applied to individual properties of each block and the coefficients have been obtained as shown in .
Figure 6. Comparison of Total hand value.
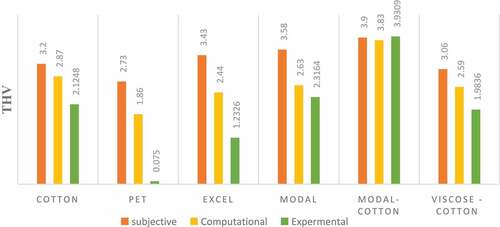
Table 7. Coefficient of Primary hand equation KHOSHI (stiffness) of PH4 KHOSHI (stiffness).
The obtained fourth primary hand equation for KHOSHI (stiffness)is shown as EquationEquation 6(6)
(6) .
Development of new total hand equation
Total subjective hand values and primary hand values were regressed in the similar fashion as mentioned above; the total hand equation for the bed sheet fabric has been obtained, which is shown as EquationEquation 6(6)
(6) ), and the constants are given in .
Table 8. Primary hand expressions and coefficients for equation used for objective evaluation of THV of bed sheet fabric (C00 = 2.98).
The equation derived using the sample results, called the bed sheet fabric THV equation (EquationEquation 6(6)
(6) ), and has the form as shown in EquationEquation 6
(6)
(6) .
Where
According to the new developed equation the modal/cotton blend fabric shows better hand value than the others. But 100% polyester fabric show lower hand value than the other fabrics as the result shown in .
Table 9. The computational Total hand value.
Experimental evaluation of fabric
In objective hand measurement, it is necessary to translate an appropriate set of measured mechanical and surface properties into HV and THV. The characteristics of low stress mechanical and surface properties of the fabric are measured by using a Kawabata evaluation system. The selected primary and total hand value are influenced by mechanical properties.
To calculate the total hand value of the bed linen fabrics, the futon covering equation is preferred among the other equations that were developed in the Kawabata evaluation system. This equation is derived from sixteen low-stress mechanical properties, water regain, and the air resistance of the fabric and the subjective evaluation of the experts by using the stepwise block regression method (Matsudaira and Kubo Citation1996). The total hand value of the experimental, which was found by using the Kawabata evaluation system, is expressed in the following .
Table 10. Low Stress Mechanical Properties offensive.
The total hand value is higher for the cotton/modal blend fabric compared to other five-bed sheet fabrics. This is because both fibers have soft and smooth properties (Hawlader et al. Citation2018; Latif et al. Citation2019). When compared to the other samples, a 100% polyester has a very low hand value. A 100% cotton fabric and a cotton/viscous fabric show almost the same hand value because viscose shares the same qualities and features as cotton, especially those of appearance (Arunkumar and Murugarajan Citation2021; Hawlader et al. Citation2018).
Comparison of total hand value
During the development of the hand equation, there were three types of total hand values that were mentioned separately. The first one is the hand value, which comes from the subjective assessment of experts; they give their hand value for each sample. The second type of total hand value, which comes from the newly developed bed sheet total hand equation, this equation was developed by a stepwise block regression method. The third total hand value is from the experimental (KES) result. shows the relationship between them.
In this graph, there are three types of results. The subjective assessment of fabric is higher than the computational and experimental hand values in most cases. The modal cotton blend fabric shows the highest subjective, computational, and experimental value. Polyester fabric shows a lower value in both computational and experimental total hand value.
The total hand value of the modal-cotton blend fabric shows the highest total hand value of the other samples. But a fabric made from 100% polyester fiber shows very poor hand value compared to others. The modal cotton blend fabric shows a higher total hand value. It comes from the linearity of compression. When the LC is lower, it gives a softer feeling in compression for the sample. This fabric also has a lower value of surface frictional roughness, which means the fabric has a smooth hand feel. The thickness of modal cotton fabric is lower and it gives the fabric less stiffness. Polyester fabric has poor hand value, which means LC is higher and it gives a hard feeling under compression. This fabric has a higher value of surface frictional roughness; it means the fabric has a rough hand feel.
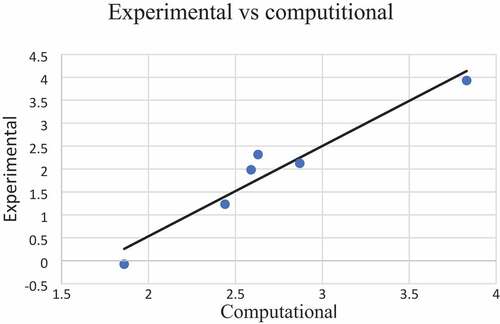
As shown from , the correlation between subjective and computational, subjective and experimental, and computational and experimental is 0.835, 0.855, and 0.964, respectively. For several dress materials such as suits and shirts, the THV correlation obtained by Kawabata, Niwa, Matsudaira, etc. falls in the range of 0.81–0.88, which is considered an acceptable range as a lot of human perception and climatic factors are involved. The total hand value of the fabrics falls in the range of 2.7–3.9 in the case of the subjective assessment, 1.86–3.83 in the case of the computational, and 0.75–3.93 in the case of the experimental assessment. Which means the hand value falls into the poor to average range in all three cases.
Figure 7. Correlation between the Experimental and subjective.
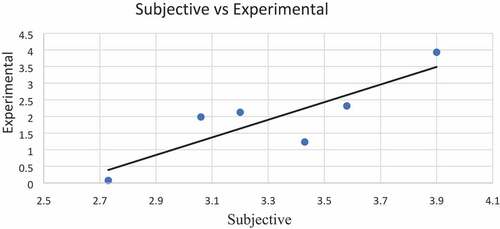
Figure 8. Correlation between the computational and subjective.
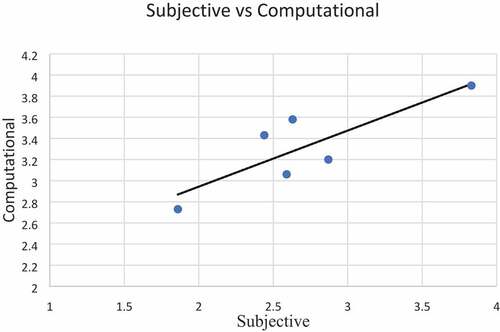
Figure 9. Correlation between the Experimental and computational.
Conclusion
This paper tries to develop the hand equation for bed sheet fabric and make a comparison between total hand values. The equations were created using the stepwise block regression method by using subjective hand values and the mechanical properties of fabrics. The developed primary and total hand equations were validated by comparing subjective and experimental total hand values, the suitability of the existing hand equation on the futon’s cloth was also assessed. The subjective assessment is done by an expert, and the KES equipment is used to measure the low-stress mechanical properties of the sample fabric and also calculate the total hand value of the fabric. According to the findings of this study, the surface properties of bed linen fabrics were the most important for good hand, followed by weight, thickness, and compression properties. Based on the newly developed equation, the modal/cotton blend fabric shows better hand value than the others. But 100% polyester fabric shows a lower hand value than the other fabrics. The correlation coefficient between the subjective and computational is 0.835, and the correlation coefficient between experimental and computational is 0.964. This indicates that the correlation between experimental and computational hand values was much stronger than the correlation between subjective and computational hand values. Thus, the derived equations can be used to accurately estimate the computational total hand value.
Highlights
A modal fiber has a higher primary hand value in soft feeling, smoothness, and stiffness.
The newly developed equation the modal/cotton blend fabric shows better hand value than the others.
The total hand value is higher for the cotton/modal blend fabric compared to the other five-bed sheet fabrics.
The modal cotton blend fabric shows the highest subjective, computational, and experimental value.
Polyester fabric shows a lower value in both computational and experimental total hand value
Acknowledgements
This work was supported by the Indian Institute of Technology Delhi (IIT-DELHI), in the laboratory of the textile technology Department.
Disclosure statement
No potential conflict of interest was reported by the author(s).
Data availability statement
The data supporting the findings of this study are all presented within the article.
Additional information
Funding
References
- Abreu, M.J. Vidrajo.C. and Soares. G.M. 2014. Optimization of the thermal comfort properties of bed linen using different softening formulations. Textile and Apparel 24 (2):219–17.
- Ahirwar, M., and B. Behera. 2021. Prediction of handle value of bed linen fabrics using computational method. Journal of Natural Fibers 19:1–17. doi:10.1080/15440478.2021.1887044.
- Ahirwar, M., and B. Behera. 2022. Development of hemp-blended cotton fabrics and analysis on handle behavior, low-stress mechanical and aesthetic properties. The Journal of the Textile Institute 113 (5):934–42. doi:10.1080/00405000.2021.1909799.
- Arunkumar, K., and A. Murugarajan. 2021. Evaluation of mechanical properties and surface roughness of cotton–viscose hybrid composite. Polymers and Polymer Composites 29 (3):188–97. doi:10.1177/0967391120909052.
- Ayling-Smith, B. 2018. The bedsheet: From linen cupboard to art gallery. Textile 16 (3):287–300. doi:10.1080/14759756.2018.1432142.
- Bajzík, V. 2016. Some approaches to objective evaluation of fabric hand. World Journal of Textile Engineering and Technology 2 (1):1–11.
- Beyene, K. A., and D. M. Kumelachew. 2022. An investigation of the effects of weave types on surface roughness of woven fabric. Textile Research Journal 92 (13–14):2276–84. doi:10.1177/00405175211010683.
- Bilen, U. 2021. The effect of linen and linen blends on the comfort properties of bedding fabrics. Journal of Natural Fibers 18 (3):430–41. doi:10.1080/15440478.2019.1624997.
- Cavalcanti, D., M. D. Banea, J. Neto, and R. Lima. 2021. Comparative analysis of the mechanical and thermal properties of polyester and epoxy natural fibre-reinforced hybrid composites. Journal of Composite Materials 55 (12):1683–92. doi:10.1177/0021998320976811.
- Chanda,T.,Ahirwar,M., and Behera, B. K. 2020. Appraisal of bed linen performance with respect to sleep quality. Textile & Leather Review. 3(1):19–29. doi:10.31881/TLR.2020.01.
- Dubale, M., H. Ejegu, W. Mamuye, and S. Addis. 2021. Development of bed linen performance index. Journal of Engineering 202. doi:10.1155/2021/1220130.
- Ejegu, H., B. Kumar, and P. Gupta. 2021. Behavior of elastic therapeutic tapes under dynamic and static conditions. Advances in Materials Science and Engineering 2021. doi:10.1155/2021/6671712.
- Handley, S. 2018. Objects, emotions and an early modern bed-sheet. In History Workshop Journal(vol.85, pp169-194). Oxford Academic.
- Hawlader, M. R., Samara Islam Nishi,M. and Uddin,N. 2018. A potential approach to analyze the optimum characteristics of cotton/modal & cotton/viscose blended yarn. Global Journal of Research in Engineering. Vol.18 issue.2.ISSN 2249-4596.
- He, M., Z. Lian, and P. Chen. 2019. Evaluation on the performance of quilts based on young people’s sleep quality and thermal comfort in winter. Energy and Buildings 183:174–83. doi:10.1016/j.enbuild.2018.10.040.
- Hu, X., J. Wang, and F. Sun. 2021. Characterization of touch sensory attributes of fabrics by a simultaneous-mechanical measurement method. IEEE Transactions on Instrumentation and Measurement 70:1–9. doi:10.1109/TIM.2021.3060595.
- Kawabata, S., Niwa, M., and Wang,F. 1994. Objective hand measurement of nonwoven fabrics: Part I: Development of the equations. Textile Research Journal. 64(10):597–610. doi:10.1177/004051759406401008.
- Khan, M. R., Rasel, M., and Das, D. 2020. Effect of thread count and stitch density (SPI) on 2/1 twill woven fabric. International Journal of Science and Business 4 (3):37–45.
- Latif, W., Basit, A., Rehman,A., Ashraf,M., Iqbal,K., Jabbar,A., Baij,S.A., and Maqsood,S. 2019. Study of mechanical and comfort properties of modal with cotton and regenerated fibers blended woven fabrics. Journal of Natural Fibers. 16(6):836–45. doi:10.1080/15440478.2018.1441084.
- Lewis, T. J. 2020. Ugaritic Athtartu šadi, food production, and textiles: More data for reassessing the biblical portrayal of Aštart in context, 138–59. Brill: Mighty Baal.
- Li, X., Zhou, B., Shen, L., and wu, Z. 2021. Exploring the effect of mattress cushion materials on human–mattress interface temperatures, pre-sleep thermal state and sleep quality. Indoor and Built Environment. 30(5):650–64. doi:10.1177/1420326X20903375.
- Matsudaira, M., and M. Kubo. 1996. Objective evaluation of hand for futon cloth. Journal of the Textile Machinery Society of Japan 42 (1–2):23–35. doi:10.4188/jte1955.42.23.
- Phoophat, P., Kumphai, P., Suwonsichon, S., Boonyarit, J., Plangmon, C., and Chollakup,R. (2020). Application of Kawabata evaluation system for the tactile properties of woven silk fabrics in textile industry. IOP Conference Series: Materials Science and Engineering (Vol.773, No. 1, p. 012035),IOP Publishing.
- Roberts, L. M. (2018). “Experts choose the sheets they love best.” Washingtonpost.com.
- Sudhakar, R., and G. Renjini. 2022. Evaluation and prediction of fused fabric composites properties–a review. Journal of Industrial Textiles 51(3_suppl):3536S–74S. doi: 10.1177/1528083720919859
- Tadesse, M. G., Chen, Y., Wang, L., Nierstrasz, V., and Loghin, C. 2019. Tactile comfort prediction of functional fabrics from instrumental data using intelligence systems. Fibers and Polymers. 20(1):199–209. doi:10.1007/s12221-019-8301-9.
- Troynikov, O., C. G. Watson, and N. Nawaz. 2018. Sleep environments and sleep physiology: A review. Journal of Thermal Biology 78:192–203. doi:10.1016/j.jtherbio.2018.09.012.
- Utkun, E. 2021. Comparison of sensorial comfort properties of different cotton fabrics using the Kawabata Evaluation System. Industria Textila 72 (6):587–94. doi:10.35530/IT.072.06.20217.
- Vasile, S., B. Malengier, A. De Raeve, and F. Deruyck. 2019. Influence of selected production parameters on the hand of mattress knitted fabrics assessed by the fabric touch tester. Textile Research Journal 89 (1):98–112. doi:10.1177/0040517517736471.
- Yen, L. Z., Nasir,S.H., Huzaisham, N .A., Mahmood, S., Marsi, N., Rashid, A.H.A., Bakri, M.E., and Misnon, M. I. 2020. THE INFLUENCE OF PHYSICAL PROPERTIES ON COMFORT PERFORMANCE OF BEDSHEET FABRICS. Technology 11 (11):1018–29.
- Zhang, Q., C. -W. Kan, and H. -L. Zhou. 2022. Hand value optimization of printable interlining technique design on woolen fabric via orthogonal analysis. Textile Research Journal. 00405175221094047. doi: 10.1177/00405175221094047.