
 ?Mathematical formulae have been encoded as MathML and are displayed in this HTML version using MathJax in order to improve their display. Uncheck the box to turn MathJax off. This feature requires Javascript. Click on a formula to zoom.
ABSTRACT
In recent years, man-made fibers have been largely replaced by natural fibers as a reinforcement in polymer composites. Hemp fiber has the ability to be used as reinforcement in polymer composites due to its biodegradability, abundance, higher fiber production per acre, rapid growth rate, and high strength-to-weight ratio. Before reinforcing any fiber/fabric into the matrix to form composites, its characteristics should be investigated. The quality of the fiber has a significant impact on the properties of fiber reinforced composites. The fabric’s strength has a significant effect on the performance of a composite because it bears majority of the load. This paper describes modern and systematic methods for examining the physical and mechanical properties of industrial hemp fiber and its fabric. The hemp fiber is characterized in this study based on its constituents. Additionally, thermal stability, crystallinity, elemental analysis, and Fourier transform infrared spectroscopy are determined. The study discovered that the fiber had a high crystallinity value, a higher tensile modulus, and a breaking force comparable to some synthetic fibers. Because of the properties obtained, hemp fiber and fabric are suitable alternatives for use as reinforcing materials in polymer composites.
摘要
近年来,作为聚合物复合材料的增强材料,人造纤维已被天然纤维大量取代. 大麻纤维由于其生物降解性、丰富性、每英亩纤维产量高、生长速度快、强度与重量比高,因此有能力用作聚合物复合材料的增强材料. 在将任何纤维/织物增强到基体中以形成复合材料之前,应研究其特性. 纤维的质量对纤维增强复合材料的性能有重要影响. 织物的强度对复合材料的性能有重要影响,因为它承受大部分载荷. 本文介绍了工业大麻纤维及其织物物理力学性能的现代系统检测方法. 本研究根据大麻纤维的成分对其进行了表征. 此外,还测定了热稳定性、结晶度、元素分析和傅里叶变换红外光谱. 研究发现,这种纤维的结晶度高,拉伸模量高,断裂力与某些合成纤维相当. 由于所获得的性能,大麻纤维和织物是用作聚合物复合材料增强材料的合适替代品.
Introduction
Over the years, researchers have used man-made fibers with a long life that end up in landfills after use. This is a significant issue for the environment. There is a demand for biodegradable and renewable materials that decrease environmental effects without sacrificing required material properties. This resulted in the development of composites made of natural fibers. Natural fibers offer high specific strength and stiffness, relatively low density, low cost, and produce minimal pollution during processing and production, resulting in very few health concerns and hence a smaller carbon and ecological imprint (Barth and Carus Citation2015; Cherrett et al. Citation2005; Pickering, Aruan Efendy, and Le Citation2016). Natural fibers are used in a wide variety of industries, including furniture, automotive, aviation, construction, marine, and aircraft. Due to their superior and unique characteristics, researchers predict that natural fiber reinforced composites will see increased use in a variety of applications in the future (Kicińska-Jakubowska, Bogacz, and Zimniewska Citation2012; Ramamoorthy, Skrifvars, and Persson Citation2015).
Various researchers have investigated the physical, mechanical, hygrothermal, and acoustic properties of different natural fibers and their reinforced composites over the years (Ali et al. Citation2018; Mueller and Krobjilowski Citation2003; Srinivas, Lakshumu Naidu, and Raju Bahubalendruni Citation2017). Kumar and Srivastava (Citation2017) studied the mechanical properties of jute fiber reinforced epoxy composites. It was observed that with an increase in the number of fibers in a bundle, the bundle strength reduced. Naveen et al. (Citation2019) investigated the physical, mechanical, and hygrothermal properties of sisal fiber and its polymer composites. It was observed that sisal fiber exhibited a tensile modulus of 38 GPa. Rahman, Das, and Hasan (Citation2018) studied the mechanical properties of banana and pineapple leaf fiber reinforced hybrid polypropylene composites. It was observed that the composites with higher pineapple leaf fiber exhibited better mechanical properties. Aruchamy et al. (Citation2020) investigated the mechanical behavior of cotton/bamboo fabric reinforced epoxy composites. The tensile test of cotton and bamboo fabric were determined showing a yarn strength of 495 N and 512 N, respectively. It was observed that hybrid composites showed better properties than cotton fabric reinforced composites. Indra Reddy et al. (Citation2018) evaluated the mechanical properties of jute, pineapple leaf fiber and glass fiber reinforced epoxy and polyester hybrid composites. It was observed that polyester composites exhibited better mechanical properties compared to epoxy composites. Among natural fibers, hemp is one of the most durable and strongest, and its chemical composition makes it a best choice for use as a reinforcement in polymer composites (Mazzanti et al. Citation2019). Additionally, hemp fiber has a long fiber length, a high absorbency, and antimicrobial characteristics (Khan, Warner, and Wang Citation2014; Panaitescu et al. Citation2020). Hemp-hybrid materials can be easily created by combining hemp with other fibers. This hemp-hybrid approach preserves the strength of hemp fibers while providing the comfort of a soft and refined fiber (Ingrao et al. Citation2015; Pil et al. Citation2016; Shahzad Citation2012). Hemp fibers are employed in a variety of industries, from everyday items to military uses. Rope, cordage, rugs, towels, hats, canvas, apparel, home furnishing textiles, autos, insulation products, erosion control mats, boat hulls, yachts, surfboards, military uniforms antibacterial deodorizing function socks, and construction materials such as foam concretes and cement-based mortars are just a few of the applications (Crini et al. Citation2020; Gencel et al. Citation2021; Kaplan and Yavuz Bayraktar Citation2021; Osusky Citation2012; Pil et al. Citation2016).
Generally, the performance of FRP composites is significantly influenced by the fiber parameters like geometry/cross-section (Anurag and Biswas Citation2020; Devireddy and Biswas Citation2014), surface roughness (Ramasamy, Arumugam, and Suresh Kumar Citation2022), waviness (Piyatuchsananon, Ren, and Goda Citation2017), crystallinity (Prabowo, Nur Pratama, and Chalid Citation2017), moisture content (Moudood et al. Citation2019) and the most important, strength. Therefore, to understand the genuine contribution of any fiber to the composites, the properties of fiber should be studied before reinforcing them into the matrix to make composites. The characterization of the fiber is also necessary to know the elementary composition, crystallinity, surface texture, density, thermal stability, etc. Few researchers have studied the properties of hemp fiber and hemp-fiber-based composites. Shahzad (Citation2013) determined the physical and mechanical properties of hemp fibers. Circular and polygonal cross-sectional fibers were considered for the study. It was observed that the thermal decomposition of hemp fiber occurs at 150°C and the tensile modulus to be 9.5 ± 5.8 GPa. The structural properties of a composite material primarily depend on the properties of fiber reinforcement for a fiber reinforced composite. In contrast, for a fabric reinforced composite, performance of the composite depends on the properties of fiber reinforced as well as fabric strength. Fibers and their fabric contribute to the tensile strength, enhancing performance of composite, such as stiffness and strength. Therefore, the material properties and performance characteristics need to be known in order to use them in a composite. Although, a great deal of work has been done on the study of the performance of natural fiber reinforced polymer composites, however research on the characterization of natural fiber is limited. Characterization of natural fiber is very important before using it as reinforcement in polymer composites, as the properties of any natural fiber change with species. Generally, the properties of hemp fiber are affected by species, region, soil, temperature, rainfall, and harvest time (Adesina et al. Citation2020; Liu et al. Citation2015). There are over 2,000 hemp varieties in nature, according to the reports (Chen et al. Citation2021). The current study focuses on the characterization of Cannabis Sativa L. hemp fibers grown in India, so that based on the properties of hemp fiber under the present study, the desired application can be recommended. An investigation has been done on the physical and mechanical performance of industrial hemp fibers and their fabric (unidirectional and bidirectional) through systematic and improved methodologies.
Material and methods
Material
The hemp (Cannabis Sativa L.) used in the present work was obtained from a local trader in three different forms: raw fiber, unidirectional (UD) fabric, and plain weave bidirectional (BD) fabric. Both the UD and BD mats had a weight of 300 g/m2.
Fiber extraction
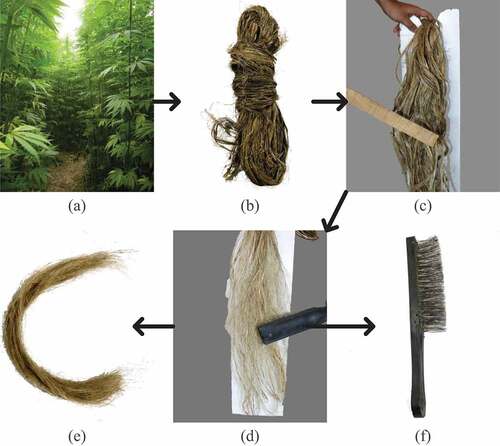
The process of hemp fiber extraction is shown in . The hemp plant is seen in (Barbetorte Citation2009). Hemp is harvested as raw fiber bundles containing contaminants such as woody stems, as seen in . Scutching was used to remove these contaminants from the hemp fiber. The hemp stalks were hammered with sticks during this procedure (), separating the woody stems from the fibers. Hemp fibers were dragged through heckling combs (), which divide the locked strands and create single, long, and clean fibers, as shown in . depicts the fibers generated after these two methods. They were placed in a 70°C oven to eliminate excess moisture from the fibers.
Figure 1. Hemp fiber extraction.
Physical property test
The density of hemp fiber was calculated according to two different standards, i.e., ASTM D3800 and ASTM D1577. The first method uses Archimedes’ principle, where the difference of material weights in air and liquid medium is used to determine the density. For the current study, acetone is used as the liquid medium instead of distilled water, as the density of acetone is less than the density of water and it was found that the fibers were semi submerged in the distilled water. The second method uses linear density approach to determine the density. Initially, the diameter of fiber was determined using an optical microscope (Leica, DM2500 M) and scanning electron microscope (SEM) (JEOL JSM-6480 LV). The fiber of fixed length was cut and their weight was found out with the help of a weighing machine. Substituting the obtained weight results in EquationEquation 1(1)
(1) , gives the density of fiber.
SEM and EDX spectroscopy
SEM was used to study the surface roughness, imperfections, and overall geometry. Energy Dispersive X-Ray (EDX or EDS) is a technique to determine the elemental composition of a material. It works on the principle of interaction of X-ray with a material. Hemp fiber was made into fine particles, which were used for both these studies. Prior to the test, the particles were coated with platinum through a process called sputtering. These analyses were carried out on JEOL JSM-6480 LV SEM with a resolution of 3 nm and magnification of 8×-300000× fitted with EDX detector of Oxford data reference system.
FTIR analysis
Fourier Transform Infrared (FTIR) spectroscopy helps in providing the knowledge about the absence or presence of specific functional groups and molecular fragments. It was used to examine the composition of hemp fiber which uses the standard KBr pellet technique and a spectrometer. FTIR measurements were carried out on Shimadzu IR Prestige-21 with a wavelength range of 400 cm−1 to 4700 cm−1. The sample was tested with a resolution of 2 cm−1. The fibers were made into small particles and then ground along with KBr powder. This mixture was then made into a pellet with the help of a manual press and die. FTIR can also be used to predict the crystallinity index (CI) of hemp fiber. It is found that variations in cellulose crystallinity can cause deviations in intensities of some IR spectra bands. The baseline corrected absorption peaks at 898 cm−1 to 1435 cm−1 correspond to the sensitive frequencies of amorphous and crystalline cellulose structures, respectively. Relative cellulose crystallinity can be measured using the intensities of both these peaks. CIFTIR is calculated using EquationEquation 2(2)
(2) (Fan, Dai, and Huang Citation2012).
Crystallinity with XRD
The crystallinity of hemp fiber was determined with the help of X-ray diffraction (XRD) technique. A Bruker AXS D8 Advance X-Ray diffractor, employing CoKα (λ = 1.78901) radiation. The diffraction intensity used was in the range of 5° to 79.5°of 2θ (Bragg angle) with a scanning speed of 5°/min. CIXRD was calculated using Segal empirical equation (Segal et al. Citation1959) represented in EquationEquation 3.(3)
(3)
where I002 is the maximum intensity of the 002 lattice diffraction plane at a 2θ angle between 22° and 23° which represents both amorphous and crystalline materials. The intensity of diffraction of amorphous materials in cellulosic fibers is represented by Iam which is taken at a 2θ angle between 18°and 19° where the intensity is at a minimum.
Peak deconvolution method was also used to determine the crystallinity index of the sample. In this method, the crystalline and amorphous peaks were separated from the diffraction curve using a curve-fitting process. Gaussian function was used to deconvolute the XRD curve. The ratio of area of all the crystalline peaks to the total area gives the crystallinity of the fiber.
Mechanical property test for fiber
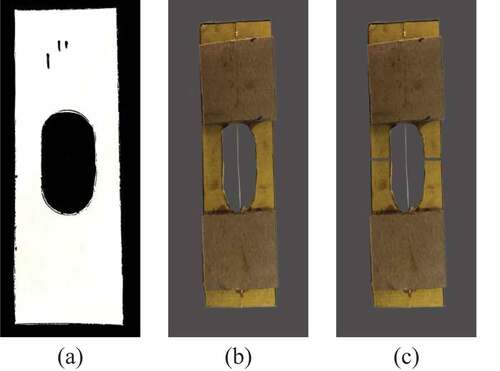
The tensile modulus of hemp fiber was determined in accordance with ASTM C1557–20. The single fiber used in testing was extracted randomly from the bundle with sufficient length to allow for convenient gripping and handling. For easy facilitation of gripping of fiber by the machine, a mounting tab was used as illustrated in . The fiber to be tested was placed in the middle of the mounting tab, and the end of the fiber was bonded to the mounting tab using an epoxy adhesive. Three different gage lengths were considered for testing, namely, 25.4 (illustrated in ), 50.8 and 76.2 mm. The fabricated sample was carefully placed inside the grippers of INSTRON 8862, which has a maximum load capacity of 100kN fitted with a Dynacell™ fatigue-rated load cell. After the sample was held tightly between the grippers, the middle-gage section of the mounting tab is cut away (as shown in , so that the fiber would bear the load. The load was given at a rate of 0.05 mm/min. A minimum of 3 samples for each gage length was tested.
Figure 2. (a) Mounting tab, (b) sample of gage length 1”, and (c) mounting tab after cutoff.
Mechanical property test for fabric
A fabric’s breaking strength is defined as the highest load it can withstand without tearing when subjected to uniaxial tensile loading. The breaking strength and elongation of the fabrics were determined by two distinct procedures, namely the grab test and the strip method, according to the method described in ASTM D5034–21 and ASTM D2035–11, respectively. For the grab test, a specimen of 150 mm long and 100 mm wide was cut from both fabrics, where fibers in the unidirectional fabric are aligned in the length direction parallel to the force application and testing direction. Test method G-E was used which denotes grab test carried out with a constant rate of extension. For strip test, a specimen of 150 mm long and 62 mm wide was cut from the fabrics. To achieve a testing width of 50 mm, equal number of yarns were raveled from each side. Test method 2 R-E was employed, which refers to 50 mm raveled strip test with a constant rate of extension. The sample was loaded into the machine such that the gauge length would be 75 mm. The loading rate was kept constant at 300 mm/min for both grab and strip test.
Thermal stability analysis
Differential scanning calorimetry (DSC) is an analytical technique to study the thermal stability and glass transition temperature (Tg) of a material. It calculates the heat flow rate difference between a sample and an inert reference as a function of temperature and time. DSC curves were obtained on a DSC 822E calorimeter (Mettler Toledo, US) in accordance with ASTM D3418. The fibers (~10 mg) were reduced to particles and placed inside an aluminum crucible. Dynamic scans were obtained within a nitrogen atmosphere at a heating rate of 10°C/min in the temperature range from 25°C to 250°C. For effective heat transfer and removal of volatiles, nitrogen was utilized.
Results and discussion
Physical properties
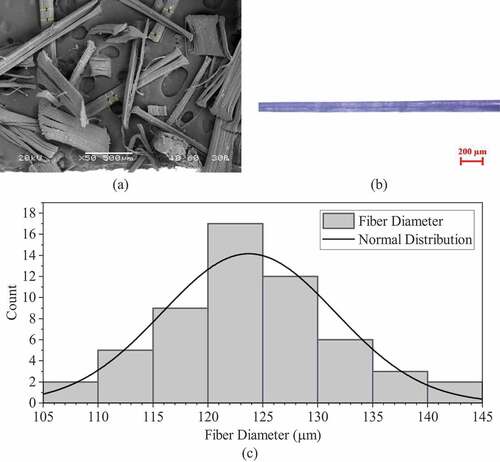
shows the SEM and optical microscope images of hemp fiber, respectively. Using both SEM and optical microscope images, the diameter of fibers was measured on multiple samples from 56 distinct locations. The diameter distribution and the fitted curve of normal distribution are shown in . The diameter of hemp fiber was observed to be around 106 µm to 142 µm, with an average diameter of 123.73 µm and a standard deviation of 7.82 µm. The average linear density of hemp fiber was found out to be 1.5545 × 10⁻⁵ kg/m. Substituting diameter and linear density in EquationEquation 1(1)
(1) , the average density of hemp fiber was found to be 1308.425 ± 168.387 kg/m3. The average density determined using Archimedes’ principle was found to be 1196.628 kg/m3.
Figure 3. (a) SEM image, (b) optical microscope image, and (c) diameter distribution of hemp fiber.
SEM and EDS study
The surface of hemp fiber observed under SEM was found to be rough and clean. Fiber bundles and fibrils were arranged in the axis of fiber. Micro-graphs of hemp fiber are represented in . EDS revealed the elemental analysis and composition of hemp fiber illustrated in and , respectively. Signals of C (carbon) and O (oxygen) indicate that the fiber is organic in nature. Ca (calcium) was also observed in the elemental analysis, which is essential for plant metabolism and various growth-related physiological processes. Traces of other elements like Al (aluminum), and Si (silicon), minute traces of Mg (magnesium), K (potassium), and Fe (iron) were observed that might have come from the soil.
Figure 4. (a) Micro-graphs image and (b) elemental analysis of hemp fiber.
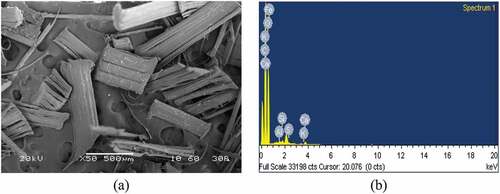
Table 1. Elemental composition of hemp fiber.
FTIR spectroscopy study
depicts the Fourier transform infrared spectra of hemp fiber. lists the major functional groups that correlate to a given wavelength, as well as the sources of those functional groups. The table shows that there are five major components in hemp fiber, which are cellulose, hemicellulose, lignin, pectin, and waxes, which can be separated into two categories. In the FTIR spectrum, a weak absorption was seen around 1527 cm−1 and 1246 cm−1, which corresponds to C=O and G ring stretching and C=C aromatic symmetrical stretching, respectively, indicating the presence of lignin. After extraction, the absorbance around 1527 cm−1 correlates to the presence of water, which is represented by the OH bending that suggests the presence of water. This absorbance is in the range of 1729 cm−1, which can be attributed to the presence of C=O (carbonyl) in the waxes and pectins studied. Changing the crystallinity of cellulose makes particular bands in the infrared spectrum more sensitive, which can be used to calculate the crystallinity index (CIFTIR) of cellulose. The absorbance peak ratios at 1435 cm−1 and 898 cm−1, 1381 cm−1 to 2920 cm1, 1381 cm−1 to 673 cm−1, and 1381 cm−1 to 2920 cm−1 are the most commonly utilized to determine CI (Fan, Dai, and Huang Citation2012). The ratios of 1381 cm−1 to 2920 cm−1 and 1381 cm−1 to 673 cm−1 are too low in this current work, making them inappropriate for evaluation, whereas the ratio of 1435 cm−1 to 898 cm−1 is 64.4%. As a result, the ratio of 1435 cm−1 to 898 cm−1 is better appropriate for CI evaluation, as indicated by a value of 64.4% obtained from EquationEquation 2.(2)
(2)
Figure 5. FTIR spectrum of hemp fiber.
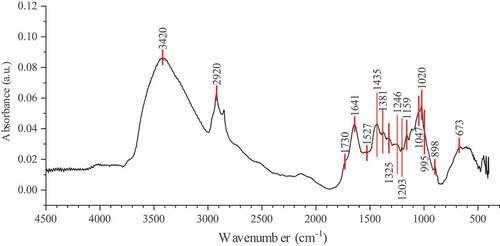
Table 2. Main functional groups observed in FTIR spectra of hemp fibers.
Crystallinity of fiber
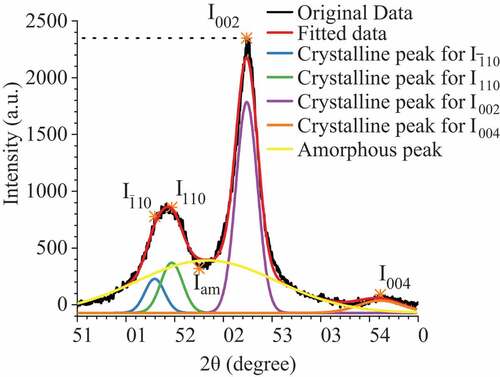
XRD photograph of hemp fiber is shown in . The major crystalline peak observed at 2θ = 22.4° with an intensity of around 2700 in the x-ray diffractogram of hemp fiber corresponds to the cellulose crystallographic plane (002, Bragg reflection). At 2θ = 18.3°, a trough was observed between 002 and 110 peaks which corresponds to amorphous intensity (Iam). The CIXRD of hemp fiber is 85.25% which was calculated from EquationEquation 3.(3)
(3) High CI indicates better mechanical properties of hemp fiber. Other crystallographic planes observed in the diffractogram, namely (
), (110), and (004) are obtained at well-defined peaks at 2θ = 12.95°, 2θ = 14.7° and 2θ = 36.1°. The deconvoluted crystalline and amorphous peaks can be seen in . The deconvolution resulted in a curve that fit the original data with an R-square value of 0.992. The total area and area of all the crystalline peaks were determined, which produced a crystallinity of 49.37%. The huge difference in the crystallinity obtained by Segal’s empirical and deconvolution methods can be attributed to the broad peaks of amorphous cellulose. These broad peaks lead to overlapping peaks which cannot be deconvoluted into narrow diffraction peaks leading to lower crystallinity values (Park et al. Citation2010).
Figure 6. X-ray diffractogram of hemp fiber.
It was observed that there is a difference in the CI of hemp fiber measured through XRD and FTIR. The difference in cellulose crystallinity results can have many reasons. Even though the FTIR spectrum contains peaks corresponding to amorphous and crystalline regions, it is the most apt method for determining the crystallinity of natural fibers. There are several drawbacks which cannot be eliminated in the determination of crystallinity using XRD diffractogram in the case of natural fibers. Peak overlapping is destined to occur around 2θ = 18° for monoclinic cellulose due to the smaller size of cellulose crystallites, which gives lower or higher values of Iam. Cellulose obtained from different species has different crystalline sizes and apparent cell parameters, which influence the crystalline peak I002, thereby affecting the relative intensities of peaks. Based on the factors and results obtained, for natural lignocellulosic fiber, the FTIR method is more suitable for CI evaluation.
Mechanical properties of fiber
The stress-strain graph of hemp fibers of various gage lengths are illustrated in . It can be observed that the stress-strain graph of hemp fibers is linear in nature. It can be seen that there is a sudden decrease in the strain value, indicating the brittle nature of hemp fiber. The obtained tensile modulus, strength, and maximum strain values are reported in . It was observed that the average strain for the hemp fiber is 1.08% with a standard deviation of 0.31%. It can also be seen that the tensile strength of hemp fiber varies from 302 to 941 MPa with an average value of 640 MPa and a standard deviation of 205 MPa. The tensile modulus of hemp fiber was found to be varying from 46.726 GPa to 77.397 GPa, with a mean value of 59.053 GPa and a standard deviation of 8.448 GPa. The tests were conducted under the assumption that the diameter of each fiber was equal to the average diameter. This led to a higher standard deviation in the results. Therefore, it can be concluded that the hemp fiber reinforced composites will have high mechanical strength, which is comparable to glass fiber reinforced composites (Chokshi et al. Citation2022).
Figure 7. Stress vs. strain graph.
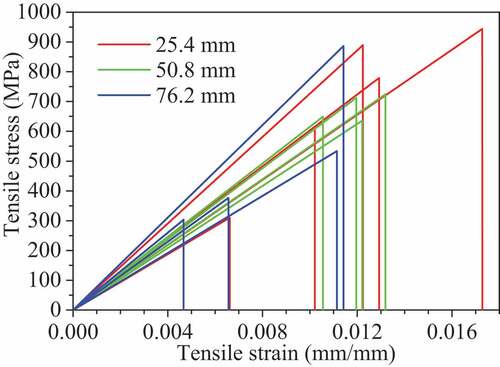
Table 3. Mechanical properties of hemp fiber.
Breaking strength of fabric
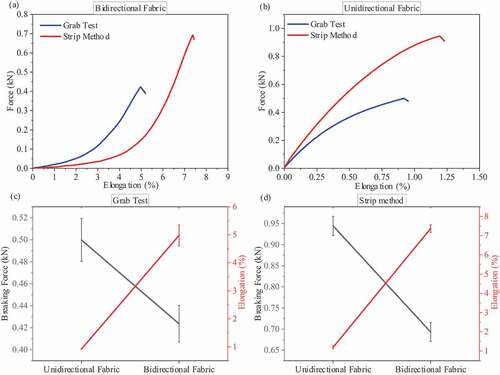
depicts the force vs. elongation curves for BD and UD fabric, respectively. In both cases, the strip method demonstrated more elongation before ripping but with a higher breaking force than the grab test. For a given force, the strip method produced more elongation in the case of BD fabric than the grab test. In the case of UD fabric, the grab test produced greater elongation than the strip method. The breaking force and apparent elongation at the breaking force of both fabrics for the grab test and strip method are shown in , respectively. The figures show that UD fabric needed more breaking force than BD fabric, whereas elongation at breaking force was greater for BD fabric than UD fabric. These fabrics have a breaking force comparable to glass fabric.
Figure 8. (a) Force vs. elongation curve of bidirectional fabric and (b) unidirectional fabric. (c) Breaking force and elongation (grab test) and (d) breaking force and elongation (strip method).
Differential scanning calorimetry analysis
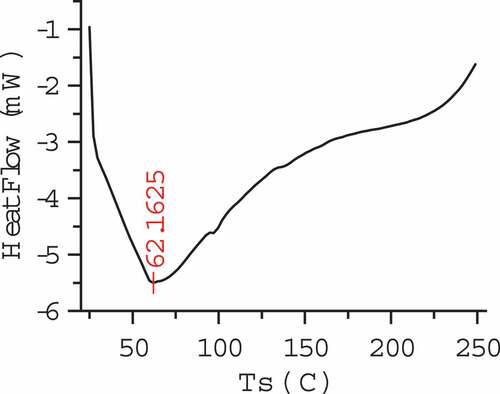
DSC analysis was used to investigate the thermal behavior of hemp fiber. The obtained DSC curve of hemp fiber is presented in . In the temperature range of 50–100°C, the DSC curve displayed an endothermic peak. The evaporation of free water in the intercellular region of the fiber may have caused this endothermic region where heat was absorbed. Typically, linked water attached to cellulose in fiber was difficult to remove than free water. To remove linked water, higher temperatures are required which can be observed as a kink in the curve at approximately 100°C. The trough of the peak, which was observed at 62.16°C, can be the starting point where the material starts to degrade. This trough represents Tg, where the phase transition of the fiber from a glassy/crystalline state to a leathery state takes place.
Figure 9. DSC curve of hemp fiber.
Conclusion
Extraction of fiber from raw fiber bundles was done by using methods like scutching and heckling. The physical and mechanical properties of the hemp fiber and fabric were studied. The diameter distribution profile was found to follow normal distribution with an average of 123.73 ± 7.82 µm. The density of hemp fibers was found to be 1196.628 kg/m3 according to Archimedes’ principle. The surface was found to be rough from SEM analysis. EDS showed the presence of C and O, indicating fiber as an organic material. FTIR showed the presence of lignin, cellulose, hemicellulose, pectin, and waxes in hemp fiber. CIFTIR was found to be 64.4%, whereas CIXRD was found to be 85.25% and 49.37% when calculated according to Segal and deconvolution method, respectively. The stress-strain graph of hemp fiber indicates the higher tensile modulus of 58.6 ± 8.81 GPa and high breaking strength of fabrics, which is comparable to synthetic glass fiber. The mean strain was found to be around 1%. High CI, comparable tensile modulus to glass fiber and high maximum strain rate make the hemp fiber and its fabric a potential reinforcement for polymer composites.
Highlights
Physical and mechanical properties of elementary hemp fiber and fabric are determined using improved and systematic methods
Tensile strength and tensile modulus are determined using an improved method following ASTM C1557-20
Density of hemp fiber is less and tensile modulus similar to glass fiber
Breaking strength of hemp fabric comparable to synthetic fabrics
High crystallinity of hemp makes it a potential reinforcement for polymer composites
Disclosure statement
No potential conflict of interest was reported by the authors.
References
- Adesina, I., A. Bhowmik, H. Sharma, and A. Shahbazi. 2020. A review on the current state of knowledge of growing conditions, agronomic soil health practices and utilities of hemp in the United States. Agriculture 10 (4). doi:10.3390/agriculture10040129.
- Ali, A., K. Shaker, Y. Nawab, M. Jabbar, T. Hussain, J. Militky, and V. Baheti. 2018. Hydrophobic treatment of natural fibers and their composites—A review. Journal of Industrial Textiles 47 (8):2153–14. doi:10.1177/1528083716654468.
- Anurag, J., and S. Biswas. 2020. Thermo-Mechanical Analysis of unidirectional PALF composites using micromechanical approach. In Advances in Applied Mechanical Engineering, ed. H. K. Voruganti, K. K. Kumar, P. V. Krishna, and X. Jin, 475–84. Springer Singapore. doi:10.1007/978-981-15-1201-8_53.
- Aruchamy, K., S. Pavayee Subramani, S. Kumar Palaniappan, B. Sethuraman, and G. Velu Kaliyannan. 2020. Study on mechanical characteristics of woven cotton/bamboo hybrid reinforced composite laminates. Journal of Materials Research and Technology 9 (1):718–26. doi:10.1016/j.jmrt.2019.11.013.
- Barbetorte. 2009. A hemp field in Cˆotes-´darmor, Brittany, France. https://en.wikipedia.org/wiki/Hemp#/media/File:La_Roche_Jagu_chanvre_1.JPG. Accessed 16 May 2021
- Barth, M., and M. Carus. 2015. Carbon footprint and sustainability of different natural fibres for biocomposites and insulation material. Hürth: Nova-Institute. http://eiha.org/media/2017/01/15-04-Carbon-Footprint-of-Natural-Fibres-nova1.pdf.
- Chen, X., H. Deng, J. A. Heise, D. P. Puthoff, N. Bou-Abboud, H. Yu, and J. Peng. 2021. Contents of cannabinoids in hemp varieties grown in Maryland. ACS Omega 6 (47):32186–97. doi:10.1021/acsomega.1c04992.
- Cherrett, N., J. Barrett, A. Clemett, M. Chadwick, and M. J. Chadwick. 2005. Ecological footprint and water analysis of cotton, hemp and polyester. Sweden: Stockholm Environmental Institute. https://www.sei.org/publications/ecological-footprint-water-analysis-cotton-hemp-polyester/
- Chokshi, S., V. Parmar, P. Gohil, and V. Chaudhary. 2022. Chemical composition and mechanical properties of natural fibers. Journal of Natural Fibers 19 (10):1–12. Taylor & Francis. doi:10.1080/15440478.2020.1848738.
- Crini, G., E. Lichtfouse, G. Chanet, and N. Morin-Crini. 2020. Traditional and new applications of Hemp. In Sustainable Agriculture Reviews 42: Hemp Production and Applications, ed. G. Crini and E. Lichtfouse, 37–87. Cham: Springer International Publishing. doi:10.1007/978-3-030-41384-2_2.
- Devireddy, S. B. R., and S. Biswas. 2014. Effect of fiber geometry and representative volume element on elastic and thermal properties of unidirectional fiber-reinforced composites. In Journal of Composites, ed. Y. Yang, Hindawi Publishing Corporation. 2014. doi:10.1155/2014/629175.
- Fan, M., D. Dai, and B. Huang. 2012. Fourier transform infrared spectroscopy for natural fibres. In Fourier Transform, S. M. Salih. ed., Rijeka: IntechOpen. doi:10.5772/35482.
- Gencel, O., O. Yavuz Bayraktar, G. Kaplan, A. Benli, G. Martínez-Barrera, W. Brostow, M. Tek, and B. Bodur. 2021. Characteristics of hemp fibre reinforced foam concretes with fly ash and taguchi optimization. Construction and Building Materials 294:123607. doi:10.1016/j.conbuildmat.2021.123607.
- Indra Reddy, M., U. R. Prasad Varma, I. Ajit Kumar, V. Manikanth, and P. V. Kumar Raju. 2018. Comparative evaluation on mechanical properties of jute, pineapple leaf fiber and glass fiber reinforced composites with polyester and epoxy resin matrices. Materials Today: Proceedings 5 (2, Part 1):5649–54. doi:10.1016/j.matpr.2017.12.158.
- Ingrao, C., A. Lo Giudice, J. Bacenetti, C. Tricase, G. Dotelli, M. Fiala, V. Siracusa, and C. Mbohwa. 2015. Energy and environmental assessment of industrial hemp for building applications: A review. Renewable and Sustainable Energy Reviews 51:29–42. doi:10.1016/j.rser.2015.06.002.
- Kaplan, G., and O. Yavuz Bayraktar. 2021. The effect of hemp fiber usage on the mechanical and physical properties of cement based mortars. Research on Engineering Structures and Materials 7:245–58. doi:10.17515/resm2020.242ma1222.
- Khan, B. A., P. Warner, and H. Wang. 2014. Antibacterial properties of hemp and other natural fibre plants: A review. BioResources 9 (2):3642–59. doi:10.15376/biores.9.2.Khan.
- Kicińska-Jakubowska, A., E. Bogacz, and M. Zimniewska. 2012. Review of natural fibers. Part I—Vegetable fibers. Journal of Natural Fibers 9 (3):150–67. Taylor & Francis. doi:10.1080/15440478.2012.703370.
- Kumar, A., and A. Srivastava. 2017. Preparation and mechanical properties of jute fiber reinforced epoxy composites. Industrial Engineering & Management 6 (234):316–2169. doi:10.4172/2169-0316.1000234.
- Liu, M., D. Fernando, G. Daniel, B. Madsen, A. S. Meyer, M. Tutor Ale, and A. Thygesen. 2015. Effect of harvest time and field retting duration on the chemical composition, morphology and mechanical properties of hemp fibers. Industrial Crops and Products 69:29–39. doi:10.1016/j.indcrop.2015.02.010.
- Mazzanti, V., R. Pariante, A. Bonanno, O. R. de Ballesteros, F. Mollica, and G. Filippone. 2019. Reinforcing mechanisms of natural fibers in green composites: Role of fibers morphology in a PLA/Hemp model system. Composites Science and Technology 180:51–59. doi:10.1016/j.compscitech.2019.05.015.
- Moudood, A., W. Hall, A. Öchsner, H. Li, A. Rahman, and G. Francucci. 2019. Effect of moisture in flax fibres on the quality of their composites. Journal of Natural Fibers 16 (2):209–24. Taylor & Francis. doi:10.1080/15440478.2017.1414651.
- Mueller, D. H., and A. Krobjilowski. 2003. New discovery in the properties of composites reinforced with natural fibers. Journal of Industrial Textiles 33 (2):111–30. doi:10.1177/152808303039248.
- Naveen, J., M. Jawaid, P. Amuthakkannan, and M. Chandrasekar. 2019. 21 - Mechanical and Physical properties of sisal and hybrid sisal fiber-reinforced polymer composites. In Mechanical and Physical Testing of Biocomposites, Fibre-Reinforced Composites and Hybrid Composites, ed. M. Jawaid, M. Thariq, and N. Saba, 427–40. Woodhead Publishing Series in Composites Science and Engineering. Woodhead Publishing. doi:10.1016/B978-0-08-102292-4.00021-7.
- Osusky, G. 2012. Feasibility and Manufacturing Considerations of Hemp Textile Fabric Utilized in Pre-Impregnated Composites. PhD diss., Arizona State University.
- Panaitescu, D. M., R. Claudiu Fierascu, A. Raluca Gabor, and C. Andi Nicolae. 2020. Effect of hemp fiber length on the mechanical and thermal properties of Polypropylene/SEBS/Hemp fiber composites. Journal of Materials Research and Technology 9 (5):10768–81. doi:10.1016/j.jmrt.2020.07.084.
- Park, S., J. O. Baker, M. E. Himmel, P. A. Parilla, and D. K. Johnson. 2010. Cellulose crystallinity index: Measurement techniques and their impact on interpreting cellulase performance. Biotechnology for Biofuels 3 (1):10. doi:10.1186/1754-6834-3-10.
- Pickering, K. L., M. G. Aruan Efendy, and T. M. Le. 2016. A review of recent developments in natural fibre composites and their mechanical performance. Composites Part A, Applied Science and Manufacturing 83:98–112. doi:10.1016/j.compositesa.2015.08.038.
- Pil, L., F. Bensadoun, J. Pariset, and I. Verpoest. 2016. Why are designers fascinated by flax and hemp fibre composites? Composites Part A, Applied Science and Manufacturing 83:193–205. doi:10.1016/j.compositesa.2015.11.004.
- Piyatuchsananon, T., B. Ren, and K. Goda. 2017. Effect of fiber waviness on tensile properties of sliver-based natural fiber composites. In Natural and Artificial Fiber-Reinforced Composites as Renewable Sources, E. Günay. ed., Rijeka: IntechOpen. doi:10.5772/intechopen.70905.
- Prabowo, I., J. Nur Pratama, and M. Chalid. 2017. The effect of modified ijuk fibers to crystallinity of polypropylene composite. IOP Conference Series: Materials Science and Engineering 223 (July). IOP Publishing: 12020. doi:10.1088/1757-899x/223/1/012020.
- Rahman, M., S. Das, and M. Hasan. 2018. Mechanical properties of chemically treated banana and pineapple leaf fiber reinforced hybrid polypropylene composites. Advances in Materials and Processing Technologies 4 (4):527–37. Taylor & Francis. doi:10.1080/2374068X.2018.1468972.
- Ramamoorthy, S. K., M. Skrifvars, and A. Persson. 2015. a review of natural fibers used in biocomposites: Plant, Animal and Regenerated cellulose fibers. Polymer Reviews 55 (1):107–62. Taylor & Francis. doi:10.1080/15583724.2014.971124.
- Ramasamy, N., V. Arumugam, and C. Suresh Kumar. 2022. Effect of fiber surface modifications on the interfacial adhesion in kevlar fiber reinforced polymer composites. Journal of Adhesion Science and Technology 36 (1):54–74. Taylor & Francis. doi:10.1080/01694243.2021.1911205.
- Segal, L., J. J. Creely, A. E. M. Jr, and C. M. Conrad. 1959. An empirical method for estimating the degree of crystallinity of native cellulose using the X-ray diffractometer. Textile Research Journal 29 (10):786–94. doi:10.1177/004051755902901003.
- Shahzad, A. 2012. Hemp fiber and its composites – A review. Journal of Composite Materials 46 (8):973–86. doi:10.1177/0021998311413623.
- Shahzad, A. 2013. A Study in physical and mechanical properties of Hemp fibres. In Advances in Materials Science and Engineering, ed., S. Komarneni. Hindawi Publishing Corporation. 2013. doi:10.1155/2013/325085.
- Srinivas, K., A. Lakshumu Naidu, and M. V. A. Raju Bahubalendruni. 2017. A review on chemical and mechanical properties of natural fiber reinforced polymer composites. International Journal of Performability Engineering 13 (2). Int J Performability Eng: 189. doi:10.23940/ijpe.17.02.p8.189200.
- Stevulova, N., J. Cigasova, A. Estokova, E. Terpakova, A. Geffert, F. Kacik, E. Singovszka, and M. Holub. 2014. Properties characterization of chemically modified Hemp Hurds. Materials 7 (12):8131–50. doi:10.3390/ma7128131.