
 ?Mathematical formulae have been encoded as MathML and are displayed in this HTML version using MathJax in order to improve their display. Uncheck the box to turn MathJax off. This feature requires Javascript. Click on a formula to zoom.
ABSTRACT
Plants number is an essential field phenotypic trait that affects the growth status and final quality of crop. In recent years, the integration of remote sensing technology and deep learning technology has provided a solution to the problem of crop plant counting in field. However, most of the previous studies have selected fixed crops (such as rice, wheat) for research, and few studies have reported the limitations in the application of this technology. In addition, as far as we know, there has been no report on the problem of ramie germplasm resources counting. In this study, in combination with DA (Data Augmentation) and three object detection algorithms, ramie germplasm resources were adopted to explore the accuracy of counting plant number under the condition of dense plant growth. The following functions were tested: (1) the influence of DA on the effect of plant counting; (2) the influence of ground sampling distance (GSD) on the effect of plant counting; (3) the influence of object detection algorithms on ramie detection object. The results showed that after the training sample was expanded by DA, the Precision of ramie plant counting model was increased by 6.630%. FCOS (Fully Convolutional One-Stage Object Detection) could perform better in small object and small sample data (Recall = 0.892, Precision = 0.819,RMSE = 0.089). It was necessary to ensure the consistency of GSD between training samples and verification samples for improving the accuracy of ramie plants counting. The ramie plant counting model has sufficient and stable ability to count ramie plants in the field, which can supplement the traditional manual counting method.
摘 要
植株数量是影响作物生长状况和最终品质的重要田间表型性状. 近年来,遥感技术和深度学习技术的结合为作物田间计数问题提供了解决方案. 然而,之前的大多数研究都选择了固定作物(如水稻、小麦)进行研究,很少有研究报告了该技术应用的局限性. 此外,据我们所知,尚未有关于苎麻种质资源计数问题的报道. 在本研究中,结合DA(Data Augmentation,数据增强)和三种目标检测算法,采用苎麻种质资源来探索在密集植物生长条件下计算植物数量的准确性. 测试了以下功能:(1) DA对植物计数效果的影响;(2) 地面采样距离(GSD)对植物计数效果的影响;(3) 目标检测算法对苎麻检测目标的影响. 结果表明,DA扩展训练样本后,苎麻植株计数模型的精度提高了6.630%. FCOS(全卷积一级对象检测)在小对象和小样本数据中表现更好(召回 = 0.892,精度 = 0.819,RMSE = 0.089). 为了提高苎麻植株计数的准确性,有必要确保训练样本和验证样本之间GSD的一致性. 苎麻植株计数模型具有足够且稳定的田间苎麻植株计数能力,可以补充传统的人工计数方法.
Introduction
Ramie is one of the important characteristic crops in China, which has abundant value in the fields of economy (Xiong et al. Citation1998), ecology (She, Jie, and Xing et al. Citation2011), medicine (Tian et al. Citation2015) and culture (Cui et al. Citation2021). Plant number is one of the essential phenotypic traits of ramie, which can not only help producers to make correct management decisions by reflecting field density information and growth status (Wrather, Phipps, and Stevens et al. Citation2008), but also effectively evaluate and predict the final yield of ramie (Hu and Peng Citation1998), so as to assist breeders to quickly screen ramie varieties with high yield potential. Ramie plant counting by human visual detection is time-consuming, laborious and destructive. To solve this problem, many scholars have investigated the potential of plant counting using machine learning technology with images obtained from different crop phenotype platform (Fernandez et al. Citation2018; Madec et al. Citation2019). In these studies, ground fixed or mobile platforms can collect high-resolution and high-quality images, but were also inevitably limited by coverage area, topographic relief and other factors (Bronick and Lal Citation2005).
The development of unmanned aerial vehicle (UAV) remote sensing technology provides a new way to obtain crop information in a large area. UAV has the advantages of high efficiency, nondestructive, easy operation, and can carry multiple low-cost portable sensors to obtain high-definition crop canopy images (Jiang et al. Citation2022; Sun et al. Citation2022), so as to detect plant number. For example, He, Hao, and Xin (Citation2020) improved wheat ear detection accuracy using the modified You Only Look Once v4 algorithm (YOLOv4) based on UAV remote sensing images, and the f1 score reached 96.71%. Velumani et al. (Citation2021) used Faster Region-based Convolutional Neural Network (Faster-RCNN) to detect maize at the third-to-fifth leaf stage based on high-resolution remote sensing images, with the rRMSE reaching 0.10.
Current studies on plant counting using UAV remote sensing images have been focused on few crops, such as rice (Sun et al. Citation2022), wheat (Zhu et al. Citation2022), cotton (Feng et al. Citation2020), etc., and crop varieties are relatively simple. The difference of image features among crops and crop varieties, and of different object detection network structure, will result in different detection effect. When conducting plant counting studies of a new crop, it is still a challenge to extract characteristic traits from original image data to develop efficient and stable models (David et al. 2020), because the performance of the model largely depends on the number and diversity of training sample (Alom et al. 2019; Ghosal et al. 2019), which needs to consider the variability of collection times, observation conditions, genotype differences and other aspects (Consuelo et al. 2021). Therefore, the limitations of plant counting based on UAV remote sensing technology will be discussed in this study.
A key question in this study is whether there are limitations in the sample number, sample diversity, image resolution and model algorithm when using UAV remote sensing images and Deep Learning Technology (DL) to construct plant counting model, and whether detection for dense crop object can be achieved with fewer marks by using Data Argumentation (DA) and DL. The objectives include: (1) evaluating the contribution of DA to ramie plant counting models; (2) evaluating the accuracy of ramie counting models with different algorithms and ground sampling distance (GSDs); (3) verifying the performance of this model in multi-genotype ramie.
Materials and methods
Study sites
This study was conducted in Changsha, Hunan (28°11 ′01.981″ N, 113°04′ 10.159″ E) from 2019 to 2020. The area consisted of two experiments (). With abundant precipitation, sufficient light and heat conditions, the study site is one of the main ramie production areas. Meanwhile, the flat terrain provides favorable conditions for UAV-based remote sensing monitoring of ramie.
Figure 1. Location and distribution map of experimental area.
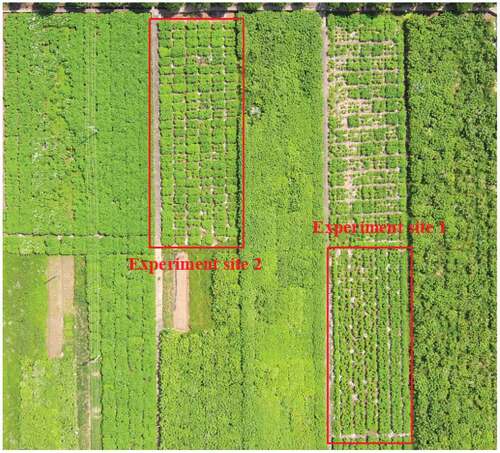
Experiment site 1: The area contains two different varieties of ramie, with each variety grown in 12 plots (a total of 24 plots). Each plot area was about 12 m2, with 4 rows × 8 columns. The planting density was 92,500 plants per hectare, and the row spacing was 0.2 m.
Experiment site 2: The area used for germplasm-resource experiment consisted of 154 plots, with each plot area of 2 m × 1.8 m, 2 lines × 4 stumps. The stump spacing was 0.4 m, the row spacing was 0.6 m, and the gutter width was 0.5 m. There was no repeated plot in the experimental area, namely one variety of ramie was planted in one experimental plot. There were 154 germplasm resources in total, and the materials had diversity in morphological characteristics and agricultural traits.
In order to complete the reconstruction of the model later and improve the accuracy of longitude, latitude and elevation position, multiple ground control points (GCPs) were uniformly arranged in space and height in the test site.
Experimental plan
Experiment 1: This experiment was designed to investigate whether there were limitations with respect to sample number during counting plant number based on UAV images and DL, and to evaluate the effect of DA on improving the accuracy of plant counting model constructed by small samples. Remote sensing images of ramie canopy at site 1 were collected by UAV during ramie maturity period (May 21, 2020). Forty-nine images were captured and divided into training samples and validation samples in a ratio of 1:4. DA was used to expand the training samples, which were used to establish ramie plant counting model.
Experiment 2: This experiment was used to evaluate the effects of GSD and object detection algorithm on the ramie counting accuracy. During the ramie maturity period in the year of 2019 and 2020, UAV was used to collect ramie canopy images in site 2. The images were divided into three datasets: (1) V1 contained images from 2020 and was mainly used to compare the detection effects of different algorithms. (2) V2 included images from 2019 to 2020, which was used to evaluate the performance of ramie plant counting model in different years. (3) V3 included native high-resolution images acquired in 2020 and images with lower resolution transformed by Down-sampling method. V3 was used to evaluate the impact of different GSDs on the accuracy of ramie counting model ().
Table 1. Dataset used in experience 2.
Data acquisition
Data collection was completed by Inspire 2 UAV platform (Shenzhen, China) with a high-resolution RGB camera. The UAV was flying at about 1.1 m/s speed at an altitude of 15 m. The camera moved above the crop vertically to maximize crop canopy information. The exposure mode of the camera was automatically selected. The exposure was 1/200s, ISO sensitivity was 100, and aperture was 1.53. Field images were acquired at the local time of 12:00–14:00 under clear and sunny weather conditions, which could ensure the quality of images.
Methods for ramie plant counting
The research steps are shown in . LabelImg was used to label individual plants. Then, DA was used to expand the training samples, and Down-sampling was used to change the GSD of images. Finally, the object detection algorithm was used to construct ramie plant counting model.
Figure 2. The research steps.
Manual labeling of individual plants
The individual plants were labeled with an offline tool, LabelImg. Bounding boxes around each ramie plant were interactively drawn and saved in the Pascal VOC format as TXT files. The file contains the position information of each labeled plant, and the actual plant number.
Data augmentation
Mosaic, a new DA approach was employed to perform data transformation of the sample database in advance. Through this DA method, four images were integrated by random scaling, random clipping and random arrangement.
Methods for image down-sampling
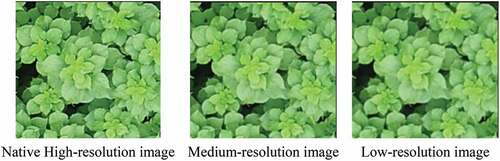
To create the synthetic lower resolution datasets, Gaussian filter were applied to downsample the native high-resolution datasets (). Gaussian filter process can provide low-resolution images similar to the native low-resolution UAV images. In this study, a Gaussian filter with a sigma = 0.6 was used to create Medium-resolution images, and a Gaussian filter with a sigma = 0.8 were used to create Low-resolution images.
Figure 3. The Ramie Canopy image before and after down-sampling.
Training environment of object detection model
The machine adopted in this study was ThinkPad P15 GEN1 (CPU, Xeon W-10885 M with 8-core and 16-thread; GPU, Nvidia RTX5000, with 16 G video memory and 64 G running memory). During the application of YOLOv5, CSPDarknet was used as backbone, and YOLOv5s as pre-training weight. SGD was used to optimize function. During the application of Faster-RCNN, Resnet101 was used as backbone and FPN was used to optimize function. During the application of FCOS, Resnet101 was used as backbone, and FPN was used to optimize function. All models were trained 20 times.
Evaluation metrics
If the detected bounding box contains complete individual plants, it can be considered as true positive (TP). Otherwise, the detected bounding box is considered as false positive (FP). This result would be considered false negative (FN) when the detected bounding box contains incomplete plants. Based on that, the Precision and Recall calculation can be performed. The specific formulas can be expressed as follows.
Precision = TP/(FP+TP)
Recall = TP/(FN+TP)
Root mean square error (RMSE) and Coefficient of determination (R2) were employed to quantify the performance of ramie plant counting.
Where, n represents the number of test images, Ri represents the reference counts for images, Di represents the detected counts for images, and¯Ri represents the mean reference count.
Result
Data augmentation provides better model performance
In Experiment 1, the focus was placed on the effect of DA on the plants counting accuracy of ramie. It can be found that the performance of ramie plant counting model was optimized to a certain extent after the training samples expanding with DA. The number of original training samples was 214, which was increased to 1522 after DA.
presents the effect of DA on the counting accuracy of verified samples. After the application of DA, the Precision of this model increased by 6.630% from 0.920 before DA to 0.981 after DA. After DA, the Recall of this model decreased by 0.514% from 0.972 to 0.967. The R2 of the regression model based on actual and predicted plant numbers was low before the application of DA, which was 0.03. After DA, R2 was 0.728. The result indicated that DA was an effective method to deal with insufficient data in object detection task. The accuracy of object detection can also be improved by training the expanded samples.
Table 2. The impact of data augmentation on plant counting accuracy.
FCOS is more suitable for small object detection
In Experiment 2, dataset V1 was divided into training samples and validation samples according to the ratio of 4:1, and then three object detection algorithms were respectively used to investigate the effect of object detection algorithm on the plants counting accuracy of ramie (). The results show that three models can detect ramie plants accurately, with the Recall of 0.892 ~ 0.897, the Precision of 0.796 ~ 0.819, and the RMSE of 0.089 ~ 0.127. FCOS had better detection performance, with the Precision being 0.819, the Recall 0.892 and RMSE 0.089.
Table 3. The impact of object detection algorithm on plant counting accuracy.
shows the classification results of validation samples based on confusion matrix. The actual number of ramie plants was 1409. During the application of Faster-RCNN, the number of correctly detected ramie plants was 1264, the number of incorrectly detected ramie plants was 324 and 145 were not detected. During the application of FCOS, the number of detected ramie plants was 1257, the number of incorrectly detected plants was 278, and 152 were not detected. During the application of YOLOv5, the number of correctly detected ramie plants was 1261, the number of incorrectly detected ramie plants was 315 and 148 were not detected. It can be seen that Faster-RCNN and YOLOv5 incorrectly detected more object than FCOS and had higher RMSE, which indicates that they were more likely to detect plant with multiple boxes. Therefore, FCOS was superior to Faster-RCNN and YOLOv5 with respect to the task of ramie plant number detection. FCOS is more suitable for the identification of small object crops in complex situations, especially when there are overlapped and crowded objects.
Figure 4. Classification results of validation sample based on confusion matrix.
Analysis of model generalization ability
In Experiment 2, in order to evaluate the applicability of ramie plant counting model, V1 was used as training sample, and V2 was used as validation sample. shows that ramie plant counting model has good generalization ability and robustness. When data from different years were used, the Recall was 0.963, the Precision was 0.805, the RMSE was only 0.196, and 1582 plants were correctly detected. This result indicates that ramie plant counting in the field based on UAV remote sensing and deep learning is feasible and has practical value in plant detection of different varieties and different years.
Table 4. Generalization ability of ramie plant counting model.
The effect of GSD on ramie plant counting
analyzed the effect of GSD on the plants counting accuracy of ramie. As can be seen from this table, the ramie plant counting model based on FCOS was very sensitive to GSD. When the model was trained and applied on the high-resolution images, the Recall, and the Precision were 0.892 and 0.819, respectively. When the model was trained on high-resolution images and applied to medium-resolution images, the Recall and the Precision of the model were 0.890 and 0.822, respectively, which had no significant difference from the results of training and application on high-resolution images. When the model was trained on the medium-resolution images and applied to the high-resolution images, the performance of ramie plant counting model was significantly lower than that of trained and applied on the high-resolution images, with the Recall and the Precision reduced by 1.7% and 0.7%, respectively. When the model was trained on low-resolution images and applied to low-resolution images, the performance of ramie plant counting model was improved compared with the results of training and application on high-resolution image, the Recall and the Precision were increased by 0.3% and 0.1%, respectively. This indicates that ramie plant counting model was sensitive to GSD, and it is necessary to maintain the consistency of GSD between training samples and validation samples, because FCOS model tends to detect objects of similar size to training samples.
Table 5. The impact of gsd on plant counting accuracy.
In addition, it is found that higher image resolution does not mean more accurate ramie plant counting. When trained and applied on medium-resolution images, the model had better detection effect (Recall = 0.894, Precision = 0.822, RMSE = 0.088), indicating that lower resolution images contained enough information to accurately detect ramie plants, and the relatively lower resolution made the information concerned by the model more effective. shows the classification results of validation samples with different GSDs. It can be seen from the figure that the actual number of ramie plants was 1409. When the model was trained and applied on the medium-resolution image, 1260 ramie plants were correctly detected, 273 were incorrectly detected, and 149 were not detected. The results of incorrectly detection were 5 and 4 fewer than those of high-resolution image and the low-resolution image. The results demonstrated that the GSD could exert an impact on the final evaluation effect (R2, RMSE).
Figure 5. Classification results of validation sample with different GSDs based on confusion matrix.
Where, Tn represents the training samples is native high-resolution images, T0.6 represents the training samples is medium-resolution images, T0.8 represents the training samples is low-resolution images, Vn represents the validation samples is native high-resolution images, V0.6 represents the validation samples is medium-resolution, V0.8 represents the validation samples is low-resolution images.
Discussion
Limitations of crop counting
Under the condition of small samples, the proposed method with DA to expand the dataset is effective. By training samples converted with DA, the accuracy of ramie plant counting model is improved. The advantage of applying DA lies in reducing the workload of sample labeling, increasing the number of training samples and improving the generalization ability of this model. Currently, the complete large-scale labeled database has not been established in the vast majority of crops. The proposed scheme has an important reference value for the investigation based on deep learning.
Lacking sample diversity is an important factor hindering the establishment and popularization of crop phenotypic analysis models. It is difficult to obtain samples containing different growth environments, genotypes, and other variable characteristics in a single experiment. In this study, a plant counting model based on 154 ramie germplasm resources was established, and the results demonstrated that the model had good performance with the Recall of 0.897, the Precision of 0.819.
Counting problems in the agricultural field and the evaluation of detection effects
In recent years, an increasing number of scholars have further improved the accuracy and calculation speed of plant counting with the assistance of the integrated application of image processing technology and deep learning. The method based on object detection can be employed to perform the object counting through collecting detected objects, and it can provide more detailed information, including the number, location and size of individual crops. In this study, the application effects of different object detection algorithms (FCOS, YOLOv5 and Faster RCNN) were compared. For ramie, one seed can produce multiple tillers, and ramie grows extremely dense, which significantly increases the difficulty of object detection. The result shows that FCOS has certain advantages in small object detection task.
Due to the fact that crop detection is accompanied by the whole crop growth stage, a real-time and efficient platform is required to obtain crop phenotypic information in the field. The crop canopy information can be rapidly obtained by UAV remote sensing technology, followed by the obtainment of the crop density information in the field. This study demonstrates that the plant number calculated from UAV-RGB images had a high consistency with that obtained by manual visual observation. This method is much more advanced than traditional manual counting. Firstly, UAV can obtain crop phenotypic information in a nondestructive, rapid and high-throughput manner, reduce the cost of manual counting, and save time and effort. Secondly, this method overcomes environmental factors and improves the accuracy of counting.
Influence of GSD on monitoring effect
In this study, Gaussian filtering was used to downsample the native images to synthesize low-resolution images. The result shows that there was no significant difference in model effect under different GSDs. When the model was trained and applied on medium-resolution images, it has better detection effect (Recall = 0.894, Precision = 0.822, RMSE = 0.088), which was inconsistent with the results of previous studies. Some studies believed the model constructed based on high-resolution images had more stable performance and can significantly improve the accuracy of crop object capture (Jin et al. Citation2017). This may be because the low-resolution ramie images contain enough valid information to accurately detect ramie plants. In addition, the ramie plant counting model based on FCOS was sensitive to image GSD. Therefore, the optimal aerial height should be selected to obtain high resolution images under the premise of not affecting the image quality. Meanwhile, the acquisition throughput of UAV remote sensing system should be controlled as much as possible to improve flight efficiency while providing high resolution.
Conclusion
In this research, we proposed a method to detect the number of ramie plants in UAV imagery, which solved the problems of small sample, complex crop background, small, dense detection objects. The results showed that data augmentation can improve the effect of plant counting and is an effective method to overcome the problem of insufficient sample. After DA, the detection precision was improved by 6.630%. We compared the performance of different object detection algorithms, and FCOS been proved have advantages in small objects with the Recall of 0.892, the Precision of 0.819, and the RMSE of 0.089. Moreover, ramie plant counting model was sensitive to image GSD, so it was necessary to keep the GSD consistency between training samples and validation samples. UAV remote sensing combined with deep learning technology provided a new way for crop density monitoring. The proposed method is simple and inexpensive, which could be used for a wide range of applications, including detection for other crop types.
Author Contributions
H.F. designed and conducted the experiment, processed and analyzed the imagery, and wrote the manuscript. K.Y. and W.W. participated in camera testing and image collection. A.L., M.X. and X.G. were involved in the process of the experiment. W.S. and G.C. were involved in the process of manuscript revision. All authors reviewed and approved the final manuscript.
Supplemental Material
Download MS Word (27 KB)Disclosure statement
No potential conflict of interest was reported by the authors.
Supplementary Material
Supplemental data for this article can be accessed online at https://doi.org/10.1080/15440478.2022.2159610
Additional information
Funding
References
- Bronick, C. J., and R. Lal. 2005. Soil structure and management: A review. Geoderma 124 (1–2):3–11. doi:10.1016/j.geoderma.2004.03.005.
- Cui, D. D., G. X. Cui, R. F. Yang, W. She, Y. Liu, H. Wang, X. Su, J. Wang, W. Liu, X. Wang, et al. 2021. Phenotypic characteristics of ramie (Boehmeria nivea L) germplasm resources based on UAV remote sensing. Genetic Resources and Crop Evolution. 68(2):1–16. doi:10.1007/s10722-020-01005-3.
- Feng, A., J. Zhou, E. Vories, and K. A. Sudduth. 2020. Evaluation of cotton emergence using UAV-based imagery and deep learning. Computers and Electronics in Agriculture 177:105711–26. doi:10.1016/j.compag.2020.105711.
- Fernandez, G., C. K. Shawn, A. G. Nieves, M. T. Nieto-Taladriz, and J. L. Araus. 2018. Wheat ear counting in field conditions: High throughput and low cost approach using RGB images. Plant Methods 14 (1):22. eCollection 2018. doi:10.1186/s13007-018-0289-4.
- He, M. X., P. Hao, and Y. Z. Xin. 2020. A Robust Method for Wheatear Detection Using UAV in Natural Scienes. IEEE Access 8:189043–53. doi:10.1109/ACCESS.2020.3031896.
- Hu, L. Y., and D. X. Peng. 1998. Analysis of constituent factors of ramie yield. Plant Fiber Sciences in China 02:12–16.
- Jiang, J., K. Johansen, C. S. Stanschewski, G. Wellman, M. A. A. Mousa, G. M. Fiene, K. A. Asiry, M. Tester, and M. F. McCabe. 2022. Phenotyping a diversity panel of quinoa using UAV-retrieved leaf area index, SPAD-based chlorophyll and a random forest approach. Precision Agriculture 23 (3):1–23. doi:10.1007/s11119-021-09870-3.
- Jin, X. L., S. Y. Liu, F. Baret, M. Hemerlé, and A. Comar. 2017. Estimates of plant density of wheat crops at emergence from very low altitude UAV imagery. Remote Sensing of Environment 198:105–14. doi:10.1016/j.rse.2017.06.007.
- Madec, S., X. Jin, H. Lu, B. D. Solan, S. Liu, F. Duyme, E. Heritier, and F. Baret. 2019. Ear density estimation from high resolution RGB imagery using deep learning technique. Agricult Forest Meteorol 264:225–34. doi:10.1016/j.agrformet.2018.10.013.
- Minu, E. P., and L. P. Maya. 2020. Detection of rice leaf diseases using image processing. IEEE 670–72. doi:10.1109/ICCMC48092.2020.ICCMC-00080.
- She, W., Y. C. Jie, H. C. Xing, Y. Lu W. Kang D. Wang . 2011. Heavy metal content and bioaccumulation of ramie growing on 3 mining areas in Shimen, Lengshuijiang and Liuyang of Hunan Province. Acta Ecologica Sinica 31 (03):874–81.
- Sun, B., W. Zhou, S. Zhu, S. Huang, X. Yu, Z. Wu, X. Lei, D. Yin, H. Xia, Y. Chen, et al. 2022. Universal detection of curved rice panicles in complex environments using aerial images and improved YOLOv4 model. Frontiers in plant science 13:1021398. doi:10.3389/fpls.2022.1021398.
- Tan, Z. J., Z. Y. Wang, Y. J. Yi, and H. Y. Wang. 2015. Research progress of medicinal ingredients extraction from main fiber crops. Technology & Development of Chemical Industry 44 (1):23–28.
- Velumani, K., R. Lopez-Lozano, S. Madec, W. Guo, J. Gillet, A. Comar, and F. Baret. 2021. Estimates of maize plant density from UAV RGB images using Faster-RCNN detection model: Impact of the spatial resolution. Plant Phenomics 2021:9824843. doi:10.34133/2021/9824843.
- Wrather, J. A., B. J. Phipps, W. E. Stevens, A. S. Phillips, and E. D. Vories. 2008. Cotton planting date and plant population effects on yield and fiber quality in the Mississippi Delta. Journal of Cotton Science 12:1–7.
- Xiong, H. P., J. G. Jiang, C. M. Yu, and Y. L. Guo. 1998. Relationship between component factors of ramie yield and yield. Acta Agronomica Sinica 2:155–60.
- Jin, Y. A. N. G., M. I. N. G. Bo, Y. A. N. G. Fei, X. U. Honggen, L. I. Lulu, G. A. O. Shang, L. I. U. Chaowei, W. A. N. G. Keru, and L. I. Shaokun.et al. 2021. The accuracy differences of using unmanned aerial vehicle images monitoring maize plant height at different growth stages. Smart Agriculture 3 (3):129–38. doi:10.12133/j.smartag.2021.3.3.202105-SA008.
- Zhu, J., G. Yang, X. Feng, X. Li, H. Fang, J. Zhang, X. Bai, M. Tao, and Y. He. 2022. Detecting wheat heads from UAV low-altitude remote sensing images using deep learning based on transformer. Remote Sensing 14 (20):5141. doi:10.3390/rs14205141.