
 ?Mathematical formulae have been encoded as MathML and are displayed in this HTML version using MathJax in order to improve their display. Uncheck the box to turn MathJax off. This feature requires Javascript. Click on a formula to zoom.
ABSTRACT
The present paper focuses on the valorization of raw and treated Calotropis gigantea fibers as a natural and low-cost biosorbent for methylene blue. To assess the effect of the fiber treatment, chemical, morphological, thermal, and structural characterizations were performed. The adsorption characteristics were achieved by varying the pH, the initial dye concentrations, temperature, and contact time. The pseudo-first-order kinetic model fits accurately the experimental data. The adsorption isotherms have been fitted using several models. The monolayer model with one energy is finally adopted because the error on the parameters inherent to the model is relatively small. The adsorption isotherms of the raw and treated fibers reveal that when the temperature increases, the adsorption capacity is reduced. The maximum adsorption capacity is obtained at the temperature 25°C. It is equal to 31 mg/g and 13 mg/g for the raw fiber and the treated fiber, respectively. The steric parameter is greater than one for the raw fiber, whereas it is smaller than one for the treated fiber. The adsorption energy is about 19 kJ/mol. The Calotropis gigantea fiber seems to be a potential candidate for the removal of methylene blue from polluted water.
摘要
本论文重点研究了天然和低成本的亚甲基蓝生物吸附剂——粗和经处理的巨萼蓝纤维的稳定化. 为了评估纤维处理的效果, 进行了化学, 形态, 热和结构表征. 通过改变pH, 初始染料浓度, 温度和接触时间来实现吸附特性. 伪一阶动力学模型与实验数据吻合较好。吸附等温线已使用几个模型拟合. 最终采用具有一个能量的单层模型, 因为模型固有参数的误差相对较小. 粗纤维和处理纤维的吸附等温线表明, 当温度升高时, 吸附能力降低.最大吸附容量在25°C的温度下获得. 粗纤维和经处理的纤维分别等于31 mg/g和13 mg/g. 原纤维的空间参 数n大于1, 而处理纤维的空间系数n小于1. 吸附能约为19 kJ/mol. 大型Calotropis纤维似乎是去除污染水中亚甲基蓝的潜在候选材料.
Introduction
Water pollution and water treatment retained a growing preoccupation during the last decades, especially in arid and semi-arid countries. A profusion of industries release hazardous organic and inorganic pollutants. Many techniques for removing contaminants from wastewater are available (Hua et al. Citation2020). Adsorption may be considered as a potential method for this issue (Zhang et al. Citation2020). Several absorbents have been considered and in particular biomass resources including chitosan, lignin, cellulose, etc. For example, tea waste (Uddin et al. Citation2009), pergularia tomentosa L. fruit (Belmabrouk et al. 2022), Brazilian berries seeds (Sellaoui et al. Citation2020), almond shell (Jabli et al. Citation2017), mountain soursop seeds (Pang et al. Citation2020), and palm waste (Belala et al. Citation2011) have been used for the removal of methylene blue from water. Cellulose may be present in natural fibers, seeds, leaves, and fruits.
Natural fibers have been used to reinforce polymer matrices as well as in textile and other industrial applications. Several natural fibers have gained increasing attention during the last decades (Raja et al. Citation2021). Calotropis gigantea is included among these natural fibers. The characterization of Calotropis gigantea fiber (CGF) and the analysis of its physicochemical and mechanical properties have been carried out by several researchers in the framework of diverse applications. In addition to its medicinal properties, the removal of dyes, the extraction of cellulose, the synthesis of nanoparticles, and the reinforcement of thermomechanical properties are among the main issues that have drawn the attention of researchers who have worked on this natural fiber.
Zheng et al. investigated the ability of Calotropis gigantea fiber (CGF) as a biosorbent for elimination of oil or organic solvents (Zheng et al. Citation2016). The fiber has been characterized by several techniques. Its wettability, oil-absorbing capacity, oil-water separation, reusability, and absorption selectivity have been deeply investigated. The adsorption kinetics and the effect of initial pH have been initiated. The adsorption isotherms have been fitted using only three empirical models, namely Langmuir, Freundlich, and Redlich-Peterson models.
Ammar et al. investigated the biosorption of methylene blue by the Calotropis gigantea seedpods (Ammar, El-Ghoul, and Jabli Citation2021). However, only empirical models have been used to fit the adsorption isotherms. The mean free energy was computed using Dubinin – Radushkevich equation. Narayanasamy et al. (Citation2020) analyzed the modification of the structural, morphological, and physicochemical properties of CGF due to alkali treatment. Nevertheless, the adsorption has not been treated in this last paper.
In this paper, we investigate the potential of raw and treated Calotropis gigantea fibers (CGFs) as biosorbents for methylene blue from water. Several techniques have been used to characterize the biomaterials. The experimental data related to the adsorption kinetics are fitted using different models. In the matter of adsorption isotherms, the experimental data are fitted on the basis of advanced models. These models are obtained from statistical physics. An important advantage of these analytical models lies in the fact that physical meanings can be assigned to the adjustable parameters inherent to the models. In particular, these models permit to compute the adsorption energy.
Experimental techniques and data processing
Materials
The chemicals used in the current paper are analytical grade. Therefore, no supplementary purification is requisite. The adsorbate used is methylene blue (MB). This dye is purchased from Sigma-Aldrich. Distilled water is employed for the preparation and the dilution of MB solutions.
Preparation of the adsorbent
Calotropis gigantea fibers were collected from the area of Al-Zulfi, province of Riyadh, KSA. Calotropis gigantea is a large shrub as shown in . It grows up to approximately 4 m. It contains flowers of lavender or white color. This plant has a milky sap and it blooms all season but mainly in the summer. The fruits appear in clusters as shown in . They contain the seeds and a fiber ().
Figure 1. Some picture of the Calotropis gigantea plant, fruits and fibers.
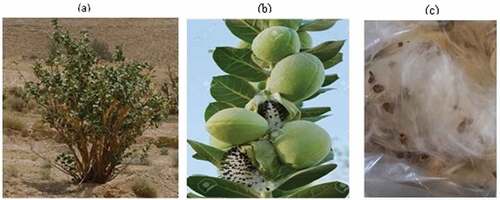
The extraction of cellulose was performed with reference to a method reported by Gao et al. (Citation2020) with a minor adjustment. The harvested fibers were washed with tap water to remove the sand and other vegetable impurities. The fibers are then spread over a large area on the laboratory bench at ordinary temperatures. The fibers were first treated at 80°C for 2 h in 5 wt.% NaOH with a liquor ratio of 1:50 (m/v) to remove the wax and most lignins. Then, they were treated at 90°C for 2 h in a mixed solution of acetic acid and H2O2 (v/v = 1:1) with a liquor ratio of 1:50 (m/v) to remove the residual lignin and bleach the fiber. The obtained suspension was filtered using Whatman filter paper and oven-dried at 60°C for 6 h.
Characterization instruments
The FTIR spectra of the raw and treated Calotropis gigantea fibers were measured using an Agilent Technologies, Cary 600 Series spectrophotometer. The spectral range covered is 4000–400 cm−1 and the resolution is 2 cm−1. The attenuated total reflection mode is used. The surface morphology of the fibers was scanned with a Scanning Electron Microscope (Hitachi S-2360N). Two values of the accelerating voltage are used, namely 15kV and 20kV. The powdered fruit was coated with Au by a vacuum sputter-coater. Concerning thermal analysis experiments, the samples were placed in a Pt crucible. A NETZSCH STA 449F3 Jupiter instrument was used. The temperature varies in the range 20–450°C.The measurements were performed in an airflow at a heating rate of 10°C/min. A PANalyticalX’Pert PRO MPD diffractometer was used to obtain the X-ray diffraction patterns. The samples were scanned in the angle between 10° and 90°. The step width was 0.02°. The operating voltage and current intensity were 40kV and 40 mA, respectively.
Adsorption experiments
The different kinds of the adsorption measurements were performed in the batch mode. The titration flasks were agitated for a preset interval of time (from 0 to 120 min for the kinetic study). The agitation speed was 150 rpm. A parametric study had been conducted to investigate the effect of pH, initial dye concentration, temperature, and time. Three isotherms had been measured. The adsorption kinetics was measured for three values of the initial dye concentration. A spectrophotometer was used to measure the MB absorbance. The calibration wavelength used to convert the absorbance into a concentration is 665 nm.
The equilibrium adsorption capacity and the adsorbed quantity
at the instant t are, respectively, defined by:
The units of these quantities are . In the above equations,
is MB initial concentration (
,
and
are its concentrations at equilibrium and at time t, respectively. The units of these concentrations is (
. The symbol
represents the mass of the absorbent. Its unit is
. Finally,
stands for the volume of the solution (
.
Kinetic models and adsorption isotherm models
Kinetic models
To fit the kinetic experimental data, three analytical models will be used. For these models, the expression of adsorbed quantity at an instant
is given hereafter.
Pseudo first-order (PFO) adsorption kinetic model:
Pseudo second-order (PSO) adsorption kinetic model:
Bangham adsorption kinetic model:
The adjustable parameters involve in these models are the equilibrium adsorbed quantity as well as the rate constants
,
, and
. The reference time is
. It is used to guarantee that the rate constants
,
and
have the same unit. The Bangham model contains a third parameter, namely the exponent
. For this reason, this model is expected to be more flexible and will fit the data more accurately.
Two criteria will be used to assess the quality of the fit. The first one is the correlation coefficient between the experimental and the theoretical results given by the model. This quantity is defined by:
where is the number of experimental data,
and
are, respectively, the ith measured value and the ith value obtained using the analytical model.
and
are, respectively, the mean values of the experimental data and the predicted results. The correlation coefficient
has no unit.
The above criterion proves to be very insufficient and should be supplemented by another criterion to warrant an adequate prediction and parameter identification. The second criterion used in this paper is the root mean square error (RMSE). This quantity is given by:
The unit of the is obviously
.
Adsorption isotherm models
Concerning the adsorption isotherms, several empirical models are available in the literature such as the Langmuir model, the Freundlich model, or the Dubinin–Radushkevich model. Although these models have been extensively exploited, we prefer in this paper to use advanced models derived from statistical physics. Indeed, the advanced models has the advantage to assign directly physical meanings to all the adjustable parameters inherent to them. In addition, these models enable to compute the adsorption energy. Four models will be tested. These models may be monolayer or double-layer or multilayer. More precisely, the expression of the equilibrium adsorbed quantity versus the equilibrium concentration
for each model is given hereafter.
Monolayer model with one energy (Li et al. Citation2020; Sellaoui et al. Citation2020):
This model contains three adjustable parameters, namely the density of receptor sites of adsorbent, the number
of adsorbed molecules per site, and the concentration
at half saturation.
Monolayer model with two energies (Bajahzar et al. Citation2020):
The meanings of the parameters ,
,
,
,
, and
are similar to those of the above model. The index 1 and index 2 refer to the two kinds of receptor sites, which have two different energies.
The double-layer model with two energies (Pang et al. Citation2019):
denotes the concentration at half saturation of the layer number
(
. Obviously, we have
.
Multilayer model with saturation (Li et al. Citation2019):
where the quantity is defined by:
This quantity was introduced just to simplify the writing of the expression of .
The values of the modifiable parameters depend on course on the temperature T. An iterative algorithm is employed to perform the adjustment of the experimental isotherms in the framework of the above models. To select the most adequate models, three indicators are used. Firstly, the value of the correlation coefficient should approach as close as possible the maximum value 1. Secondly, the RSME should be very small or even negligible compared to the maximal value of
. Finally, the solution should be unique in order to have a real physical meaning. Indeed, if the optimal parameter set forms a valley or a manifold having a dimension equal or greater than one, the modification of one parameter or a combination of some parameters may have no effect on the isotherm, which is not acceptable. To ensure this condition, the standard deviation on the optimal parameter set should be small compared to its mean value.
Results and discussion
Characterization of the biomaterial
exhibits the FTIR spectra of the raw and treated Calotropis gigantea fibers. The spectrum of the raw fiber displays many adsorption peaks. The broad peak around 3318 cm−1 is related to hydroxyl (OH) group (Pang et al. Citation2020). The peaks observed at 2864 cm−1 and 2850 cm−1 are the proof of the presence of the CH and CH2 groups (Ramesh et al. Citation2020). The peaks centered at 1730 cm−1 and 1236 cm−1 are the proofs for the existence of C=O group in hemicellulose and lignin (Mohammed et al. Citation2021). The peak observed at 1426 cm−1 is attributed to the angular deformation of C-H group in cellulose. The peak at 1031 cm−1 is assigned to C-O-C stretching vibration in cellulose. The values of the centers of the peaks observed by Zheng et al. (Citation2016), Ammar, El-Ghoul, and Jabli (Citation2021), and Raja et al. (Citation2021) have very close values to those observed in the present study.
Figure 2. FTIR spectrum of raw and treated Calotropis gigantea fibers.
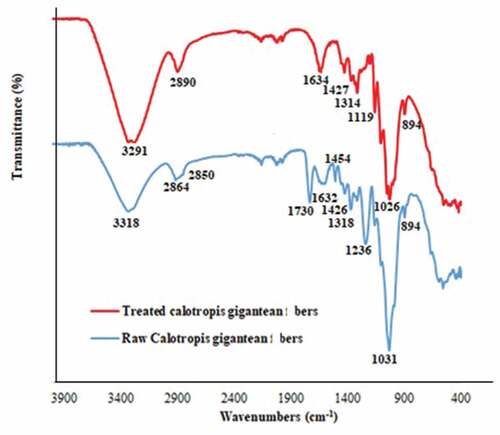
Concerning the FTIR spectrum of the treated fiber, some modifications are observed. The most significant observation is the disappearance of the peak at 1730 cm−1 which is a proof of the elimination of hemicellulose and lignin. These results corroborate with the results obtained by other authors (Gao et al. Citation2020).
depicts some SEM images of the raw and treated Calotropis gigantea fibers. The structure of the raw CGF is hollow tubular (). This structure is largely damaged after the treatment because of the elimination of hemicellulose and lignin as confirmed by the FTIR spectra. Furthermore, the treated fiber exhibits a rough surface (). It is expected that the modification will affect the adsorption capacity of the fiber. Zheng et al. (Citation2016) observed a smooth surface having wrinkles. Ammar et al. (Citation2021) observed a smooth and homogeneous surface. They also noted the presence of porous structures, which are susceptible to be occupied by dye molecules. On the contrary, Raja et al. (Citation2021) obtained a rough surface.
Figure 3. SEM images of (a) raw Calotropis gigantea fiber and (b) treated fiber.
The Thermogravimetric Analysis (TGA) and Differential Thermal Analysis (DTA) of the raw and treated fibers are presented in . The thermal decomposition is mainly achieved in four phases. The first phase is largely provoked by the evaporation of the humidity contained in the samples (Narayanasamy et al. Citation2020). The degradation of the other volatile contents held in the biomaterial also occurs in this phase. This first phase is observed for a temperature range smaller than 70°C. It is accompanied by a loss mass of approximately 6% for the raw fiber and 7% for the treated fiber. During the second phase, the degradation becomes very slow. This phase extends to 220°C and 270°C for the untreated and treated fibers, respectively. Then, a sharp degradation is observed. It is a signature of the decomposition of hemicellulose and cellulose (Ramesh et al. Citation2020). This behavior corroborates the FTIR results. This phase is associated with an important mass loss. It prolonged to approximately 350°C and 360°C for the untreated and treated fibers, respectively. These values are obtained from the intercepts of the tangents of the curves. The last phase is related to the depolymerization and decomposition of glycosyl radicals of the cellulosic biomaterial (Ramesh et al. Citation2020). The total thermal decomposition of the raw fiber is reached at the temperature 436°C. However, only about 85% of the treated fiber is decomposed at the same temperature. This result also indicates that the treated fiber is more thermally stable. The values of degradation temperatures obtained by Ammar, El-Ghoul, and Jabli (Citation2021), and Raja et al. (Citation2021) have very close values to those detected in the present study.
Figure 4. TGA and DTA curves of (a) raw Calotropis gigantea fiber and (b) treated fiber.
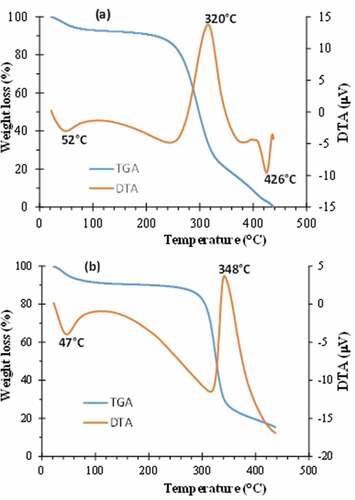
The rate of the degradation may also be evaluated on the basis of DTA curves. Indeed, the sharpness of the peaks is correlated to the rate of the decomposition process, whereas the height of each peak and more precisely the peak area are related to the enthalpy required to achieve the process. For the raw fiber, three peaks are revealed while for the treated fiber, only two peaks appear clearly. It should be noted that when the process is very slow, the peak does not manifest itself very clearly. For the two samples, the endothermal decomposition observed at 52°C and 46.5°C is assigned to the evaporation of water molecules present in each structure. The peaks related to the decomposition of cellulosic and non-cellulosic matters are centered on the temperature 320°C and 348°C for the raw fiber and treated fiber, respectively.
shows the XRD diffractograms of the raw and treated Calotropis gigantea fibers. The diffraction patterns of the two samples reveal that cellulose of both fibers is cellulose I since there is no doublet in intensity of the main crystalline peak (Reddy et al. Citation2017). The main reflection peaks for raw and treated fibers are observed at 16.36°, 22.76°, and 34.86°, corresponding to (110), (200), and (040) lattice planes of crystalline cellulose I polymorph (Maaloul et al. Citation2017). Similarly to the present study, Raja et al. (Citation2021) observed a principal peak at 23.15°. The secondary peak at 16.36° may be formed by two overlapping peaks related to the presence of amorphous content in the fibers and the existence of polysaccharides at the fiber walls. The small peak at 34.86° is probably due to the presence of inorganic matters in the fibers. The XRD diffractograms obtained in the present study have a better quality than that measured by Ammar, El-Ghoul, and Jabli (Citation2021) and they contain less noise.
Figure 5. XRD diffractograms of raw and treated Calotropis gigantea fibers.
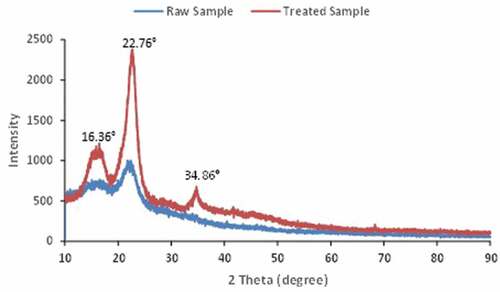
The crystallinity index () was calculated by Segal’s method using the following equation:
where is the intensity of the highest crystalline peak (2 θ = 22.76°) and
is the intensity of the predominantly amorphous peak at 2θ = 16.36°.
The crystallinity index values of both the raw and treated fibers were 25% and 52%, respectively. These relatively low values calculated for the untreated and modified fibers were imputed in the presence of amorphous compounds such as hemicelluloses and lignin in the fiber’s composition. This result is in line with that reported in prior researches (Millogo et al. Citation2015). The crystallinity index obtained by Raja et al. (Citation2021) is about 61%. Jabli et al. (Citation2018) obtained a crystallinity index 43.4% for Nerium oleander fibers. In addition, we noted the increase in the crystallinity behavior after the treatment of cellulosic fibers. This could be explained by the chemical treatment that generally induces an increase in crystallinity (Alemdar and Sain Citation2008). Nonetheless, it might also be due to the removal of amorphous compounds such as lignin and hemicelluloses (Jonoobi et al. Citation2009).
Effect of the experimental parameters on the adsorption of methylene blue
The effect of pH on the adsorption of MB has been investigated at a temperature of 22°C, an initial concentration of dye
and a contact time of 40 min. When the pH increases from 3.5 to 6, the adsorption of MB is significantly enhanced whether for the raw or treated fiber. The adsorption capacity reaches its optimal value at a pH = 6. Then, the curves show a continuous and slow bearish when the pH increases. This behavior may be explained by the fact that the dye is susceptible to be adsorbed by means of protonation if the Calotropis gigantea fiber is negatively charged or inversely it can be adsorbed via deprotonation of carboxylic groups when the fiber surface is positively charged (Din et al. Citation2018).
Mathematical models for kinetic data
The adsorption kinetics was measured for three initial concentrations, namely ,
and
. As mentioned above, three models are used to fit the experimental data. The first criterion to evaluate coarsely the quality of the fit is the correlation coefficient
. The results show that this coefficient is 0.995 ± 0.007 and its minimal value is 0.97. This proves that all the models fit relatively adequately the experimental data and the identification of the parameters is acceptable. To assess more precisely the quality fit, one should measure the error between the experimental data and the theoretical results obtained by the models. The RMSE is adopted to estimate the error. The average values of the RMSE related to the PFO, PSO, and Bangham adsorption kinetic models are, respectively
,
, and
. It appears clearly that the PFO model fits accurately the experimental data with an acceptable error. The Bangham model also gives satisfactory results. However, the PSO model is less suitable. The adsorption mechanism appears to be a physisorption mechanism in the current study.
exhibits the kinetic curves for the raw and treated fibers and for three values of the initial concentration . The experimental data are fitted using the pseudo-first-order model. The adjustable parameters encompassed in this model are summarized in part 1 of . From the value of rate constant
, we deduce that 95% of the biosorption occurs in an interval ranging from 5 min to 15 min depending on the initial concentration
and whether the fiber is raw or treated.
Figure 6. Experimental kinetic curves. (a) raw fiber. (b) treated fiber.
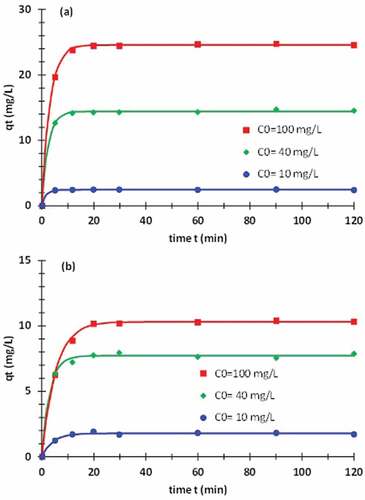
Table 1. Part 1: Values of the equilibrium adsorption capacity and constant rate
related to the pseudo-first-order model. Part 2: Values of the correlation coefficient
and the RMSE related to four adsorption isotherm models.
Adsorption isotherms models
The adsorption isotherms have been fitted using four models. As mentioned above, three criteria are used to decide on the quality of the parameters’ identification. In the matter of the correlation coefficient , all the models lead to a coefficient
greater than 0.99 for the raw fiber as well as for the treated fiber, and this is true for the entire temperature range studied. Part 2 of exhibits, for each model, the average value of
over the different temperatures. In other words, all the models are a priori acceptable. Part 2 of exhibits also the average values of the
. These values are relatively small compared to the saturation values of
. We can conclude that all models are theoretically admissible. It then becomes necessary to have recourse to the third criterion. Concerning the monolayer model with two energies, when scrutinizing the values of the different parameters and especially the extension of their domain, we note that the parameter
specifically but also other parameters may vary in a relatively large extent. This contradict the uniqueness of the solution. For this reason, this model is discarded. Concerning the two layers model with two energies, it appears that the obtained values of
,
and to some extent
vary in a relatively large domain. Indeed, the relative error on these quantities may reach 30%. Therefore, this model is also excluded. Despite the fact that the multi-layer model seems to fit the results more adequately, this model is rejected because the parameter
can vary over a very wide range. In the matter of the monolayer model with one energy, the relative error on the identification parameters does not exceed 6%. In conclusion, this model is acceptable and fits accurately the data.
depicts the adsorption isotherms. The theoretical results obtained using the monolayer model with one energy are also plotted. It appears that the treatment reduces the adsorption capacity contrary to expectations. This is due to the fact that some of the eliminated matter adsorb more than the residual components. Furthermore, when the temperature increases, the adsorption capacity is reduced. The maximum adsorption capacity is obtained at 25°C. It is equal to 31 mg/g and 13 mg/g for the raw fiber and the treated fiber, respectively. Ammar et al. obtained a value of 88 mg/g for the adsorption capacity of methylene blue using Calotropis seedpods (Ammar, El-Ghoul, and Jabli Citation2021). presents a comparison of the maximum adsorption capacity of methylene blue obtained using several biosorbents. It should be noted that contrary to the expected results, Calotropis gigantea treated fiber has a lower adsorption capacity than many other contemporary adsorbents. To overcome this issue, another treatment should be made to enhance the capacity of the fiber. The adsorption capacity of the obtained fibers toward methylene blue could be improved using a cationization treatment, for example through the incorporation of amino groups.
Figure 7. Adsorption isotherms. (a) raw fiber. (b) treated fiber. Solid lines correspond to monolayer layer model with one energy.
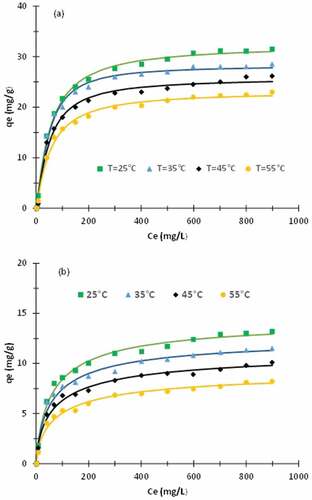
Table 2. Comparison of the maximum adsorption capacity of methylene blue using several biomaterials.
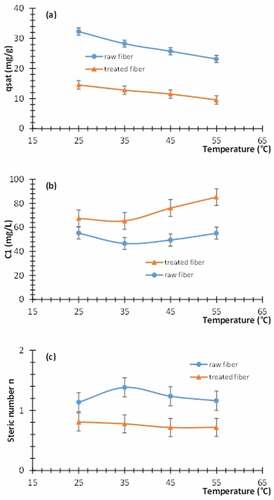
The variations, versus the temperature, of the parameters contained in the monolayer model with one energy are plotted in . The saturation adsorbed quantity is plotted in . This quantity decreases versus the temperature contrary to the preliminary expectations. The error bars indicate the extension of the plausible parameter. The error induced by the identification process is mainly due to experimental errors on isotherms. It remains in an acceptable range. illustrates the curves of the half-saturation concentrations
versus the temperature for the raw and treated fibers. This quantity changes to a slight extent versus the temperature. exhibits the curves of steric parameter
. It appears that for the raw fiber, this parameter is greater than one. However, it is smaller than one for the treated fiber. We deduce that the raw fiber could be anchored by one or two dye molecules per site. If the percentages of receptor sites (i.e. functional groups) occupied by one and two dye molecules are, respectively, designated by
and
, we obtain the following relation for the raw fiber
. This equation allows to compute
. We obtain that about
% of raw-fiber receptor sites adsorb simply one dye molecule, whereas
of the receptor sites adsorb two dye molecules. The adsorbate is attracted to an oblique position. The uncertainty on the above values is due to experimental errors and variation versus the temperature. For the treated fiber, we have
. We deduce that each dye molecule may be shared by more than one receptor site. In other words, the dye molecules were adsorbed horizontally. We define the following anchorage number
where
is the percentage of dye molecules anchored to one receptor site and
is the percentage of dye molecules anchored concomitantly to two receptor sites. The average values of
and
are, respectively,
and
. The value of
and
depend obviously on the temperature.
Figure 8. Variation of the parameters of the monolayer model with one energy versus the temperature for the raw and treated fibers. (a) the saturation adsorbed quantity. (b) half-saturation concentration . (c) Steric number
.
From the values of the half-saturation concentrations versus the temperature, we can deduce the adsorption energy
(Belmabrouk et al. 2022). We obtain
for the raw fiber and
or the treated fiber. We remind that the adsorption energy is the energy required to link the adsorbate and the adsorbent via the adsorption process. The uncertainty on the above values is also provoked by experimental errors and variation of
versus the temperature. The adsorption energy
increases slightly versus the temperature. The order of magnitude of
validates the results found from the kinetic study and proves that the nature of the biosorption in the current study is physisorption. The difference in the values of the adsorption energy is very small. This is probably due to the fact that the same forces are involved in the two types of fibers. These forces are mainly due to van der Waals interactions and hydrogen bonding. The treatment does not affect the energy binding.
Conclusion
The present paper aims to demonstrate the performance of raw and treated Calotropis gigantea fibers as a biosorbent for methylene blue dye. The first part focuses on the characterization of the samples using Scanning Electron Microscopy (SEM), FTIR spectroscopy, Thermogravimetric Analysis (TGA), and X-Ray diffraction (XRD). This reveals the modification in the surface morphology and structure due to the fiber treatment. The influence of pH, initial dye concentration, temperature, and contact time has been investigated. In the matter of adsorption kinetics, it appears that the pseudo-first-order kinetic model fits reliably the experimental data and the adsorption mechanism proves to be a physisorption process using raw or treated Calotropis gigantea fibers for the removal of methylene blue dye.
The adsorption isotherms have been fitted using several models. An attentive discussion has been conducted to explain how to select the best model that fits accurately the experimental isotherms. The monolayer model with one energy seems to be the more adequate since the relative error on the identification parameters is very limited. The variations, versus the temperature, of the parameters enclosed in the monolayer model with one energy are investigated. These parameters are the saturation adsorbed quantity, the half-saturation concentrations, and the steric parameter . The adsorption isotherms of the raw and treated fibers reveal that when the temperature increases, the adsorption capacity is reduced. The maximum adsorption capacity is obtained at the temperature 25°C. It is equal to 31 mg/g and 13 mg/g for the raw fiber and the treated fiber, respectively. Furthermore, it appears that the steric parameter
is greater than one for the raw fiber, whereas it is smaller than one for the treated fiber. We obtained that
% of raw-fiber receptor sites adsorb simply one dye molecule, whereas
of the receptor sites adsorb two dye molecules. On the other hand, concerning the treated fiber, the percentage of dye molecules anchored to one receptor site is
and the percentage of dye molecules anchored at the same time to two receptor sites is
. The adsorption energy is
for the raw fiber and
for the treated fiber.
Highlight
Raw and treated Calotropis gigantea fibers were investigated for the biosorption of methylene blue.
Different experimental techniques have been used to characterize the raw and treated fibers.
Four advanced models were used to fit the adsorption isotherms.
The monolayer model with one energy proves to be the most suitable.
The biomaterial is a potential candidate for removing cationic dyes from polluted water.
Ethical approval
Not applicable. The study does not involve humans or animals.
Acknowledgments
The authors extend their appreciation to the Deanship of Scientific Research at Majmaah University for funding this research work through the project number (R-2021-191).
Disclosure statement
No potential conflict of interest was reported by the author(s).
Additional information
Funding
References
- Alemdar, A., and M. Sain. 2008. Isolation and characterization of nanofibers from agricultural residues – Wheat straw and soy hulls. Bioresource Technology 99 (6):1664–16. doi:10.1016/j.biortech.2007.04.029.
- Ammar, C., Y. El-Ghoul, and M. Jabli. 2021. Characterization and valuable use of Calotropis gigantea seedpods as a biosorbent of methylene blue. International Journal of Phytoremediation 23 (10):1085–94. doi:10.1080/15226514.2021.1876629.
- Bajahzar, A., M. Bouzid, C. Briki, F. Nasri, H. Belmabrouk, and A. Jemni. 2020. Experimental and numerical study of the isotherms and determination of physicochemical parameters of the hydrogen absorption/desorption process by the metal hydrides. International Journal of Hydrogen Energy 45 (30):15281–93. doi:10.1016/j.ijhydene.2020.04.016.
- Belala, Z., M. Jeguirim, M. Belhachemi, F. Addoun, and G. Trouvé. 2011. Biosorption of basic dye from aqueous solutions by date stones and palm-trees waste: Kinetic, equilibrium and thermodynamic studies. Desalination 271 (1–3):80–87. doi:10.1016/j.desal.2010.12.009.
- Belmabrouk, H., M. Selmi, T. Alshahrani, A. Bajahzar, and M. Jabli. 2022a. Experimental and theoretical study of methylene blue biosorption using a new biomaterial Pergularia tomentosa L. fruit. International Journal of Environmental Science and Technology 19 (12):1–18. doi:10.1007/s13762-022-03979-2.
- Belmabrouk, H., M. Selmi, T. Alshahrani, Z. Raddaoui, A. Bajahzar, M. Jabli, and T. Alharbi. 2022b. Cationic dye removal using Pergularia tomentosa L. fruit: Kinetics and isotherm characteristics using classical and advanced models. Comptes Rendus de Chimie 25 (S2):61–79. doi:10.5802/crchim.181.
- Din, M. I., A. G. Nabi, A. Rani, A. Aihetasham, and M. Mukhtar. 2018. Single step green synthesis of stable nickel and nickel oxide nanoparticles from Calotropis gigantea: Catalytic and antimicrobial potentials. Environmental Nanotechnology, Monitoring, and Management 9:29–36. doi:10.1016/j.enmm.2017.11.005.
- Gao, A., H. Chen, J. Tang, K. Xie, and A. Hou. 2020. Efficient extraction of cellulose nanocrystals from waste Calotropis gigantea fiber by SO42-/Tio2 nano-solid superacid catalyst combined with ball milling exfoliation. Industrial Crops and Products 152:112524. doi:10.1016/j.indcrop.2020.112524.
- Hua, P., L. Sellaoui, D. Franco, M. S. Netto, G. L. Dotto, A. Bajahzar, H. Belmabrouk, A. Bonilla-Petriciolet, and Z. Li. 2020. Adsorption of acid green and procion red on a magnetic geopolymer based adsorbent: Experiments, characterization and theoretical treatment. Chemical Engineering Journal 383:123113. doi:10.1016/j.cej.2019.123113.
- Jabli, M., E. Gamha, N. Sebeia, and M. Hamdaoui. 2017. Almond shell waste (Prunus dulcis): Functionalization with [dimethyl-diallyl-ammonium-chloride-diallylamin-co-polymer] and chitosan polymer and its investigation in dye adsorption. Journal of molecular liquids 240:35–44. doi:10.1016/j.molliq.2017.05.041.
- Jabli, M., N. Tka, K. Ramzi, and T. A. Saleh. 2018. Physicochemical characteristics and dyeing properties of lignin-cellulosic fibers derived from Nerium oleander. Journal of molecular liquids 249:1138–44. doi:10.1016/j.molliq.2017.11.126.
- Jonoobi, M., J. Harun, M. Mishra, and K. Oksman. 2009. Chemical composition, crystallinity and thermal degradation of bleached and unbleached kenaf bast (Hibiscus cannabinus) pulp and nanofiber. BioResources 4:626–39.
- Li, Z., G. L. Dotto, A. Bajahzar, L. Sellaoui, H. Belmabrouk, A. B. Lamine, and A. Bonilla-Petriciolet. 2019. Adsorption of indium (III) from aqueous solution on raw, ultrasound-and supercritical-modified chitin: Experimental and theoretical analysis. Chemical Engineering Journal 373:1247–53. doi:10.1016/j.cej.2019.05.134.
- Li, Z., L. Sellaoui, D. Franco, M. S. Netto, J. Georgin, G. L. Dotto, A. Bajahzar, H. Belmabrouk, A. Bonilla-Petriciolet, and Q. Li. 2020. Adsorption of hazardous dyes on functionalized multiwalled carbon nanotubes in single and binary systems: Experimental study and physicochemical interpretation of the adsorption mechanism. Chemical Engineering Journal 389:124467. doi:10.1016/j.cej.2020.124467.
- Maaloul, N., R. B. Arfi, M. Rendueles, A. Ghorbal, and M. Diaz. 2017. Dialysis-free extraction and characterization of cellulose crystals from almond (Prunus dulcis) shells. Journal of Materials and Environmental Science 8:4171–81.
- Millogo, Y., J. -E. Aubert, E. Hamard, and J. -C. Morel. 2015. How properties of kenaf fibers from Burkina Faso contribute to the reinforcement of earth blocks. Materials 8 (5):2332–45. doi:10.3390/ma8052332.
- Mohammed, M. A., W. J. Basirun, N. M. M. Abd Rahman, and N. Mohamad Salleh. 2021. The effect of particle size of almond shell powders, temperature and time on the extraction of cellulose. Journal of Natural Fibers 1–11. doi:10.1080/15440478.2021.1881689.
- Narayanasamy, P., P. Balasundar, S. Senthil, M. Sanjay, S. Siengchin, A. Khan, and A. M. Asiri. 2020. Characterization of a novel natural cellulosic fiber from Calotropis gigantea fruit bunch for ecofriendly polymer composites. International Journal of Biological Macromolecules 150:793–801. doi:10.1016/j.ijbiomac.2020.02.134.
- Novais, R. M., G. Ascensao, D. M. Tobaldi, M. P. Seabra, and J. A. Labrincha. 2018. Biomass fly ash geopolymer monoliths for effective methylene blue removal from wastewaters. Journal of Cleaner Production 171:783–94. doi:10.1016/j.jclepro.2017.10.078.
- Pang, X., L. Sellaoui, D. Franco, G. L. Dotto, J. Georgin, A. Bajahzar, H. Belmabrouk, A. B. Lamine, A. Bonilla-Petriciolet, and Z. Li. 2019. Adsorption of crystal violet on biomasses from pecan nutshell, para chestnut husk, araucaria bark and palm cactus: Experimental study and theoretical modeling via monolayer and double layer statistical physics models. Chemical Engineering Journal 378:122101. doi:10.1016/j.cej.2019.122101.
- Pang, X., L. Sellaoui, D. Franco, M. S. Netto, J. Georgin, G. L. Dotto, M. K. A. Shayeb, H. Belmabrouk, A. Bonilla-Petriciolet, and Z. Li. 2020. Preparation and characterization of a novel mountain soursop seeds powder adsorbent and its application for the removal of crystal violet and methylene blue from aqueous solutions. Chemical Engineering Journal 391:123617. doi:10.1016/j.cej.2019.123617.
- Raja, K., B. Prabu, P. Ganeshan, V. Chandra Sekar, and B. NagarajaGanesh. 2021. Characterization studies of natural cellulosic fibers extracted from shwetark stem. Journal of Natural Fibers 18 (11):1934–45. doi:10.1080/15440478.2019.1710650.
- Ramesh, G., K. Subramanian, S. Sathiyamurthy, and M. Prakash. 2020. Calotropis Gigantea fiber-epoxy composites: Influence of fiber orientation on mechanical properties and thermal behavior. Journal of Natural Fibers 19 (10):1–13. doi:10.1080/15440478.2020.1848718.
- Reddy, K. O., C. U. Maheswari, M. Dhlamini, B. Mothudi, J. Zhang, J. Zhang, R. Nagarajan, and A. V. Rajulu. 2017. Preparation and characterization of regenerated cellulose films using borassus fruit fibers and an ionic liquid. Carbohydrate Polymers 160:203–11. doi:10.1016/j.carbpol.2016.12.051.
- Sellaoui, L., D. Franco, H. Ghalla, J. Georgin, M. S. Netto, G. L. Dotto, A. Bonilla-Petriciolet, H. Belmabrouk, and A. Bajahzar. 2020. Insights of the adsorption mechanism of methylene blue on Brazilian berries seeds: Experiments, phenomenological modelling and DFT calculations. Chemical Engineering Journal 394:125011. doi:10.1016/j.cej.2020.125011.
- Uddin, M. T., M. A. Islam, S. Mahmud, and M. Rukanuzzaman. 2009. Adsorptive removal of methylene blue by tea waste. Journal of Hazardous Materials 164 (1):53–60. doi:10.1016/j.jhazmat.2008.07.131.
- Zhang, L., L. Sellaoui, D. Franco, G. L. Dotto, A. Bajahzar, H. Belmabrouk, A. Bonilla-Petriciolet, M. L. Oliveira, and Z. Li. 2020. Adsorption of dyes brilliant blue, sunset yellow and tartrazine from aqueous solution on chitosan: Analytical interpretation via multilayer statistical physics model. Chemical Engineering Journal 382:122952. doi:10.1016/j.cej.2019.122952.
- Zheng, Y., E. Cao, Y. Zhu, A. Wang, and H. Hu. 2016. Perfluorosilane treated Calotropis gigantea fiber: Instant hydrophobic–oleophilic surface with efficient oil-absorbing performance. Chemical Engineering Journal 295:477–83. doi:10.1016/j.cej.2016.03.074.