
ABSTRACT
In this study, the flax (Linum usitatissimum L.) genes associated with resistance to the disease pasmo (Septoria linicola (Speg.) Garassini) were mapped using genome resequencing and bulked segregant analysis (BSA) of genomic DNA of the pasmo-resistant parent y62–9, pasmo-susceptible parent y64–5, and F2 generation segregants. Pasmo resistance genes were identified using Gene Ontology (GO) functional prediction and gene annotation methods. A Kyoto Encyclopedia of Genes and Genomes (KEGG) analysis revealed the biological information and molecular mechanisms associated with the flax-pathogen interaction. The results of a quantitative real-time PCR analysis revealed that the levels of expression of the three genes Lus10003106, Lus10022077, and Lus10021999 differed between the y62–9 (pasmo-resistant) and y64–5 (pasmo-susceptible) parental flax lines after the inoculation of plants with the pasmo pathogen. Thus, these genes may play key roles in the resistance of flax to pasmo. The results of this study provide a foundation to support future studies of the pathogenesis of flax disease and the discovery and cloning of resistance genes and development of new molecular markers toward the development of pasmo-resistant flax varieties.
摘要
在这项研究中,使用基因组重测序和对抗pasmo亲本y62-9、pasmo易感亲本y64-5和F2代片段的基因组DNA的大片段分析(BSA),绘制了与抗pasmo(Septoria linicola(Speg.)Garassini)疾病相关的亚麻(Linum usitatissimum L.)基因. 使用基因本体(GO)功能预测和基因注释方法鉴定Pasmo抗性基因. 《京都基因和基因组百科全书》(KEGG)分析揭示了与亚麻病原体相互作用相关的生物学信息和分子机制. 定量实时PCR分析的结果显示,在用pasmo病原体接种植物后,三个基因Lus10003106、Lus100022077和Lus100021999的表达水平在y62-9(pasmo抗性)和y64-5(pasmo易感)亲本亚麻系之间存在差异. 因此,这些基因可能在亚麻对pasmo的抗性中发挥关键作用. 本研究的结果为支持未来亚麻病害发病机制的研究、抗性基因的发现和克隆以及开发新的分子标记以开发抗pasmo的亚麻品种提供了基础.
Introduction
Flax (Linum usitatissimum L.) is an important fiber crop with key roles in many industries, including textiles, papermaking, building materials, food, and energy. Flax pasmo, also known as spot disease or spot blight, is caused by the fungus Septoria linicola (Speg.) Garassini, a disease that is primarily transmitted by flaxseed contaminated with spores of the pathogen. This disease primarily causes damage to the plant fibers, including weakness and tearing, and it can seriously reduce flax yields with light infestations, while severe infections can totally decimate the yield. The pathogen can infect all parts of the flax plant, including the cotyledon, true leaves, stems, flower buds, ovaries, and capsules, causing abscission of flowers and buds, and in particular, branches and stalks that were seriously damaged. Survey results have shown a rate of pasmo incidence of 10%–30% in Heilongjiang and Yunnan Provinces in recent years. More than 80% of the plants in plots with serious infestations exhibited disease spots during the harvest period, with such infestations leading to dramatic reductions in the yield of flax (Yang Citation2004).
In recent years, high-throughput genome resequencing technology has been successfully applied to numerous plant research projects involving genetic map construction, disease resistance gene mapping, and molecular marker development. For example, rice (Oryza sativa L.) (Qiu et al. Citation2017; Takagi et al. Citation2013), soybean (Glycine max L.) (Schmutz et al. Citation2010; Qi et al. Citation2014; Zhang et al. Citation2016; Zhou et al. Citation2015), tomato (Solanum lycopersicon L.) (Lin et al. Citation2014; Zhang Citation2020). Several single nucleotide polymorphism (SNP) sites have been found in Linum species, including flax. Fu and Peterson (Citation2012) applied a next-generation sequencing (NGS) technique in combination with genomic reduction and advanced bioinformatics tools to identify contigs and detect SNPs in multiple genome sequences obtained from the individuals of two Linum species. Their research resulted in the detection of 211 new SNPs and 19 new InDels. In another study, Illumina platform-based sequencing of the reduced representation libraries of eight flax genotypes achieved sequence coverage ranging from 4.33 to 15.64× (genome equivalents) that led to the detection of 55,465 SNPs. Approximately 84% of the SNPs were associated with a single genotype, while 13% were shared by any two genotypes and the remaining 3% were shared by three or more genotypes (Kumar, You, and Cloutier Citation2012). Moreover, a genome-wide association study (GWAS) was conducted using a set of 260 lines derived from three different bi-parental flax mapping populations. Ultimately, 17288 SNPs were identified that accounted for >80% of the phenotypic variation of flax traits that included days to maturity, iodine value, palmitic, stearic, and linoleic and linolenic acid contents (You et al. Citation2018).
To date, the mechanisms that underlie resistance to pasmo appear to be complex and are still unclear, which impedes progress toward the breeding of pasmo-resistant flax. Clarification of the molecular mechanisms involved in the pasmo-flax interaction and the identification of flax genes with functional roles in disease resistance will be needed to improve the resistance to flax disease. Toward this goal, the genomes of pasmo-resistant and pasmo-susceptible flax parental lines and F2 generation offspring were re-sequenced using high-throughput sequencing technology followed by data annotation and analysis. The purpose of this study was two-fold: 1) To map the elementary resistance genes of pasmo-resistant flax varieties and identify putative genes that encode pasmo resistance; and 2) To utilize real-time fluorescent quantitative PCR to determine the patterns of expression of putative flax genes that exhibit resistance to pasmo induced by the inoculation of plants with pasmo. The results of this study should provide a theoretical basis to support future investigations of flax mechanisms to provide resistance to pasmo disease.
Materials and methods
Experimental materials and population construction
F1 seeds were obtained by crossing the pasmo-resistant female parental line y62–9 with the susceptible male parental line y64–5. The F2 population was obtained by the selfing of F1 plants. Using the BSA method, 25 pasmo-resistant individuals and 25 pasmo-susceptible individuals were selected from the F2 population according to their phenotype. Equivalent amounts of DNA preparations from individual resistant plants were mixed to establish a resistant pool (r-pool). A susceptible pool (s-pool) was concurrently generated from individual susceptible plants.
The severity of the disease was graded as follows (Chen et al. Citation2019): Grade 0: non-susceptible, healthy plant; Grade 1: spot marks on the stems and inflorescences; Grade 2: obviously five 0.5 cm spots on the stem and inflorescence, and the spots do not occupy the periphery of the stem; Grade 3: more than five spots that exceed 0.5 cm or a spot full of the whole stem; Grade 4: a large number of spots on the stem and inflorescence that merge together and are completely covered by conidia, the stem browned, and it is brittle with the inflorescence. Based on the disease index (DI), the classification criteria of population disease resistance in the population was as follows: Immune (I): DI = 0; Resistant (R): 0 ≤ 30; Moderately susceptible (MS): 30<DI ≤ 50; Susceptible (S): 50<DI ≤ 75; Highly susceptible (HS): DI > 75.New paragraph: use this style when you need to begin a new paragraph.
DNA extraction and resequencing
The genomic DNA of leaves was extracted using the CTAB method. A Qubit Fluorometer (Thermo Fisher Scientific, Waltham, MA, USA) was used to measure the sample concentrations. The sample integrity was assessed using 1% agarose gel electrophoresis. A second-generation sequencing system (Illumina HiSeq 2000 [San Diego, CA, USA]) was used to sequence the genomic DNA of parental lines and F2 generation pooled (r-pool and s-pool) DNA preparations. Sequencing and data analysis were conducted by the Beijing Genomics Institute (BGI, Beijing, China). All the sequence data were compared to the reference genome available online at https://phytozome.jgi.doe.gov/pz/portal.html#!info?alias=Org_Lusitatissimum.
SNP detection
The Genome Analysis Toolkit (GATK) (https://www.broadinstitute.org/gatk/) (realntimes = 1) was used to detect individual SNPs. The following parameters were used to ensure the accuracy of SNP identification: (1) a ratio of variation confidence to quality depth ≥2; (2) Fisher’s exact test was used to calculate the Phred-scaled p value to detect strand bias and quantify the level of bias between the reference allele and alternate alleles based on forward and reverse strand sequence bias, with acceptable p values set to ≤60; (3) Root mean square (RMS) comparison quality value of ≥40; (4) a ratio of the Z-score of nonparametric test of variation and rank sum test results to the reads quality value of ≥-12.5; and (5) a ratio of the Z-score of nonparametric test of variation and rank sum test to the reads position deviation of ≥-8.0. Based on the final set of high-quality sequences, i.e., all the base information within samples obtained after alignment, polymorphic sites among the parental and F2 genotypes and the reference flax genome sequence were filtered to obtain a highly reliable SNP dataset. Based on the annotation information for the reference flax genome, the SNPs of flax sequences obtained in this study were annotated and counted using Byte-Granularity Isolation (BGI) software.
Screening of the heterozygous SNPs of parents
Based on the final set of high-quality sequences, the genomic variant call format (GVCF) files of the sequences of parental and mixed pools of F2 offspring were integrated. To remove background noise and other non-trait-related genomic site variations, genotyping was conducted on the SNP loci of parental genomic sequences using the following criteria: 1) A sequence quality value of ≥20; 2) Total sequence depth at each locus of ≥7; 3) Loci that contained ”-” (i.e., a deletion) in the parental sequences were filtered out; 4) Loci with sequence differences and homozygous SNPs between the two parents (based on parental genotype files) were screened out; and 5) Loci with offspring frequency values <0.3 were filtered out. The SNP index values of the pasmo-resistance phenotype-based mixed F2 DNA pooled samples (r-pool and s-pool) were calculated as the ratio of the read depth of the non-reference genotype to the total read depth of the marker site. After the index values of the two mixed pools were obtained, the overall difference between the SNP indices of the two pools was determined to obtain the delta index.
Detection and annotation of candidate regions related to extreme phenotypes
Using the results of these analyses, mutation sites within regions that contained pasmo resistance genes were extracted and mapped using sequence information associated with the corresponding scaffold. Each gene that contained a detected mutated site was extracted and annotated using Gene Ontology (GO) and the Kyoto Encyclopedia of Genes and Genomes (KEGG) analytical tools.
Quantitative real-time PCR (qRT‑PCR) analysis to identify the genes related to disease resistance
To verify the reliability of resequencing data and SNP detection results, three genes (Lus10003106, Lus10022077, and Lus10021999) that were previously shown to be associated with resistance to flax pasmo disease were validated using quantitative real-time PCR (qRT-PCR). Total RNA was extracted from the leaves of infected pasmo-resistant variety y62–9 and pasmo-susceptible variety y64–5 at the following stages: emergence stage, fir-like stage, fast growing stage, bud stage, flowering stage, and early yellow stage, as well as the leaves of uninfected control plants of both parental varieties at the seedling stage. Four pairs of gene-specific primers (three candidate pasmo-resistance genes and one actin gene) were designed using Primer Express software. First-strand cDNA synthesis and qRT-PCR were conducted using a PrimeScript™ RT reagent Kit with gDNA Eraser (TaKaRa, Dalian, China), SYBR Premix Ex Taq™ II (Tli RNaseH Plus) and ROX plus (TaKaRa). The thermal cycling conditions included one cycle of 95°C for 30 s followed by 40 cycles of 5 s at 95°C and 40 s at 60°C. The primers are listed as follows: Lus10003106-F, TGTCCTCATTACCTTGGGAG; Lus10003106-R, GAATCTTGCGGTATTCGGAG; Lus10022077-F, GGCTGGATTAGTTGTCAAGG; Lus10022077-R, CCGTTAAATCAGTCAGCGAA; Lus10021999-F, TGTCACCCAATAGAAGACCA; Lus10021999-R, GCCAGTATTGCTCAAGAGAG; actin-F, GGTGTTATGGTTGGAATGGGTC; actin-R, CCTCAGTGAGAAGTACAGGGTG. All the reactions were performed in triplicate, including the non-template control reactions. The relative levels of expression were calculated as 2−△△CT (Zhong et al. Citation2011).
Statistical analysis of experimental data
All data were analyzed using SPSS 20.0 software, and values were expressed as the means ± standard errors of three independent samples. Significant differences (p < .05) were analyzed using a one-way analysis of variance (ANOVA) and Duncan’s multiple range test.
Results
Summary of sequencing data and SNP
In this study, 143.18 M, 143.17 M, 143.50 M, and 142.63 M reads were obtained from the sequencing of resistant parental DNA, susceptible parental DNA and F2 mixed pools for offspring with pasmo resistant (r-pool) and susceptible (s-pool) phenotypic traits, respectively (). All the sequences obtained here were compared with the reference genome sequence, and the results are shown in .
Table 1. Statistical analysis of sequencing output data.
Table 2. Comparison results.
SNP detection
Based on the high-quality aligned sequences, i.e., all the base information of the sample sequences obtained after alignment, the polymorphic sites detected between the parental and F2 genotypes and the reference sequence were filtered to obtain a highly reliable SNP dataset. Based on annotation information for the reference genome, the SNPs detected were annotated and counted using customized BGI software with the results shown in .
Table 3. Statistics of SNP and annotation.
BSA analysis
Screening of heterozygous SNPs of parental line genomic DNA sequences
The sequences derived from the two parental flax-line genomes were compared and analyzed and the differences among the sequences were arranged according to their chromosomal location. The resulting distribution data for all the SNPs among all 15 chromosomes were analyzed statistically, and the results of this analysis are shown in . The analysis indicated that for all 15 chromosomes, the highest number of SNPs (as detected from comparisons of pasmo-resistant and pasmo-susceptible parental genomes) that were mapped to a single chromosome was 63,454 SNPs on chromosome 4, while there were relatively few SNPs on chromosome 15 (only 122). Designations of Chr new1 to Chr new15 were used in the table to represent chromosomes 1 to 15, respectively.
Table 4. Statistics of homozygous and different sites between parents.
Gene frequency analysis of the two F2 BSA pools
The delta index region outside the 95% confidence curve for each chromosome was screened to identify regions that contained mutations related to disease resistance. The results indicated that the genomic regions associated with phenotypic disease resistance, which were distributed on chromosomes 1, 6 and 13, had lengths of 19–20 cM, 19–20 cM, and 2–3 cM, respectively.
Detection and annotation of the candidate regions related to extreme phenotypes
According to the results of these analyses, the genes that harbor different mutations between pasmo-resistant and pasmo-susceptible flax lines (as revealed by sequence comparisons) were extracted, and gene localization information within the associated scaffold sequence assembly was retained. Next, the identified genes were annotated using GO and KEGG analyses.
GO functional classification analysis
The use of a GO database analysis indicated that annotation of the 65 genes that harbored mutations between pasmo-resistant and susceptible lines led to their functional assignments to 16 distinct functional subclasses. Of this set of 65 genes, 23 were assigned to six subclasses within the category biological process, with the highest proportions of genes functionally assigned to two subclasses, cellular process and metabolic process, which accounted for 12.31% and 10.77% of the total set of genes, respectively. A total of 15 genes were assigned to seven subclasses within the cellular component category, with the largest proportion of the total number of genes (4.62%) assigned to the subclass of cells, cellular components, and membranes. A total of 27 genes were assigned to three subclasses of the molecular function category, with the highest proportions of genes of 21.54% and 18.46% assigned to the subclasses of catalysis and binding, respectively (). Further GO enrichment analysis of the set of 65 genes was conducted with the results shown in . Although the genes were functionally assigned to biological process, cell component, and molecular function categories, a significantly greater number of molecular function subclasses were represented, including metal ion binding, protein kinase activity, ion transport, and protein serine-threonine kinase activity.
Figure 1. GO enrichment analysis results.
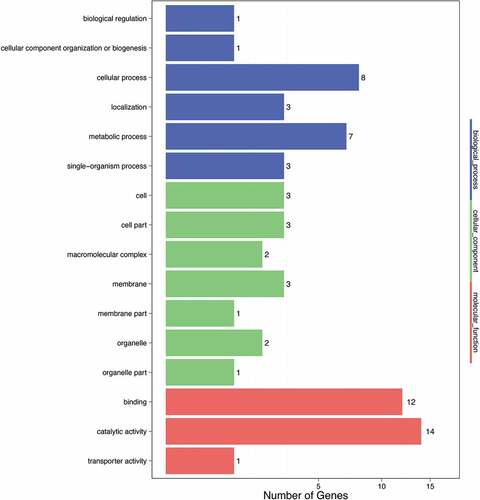
Table 5. Gene Ontology term of the genes of the mutation site.
Enrichment analysis of the KEGG pathways
The results of a KEGG annotation analysis of the genes with differentially mutated sites between pasmo-resistant and pasmo-susceptible flax lines are shown in . The KEGG pathway terms fell within five categories. The first category of cellular process was represented by only one pathway, transport and catabolism. The second category of environmental information processing was represented by one pathway, signal transduction. The third category of genetic information processing was represented by four pathways with folding, sequencing and degradation the most abundant pathway. The fourth category of metabolism was represented by 11 pathways, with global and overview maps the most highly represented pathway. The fifth category of organic system was represented by only one pathway, the ecological adaptation pathway. Further metabolic pathway analysis (shown in ) suggested that the genes related to disease resistance could be associated with metabolic pathways, particularly the plant-pathogen interaction pathway and pathways associated with endogenous hormone metabolism in plants, such as the tryptophan metabolism pathway related to the auxin indole acetic acid (IAA). Simultaneously, many pathways related to amino acid metabolism were identified, including the biosynthetic pathway metabolism of amino acids glycine, serine, and threonine metabolism.
Figure 2. Enrichment analysis results of pathway.
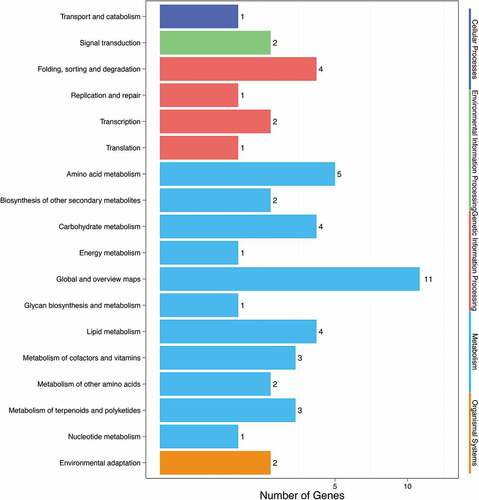
Table 6. Analysis of KEGG pathway of differential sites gene.
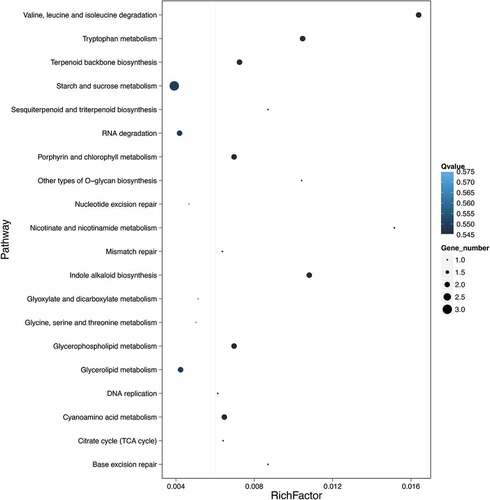
The results of KEGG enrichment analysis are also graphically displayed as shown in . Only the top 20 pathways are shown in this figure, which are ranked in the order of enrichment from top to bottom as follows: Valine, leucine and isoleucine degradation, Tryptophan metabolism, Terpenoid backbone biosynthesis, Starch and sucrose metabolism, Sesquiterpenoid and triterpenoid biosynthesis, RNA degradation, Porphyrin and chlorophyll metabolism, Other types of O-glycan biosynthesis, Nucleotide excision repair, Nicotinate and nicotinamide metabolism, Mismatch repair, Indole alkaloid biosynthesis, Glyoxylate and dicarboxylate metabolism, Glycine, serine and threonine metabolism, Glycerophospholipid metabolism, Glycerolipid metabolism, DNA replication, Cyanoamino acid metabolism, Citrate cycle (TCA cycle), and Base excision repair.
Figure 3. The top 20 pathways with the largest number of enrichment.
qRT-PCR analysis of the genes related to disease resistance
To verify the reliability of resequencing data and SNP detection results, three genes with different functions were selected from the acquired set of pasmo disease resistance-related genes, and their patterns of expression at different time points after pasmo inoculation were analyzed using qRT-PCR.
The results revealed that the level of expression of Lus10003106 varied at different time points after inoculation. The relative levels of expression of this gene in the resistant and susceptible plants were higher than the corresponding control levels from the emergence stage to the fir-like stage, but the extent of upregulation observed in the resistant plants was higher than that observed in the susceptible plants. At the bud stage, the relative levels of expression in the resistant and susceptible plants were lower than the corresponding control levels, while the degree of downregulation in the susceptible plants was greater than that of the resistant plants. At the early yellow stage, the relative levels of expression of this gene in resistant and susceptible plants were higher than the corresponding control level, with the degree of upregulation of this gene in susceptible plants significantly greater than that of the resistant plants. Over the entire growth period, the relative levels of expression of Lus10003106 in the susceptible plants was higher than that of the resistant plants, with a greater relative level of expression of Lus10003106 observed in susceptible plants as compared with that observed in resistant plants. However, during the early growth period, the relative levels of expression of Lus10003106 in the resistant plants exceeded the corresponding levels in susceptible plants, thus, indicating that the level of expression of Lus10003106 was upregulated after induction by exposure to the pathogen ( (A)).
Figure 4. Expression levels of the candidate genes in leaf of flax after pasmo inoculation (A) represents Lus10003106, (B) represents Lus10022077, (C) represents Lus10021999.
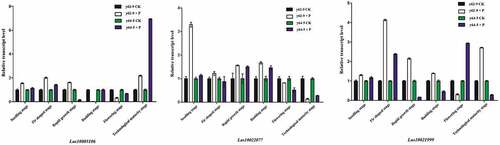
For the gene Lus10022077, the relative levels of expression in the resistant flax plants after pathogen infection were higher than the corresponding control levels from the emergence stage to the bud stage, while the relative levels of expression in susceptible flax plants were higher than the corresponding control levels during the emergence stage, fast growing stage, and bud stage. Importantly, the upregulation of expression of this gene in resistant flax plants at the emergence stage was significantly greater than its upregulation in susceptible flax plants, indicating that the upregulation of Lus10022077 was induced by pathogen exposure. Moreover, throughout the entire growth period, the levels of expression of Lus10022077 in resistant plants exceeded the corresponding levels in susceptible plants, thus, suggesting that Lus10022077 should be considered a candidate gene to control the flax resistance of flax to pasmo ( (B)).
For the gene Lus10021999, the relative levels of expression in resistant plants exceeded the corresponding levels in control plants at all stages except for the flowering stage, while the relative levels of expression in susceptible plants only exceeded the corresponding levels in control plants during the emergence stage, fir-like stage, and flowering stage. The relative level of expression of Lus10021999 in the resistant plants was significantly higher than its level in the susceptible plants during the early growth stage, indicating that the expression of Lus10021999 was upregulated after the exposure of plants to the pathogen. Therefore, Lus10021999 should be considered a candidate gene to control the resistance of flax to pasmo ( (C)).
Discussion
Pasmo disease is a serious fungal disease of flax that can substantially reduce crop yields. Pasmo outbreaks have been difficult to control, since no ideal control agent has yet been developed. The cultivation of resistant flax varieties has proven to be the most economical and effective method for achieving partial control, and the cultivation of resistant flax varieties by genetic engineering is the inevitable trend of breeding development. Currently, few flax disease resistance genes have been applied to genetic engineering technology and breeding. Research on the genes for disease resistance primarily involves resistance to pathogens, such as flax wilt and rust (Boba et al. Citation2011; Kostyn et al. Citation2012; Lorenc-Kukula et al. Citation2007; Wróbel-Kwiatkowska et al. Citation2004). The research conducted on flax pasmo primarily focused on the study of disease occurrence (Halley et al. Citation2004), screening of disease-resistant germplasm (Chen et al. Citation2019; Rashid Citation2012), integrated control technology (Yang Citation2004), and the impact of fungicides and nitrogen fertilizers on the disease (Grant et al. Citation2016; Islam et al. Citation2021; Vera et al. Citation2014). Molecular biology research on pasmo was conducted by He et al. (Citation2019a), who evaluated the accuracy of genomic prediction using a diverse worldwide core collection of 370 accessions to improve the efficiency of breeding for pasmo resistance. Furthermore, He et al. (Citation2019b) conducted GWAS on 370 materials from flax core germplasm to identify the genetic regions associated with pasmo resistance. Taken together, the results of previous studies have led to identification and verification of numerous SNP markers from Linum species SNP that have been used for genetic diversity analysis, population structure analysis, phylogeny, genetic map construction, quantitative trait locus (QTL) mapping and genome-wide association analysis. Nevertheless, few studies in flax have been reported that utilized a combination of NGS and genome resequencing technologies to discover SNP sites with relevance to disease resistance in flax. Moreover, there is no clear report on the cloning and identification of pasmo-resistant genes. Therefore, study on the mechanisms of flax resistance to pasmo will provide an important working basis and theoretical basis for cultivating disease-resistant varieties by genetic engineering.
With regard to plant pathogen resistance, pathogenesis-related proteins (PRs) are low molecular weight proteins produced by pathogen-infected plants or plants exposed to abiotic stressors or hormone stimulation. PRs play important roles in plant defense systems, including frequent downstream roles in plant resistance to diseases or stress (Dou et al. Citation2014). To date, PR genes have been found in Arabidopsis thaliana (Laird et al. Citation2004), potato (Solanum tuberosum L.) (), rice (Mcgee, Hamer, and Hodges Citation2001), tomato (Chun and Chandrasekaran Citation2019) and ginseng (Panax ginseng Meyer) (Wang et al. Citation2019). The gene Lus10003106 obtained in this study is a gene for the PR protein acyl hydrolase. Thus, Lus10003106 should be considered to be a candidate gene to control flax resistance to pasmo. Biotin, another important factor in plant resistance, is an important water-soluble vitamin that contains sulfur (VH) and is widely distributed in plants and microorganisms. As a cofactor of enzymes that catalyze carboxylation, decarboxylation, and dehydrogenation reactions, VH is essential for the metabolism of carbohydrates, lipids, proteins, and nucleic acids (Nikolau, Ohlrogge, and Wurtele Citation2003). In this study, the gene for an enzyme that depended on biotin, Lus10022077, was obtained. Additional participants in the plant resistance to pathogens are transcription factors (TFs). They are protein molecules that can bind to specific DNA sequences within eukaryotic promoters to activate or inhibit gene transcription and regulate gene expression (Jiang et al. Citation2017). WRKY, AP2/ERF, MYB, MYC, NAC, and GRAS are the primary TFs involved in plant defense responses, with WRKY known to regulate key genes in the signaling pathways for disease resistance. Numerous studies have shown that WRKY TFs play important roles in the responses of plants to biological stresses (Shen et al. Citation2007; Yu, Chen, and Chen Citation2001; Zhou et al. Citation2018). The gene Lus10021999 obtained in this study was WRKY39, a transcription factor.
In this study, the levels of expression of Lus10003106, Lus10022077, and Lus10021999 genes changed in both the resistant and susceptible parental flax plants after inoculation with the pasmo pathogen, thus, indicating that these genes are associated with pasmo resistance and may be key genes that are involved in the resistance of flax to pasmo. Our future research will endeavor to verify the function of these candidate genes and analyze the roles of genes in the resistance of flax to pasmo.
Conclusions
Lus10003106, Lus10022077, and Lus10021999 genes could be related to the resistance of flax to pasmo. This study provides a foundation that can be used to support future efforts to conduct fine gene mapping and molecular marker-assisted selective breeding in flax, as well as cloning and other applications associated with improved plant breeding practices.
Highlights
Genes related to pasmo resistance are located on chromosomes 1, 6 and 13 within map regions of 19–20 cM, 19–20 cM and 2–3 cM, respectively.
Pasmo resistance genes were identified using GO functional prediction and gene annotation methods. KEGG analysis revealed biological information and molecular mechanisms associated with the flax–pathogen interaction.
Three genes, Lus10003106, Lus10022077 and Lus10021999, may play key roles in flax resistance to pasmo.
Supplemental Material
Download Zip (10.8 KB)Acknowledgments
This study was supported by the Heilongjiang Academy of Agricultural Sciences Foundation (2020YYYF006, 2020FJZX032), Agricultural Science and Technology Innovation Spanning Project of Heilongjiang Academy of Agricultural Sciences (HNK2019CX09), National Natural Science Foundation of China (31701480) and National bast fiber research system of China (CARS-19-S6). This study was carried out on the Northeast Flax Scientific Observation Experimental Station of Ministry of Agriculture and Flax Branch of the National Bast Fiber Germplasm Improvement Center.
Supplementary material
Supplemental data for this article can be accessed online at https://doi.org/10.1080/15440478.2022.2163331
Disclosure statement
No potential conflict of interest was reported by the authors.
References
- Boba, A., A. Kulma, K. Kostyn, M. Starzycki, E. Starzycka, and J. Szopa. 2011. The influence of carotenoid biosynthesis modification on the Fusarium culmorum and Fusarium oxysporum resistance in flax. Physiological and Molecular Plant Pathology 76 (1):39–15. doi:10.1016/j.pmpp.2011.06.002.
- Chen, S., X. Yang, X. K. Yang, H. M. Yuan, W. G. Huang, Y. Liu, Y. B. Yao, and G. W. Wu. 2019. Screening pasmo-resistant germplasm resources from flax varieties. Crops 1:63–67. doi:10.16035/j.issn.1001-7283.2019.01.010.
- Chun, S. C., and M. Chandrasekaran. 2019. Chitosan and chitosan nanoparticles induced expression of pathogenesis-related proteins genes enhances biotic stress tolerance in tomato. International Journal of Biological Macromolecules 125:948–54. doi:10.1016/j.ijbiomac.2018.12.167.
- Dou, S. J., M. L. Guan, L. Y. Li, and G. Z. Liu. 2014. 水稻的病程相关基因. Chinese Science Bulletin 59 (3):245–58. doi:10.1360/972012-1831.
- Fu, Y. B., and G. W. Peterson. 2012. Developing genomic resources in two Linum species via 454 pyrosequencing and genomic reduction. Molecular Ecology Resources 12 (3):492–500. doi:10.1111/j.1755-0998.2011.03100.x.
- Grant, C. A., D. McLaren, R. B. Irvine, and S. D. Duguid. 2016. Nitrogen source and placement effects on stand density, pasmo severity, seed yield, and quality of no-till flax. Canadian Journal of Plant Science 96 (1):34–47. doi:10.1139/cjps-2014-0425.
- Halley, S., C. A. Bradley, J. R. Lukach, and M. McMullen, J. J. Knodel, G. J. Endres, and T. Gregoire. 2004. Distribution and severity of pasmo on flax in North Dakota and evaluation of fungicides and cultivars for management. Plant Disease 88 (10):1123–26. doi:10.1094/PDIS.2004.88.10.1123.
- He, L. Q., J. Xiao, K. Y. Rashid, G. F. Jia, P. C. Li, Z. Yao, X. Wang, S. Cloutier, and F. M. You. 2019a. Evaluation of genomic prediction for pasmo resistance in flax. International Journal of Molecular Sciences 20 (2):359. doi:10.3390/ijms20020359.
- He, L. Q., J. Xiao, K. Y. Rashid, Z. Yao, P. C. Li, G. F. Jia, X. Wang, S. Cloutier, and F. M. You. 2019b. Genome-Wide association studies for pasmo resistance in flax (Linum Usitatissimum L.). Frontiers in plant science 9:1982. doi:10.3389/fpls.2018.01982.
- Islam, T., C. Vera, J. Slaski, R. Mohr, K. Y. Rashid, H. Booker, and H. R. Kutcher. 2021. Fungicide Management of Pasmo Disease of Flax and Sensitivity of Septoria linicola to Pyraclostrobin and Fluxapyroxad. Plant Disease 105 (6):1677–84. doi:10.1094/PDIS-06-20-1175-RE.
- Jiang, J. J., S. H. Ma, N. H. Ye, M. Jiang, J. S. Cao, and J. H. Zhang. 2017. WRKY transcription factors in plant responses to stresses. Journal of Integrative Plant Biology 59 (2):86–101. doi:10.1111/jipb.12513.
- Kostyn, K., M. Czemplik, A. Kulma, M. Bortniczuk, J. Skala, and J. Szopa. 2012. Genes of phenylpropanoid pathway are activated in early response to Fusarium attack in flax plants. Plant Science 190 (1):103–15. doi:10.1016/j.plantsci.2012.03.011.
- Kumar, S., F. M. You, and S. Cloutier. 2012. Genome wide SNP discovery in flax through next generation sequencing of reduced representation libraries. BMC Genomics 13 (1):684. doi:10.1186/1471-2164-13-684.
- Laird, J., P. Armengaud, P. Giuntini, V. Laval, and J. J. Milner. 2004. Inappropriate annotation of a key defence marker in Arabidopsis: Will the real PR-1 please stand up? Planta 219 (6):1089–92. doi:10.1007/s00425-004-1355-x.
- Lin, T., G. T. Zhu, J. H. Zhang, X. Y. Xu, Q. H. Yu, Z. Zheng, Z. H. Zhang, Y. Y. Lun, S. Li, X. X. Wang, et al. 2014. Genomic analyses provide insights into the history of tomato breeding. Nature Genetics 46 (11):1220–26. CNKI:SUN:YCZZ.0.2014-12-016.
- Lorenc-Kukula, K., M. Wróbel-Kwiatkowska, M. Starzycki, and J. Szopa. 2007. Engineering flax with increased flavonoid content and thus Fusarium resistance. Physiological and Molecular Plant Pathology 70 (1–3):38–48. doi:10.1016/j.pmpp.2007.05.005.
- Mcgee, J. D., J. E. Hamer, and T. K. Hodges. 2001. Characterization of a PR-10 pathogenesis-related gene family induced in rice during infection with Magnaporthe grisea. Molecular Plant-Microbe Interactions 14 (7):877–86. doi:10.1094/MPMI.2001.14.7.877.
- Nikolau, B. J., J. B. Ohlrogge, and E. S. Wurtele. 2003. Plant biotin-containing carboxylases. Archives of Biochemistry and Biophysics 414 (2):211–22. doi:10.1016/S0003-9861(03)00156-5.
- Qi, X. P., M. W. Li, M. Xie, X. Liu, M. Ni, G. H. Shao, C. Song, A. K. Y. Yim, Y. Tao, F. L. Wong, et al. 2014. Identification of a novel salt tolerance gene in wild soybean by whole-genome sequencing. Nature Communications 5 (1):4340. doi:10.1038/ncomms5340.
- Qiu, J., Y. J. Zhou, L. F. Mao, C. Y. Ye, W. D. Wang, J. P. Zhang, Y. Y. Yu, F. Fei, Y. F. Wang, F. J. Qian, et al. 2017. Genomic variation associated with local adaptation of weedy rice during de-domestication. Nature communications 8 (1):15323. doi:10.1038/ncomms15323.
- Rashid, K. Y. 2012. Screening for resistance to pasmo (Septoria linicola) in flax[j]. Canadian Journal of Plant Pathology 34 (2):343.
- Schmutz, J., S. B. Cannon, S. Jessica, J. X. Ma, T. Mitros, W. Nelson, D. L. Hyten, Q. J. Song, J. J. Thelen, J. L. Cheng, et al. 2010. Genome sequence of the palaeopolyploid soybean. Nature 463 (7278):178–83. doi:10.1038/nature08670.
- Shen, Q. H., Y. Saijo, S. Mauch, C. Bicskup, S. Bieri, B. Keller, H. Seki, B. Ülker, I. E. Somssich, and P. Chulze-Lefert. 2007. Nuclear activity of MLA immune receptors links isolate-specific and basal disease-resistance responses. Science 315 (5815):1098–103. doi:10.1126/science.1136372.
- Takagi, H., A. Abe, K. Yoshida, S. Kosugi, S. Natsume, C. Mitsuoka, A. Uemura, H. Utsushi, M. Tamiru, S. Takuno, et al. 2013. QTL- seq: Rapid mapping of quantitative trait loci in rice by whole genome resequencing of DNA from two bulked populations. The Plant Journal 74 (1):174–83. doi:10.1111/tpj.12105.
- Vera, C. L., R. B. Irvine, S. Duguid, K. Y. Rashid, F. R. Clarke, and J. J. Slaski. 2014. Pasmo disease and lodging in flax as affected by pyraclostrobin fungicide, N fertility and year. Canadian Journal of Plant Science 94 (1):119–26. doi:10.4141/cjps2013-046.
- Wang, H. T., F. J. Xu, X. Q. Wang, W. S. Kwon, and D. C. Yang. 2019. Molecular discrimination of Panax ginseng cultivar K-1 using pathogenesis-related protein 5 gene. Journal of Ginseng Research 43 (3):482–87. doi:10.1016/j.jgr.2018.07.001.
- Wróbel-Kwiatkowska, M., K. Lorenc-Kukula, M. Starzycki, J. Oszmiański, E. Kepczyńska, and J. Szopa. 2004. Expression of β-1,3-glucanase in flax causes increased resistance to fungi. Physiological and Molecular Plant Pathology 65 (5):245–56. doi:10.1016/j.pmpp.2005.02.008.
- Yang, X. 2004. The study on occurrence characteristics and preventing technique of flax pasmo disease. Plant Fibers and Products 26 (4):170–72. doi:10.3969/j.issn.1002-2767.2007.05.023.
- You, F. M., J. Xiao, P. C. Li, Z. Yao, G. F. Jia, L. Q. He, S. Kumar, B. Soto-Cerda, S. D. Duguid, H. M. Booker, et al. 2018. Genome-wide association study and selection signatures detect genomic regions associated with seed yield and oil quality in ?ax. International Journal of Molecular Sciences. 19(8):2303. doi:10.20944/preprints201807.0397.v1.
- Yu, D., C. Chen, and Z. Chen. 2001. Evidence for an important role of WRKY DNA binding proteins in the regulation of NPR1 gene expression. The Plant Cell 13 (7):1527–40. doi:10.1105/TPC.010115.
- Zhang, D. Y. 2020. Mapping of Tomato Leaf Mold Resistance Gene Cf-16 and Analysis of Resistance Response Mechanism. Doctoral Dissertation of Northeast Agricultural University. doi:10.27010/d.cnki.gdbnu.2020.000012.
- Zhang, Y. W., W. Li, L. F. Zhang, C. J. Wang, H. Y. Dai, and R. Xu. 2016. Genome-wide variations of soybean cultivar Qihuang 34 by whole genome resequencing. Chinese Journal of Oil Crop Sciences 38 (2):150–58. doi:10.7505/j.issn.1007-9084.2016.02.003.
- Zhong, H. Y., J. W. Chen, C. Q. Li, L. Chen, J. Y. Wu, J. Y. Chen, W. J. Lu, and J. G. Li. 2011. Selection of reliable reliable reference genes for expression studies by reverse transcription quantitative real-time PCR in litchi under different experimental conditions. Plant cell reports 30 (4):641–53. doi:10.1007/s00299-010-0992-8.
- Zhou, Z. K., Y. Jiang, Z. Wang, Z. H. Gou, J. Lyu, W. Y. Li, Y. J. Yu, L. P. Shu, Y. J. Zhao, Y. M. Ma, et al. 2015. Resequencing 302 wild and cultivated accessions identifies genes related to domestication and improvement in soybean. Nature Biotechnology. 33(4):408–14. doi:10.1038/nbt.3096.
- Zhou, Q. Q., H. R. Qiu, X. W. He, X. P. Wang, X. X. Liu, B. H. Li, S. J. Wu, and X. S. Chen. 2018. Md WRKY40 mediated improvement of the immune resistance of apple and Arabidopsis thaliana to Botryosphaeria dothidea. Scientia Agricultura sinica 51 (21):4052–64. doi:10.3864/j.issn.0578-1752.2018.21.005.