
 ?Mathematical formulae have been encoded as MathML and are displayed in this HTML version using MathJax in order to improve their display. Uncheck the box to turn MathJax off. This feature requires Javascript. Click on a formula to zoom.
ABSTRACT
This paper presents the results of the first kenaf spinning attempt in Tunisia. Indeed, kenaf fibers are rigid and lack of cohesion that makes their spinning difficult and a challenge. So, this paper describes the possibility of spinning different blends of kenaf/cotton fibers using open end spinning machine. Five different blends of kenaf/cotton (M1:10/90, M2:20/80, M3:30/70, M4:40/60, and M5:50/50) were considered. The higher kenaf content in the blend make spinning process difficult and even impossible. The produced yarns were characterized to evaluate their mechanical properties and compare it to similar yarn performances. These blends gave different yarn counts varying from 41.86 to 69.16 tex, tenacity of 8.80 cN/tex to 10.07 cN/tex, while elongation at break of 7% to 8.93%. The results proves that kenaf/cotton 40/60 blend ratio presents the better mechanical properties and regularity with 8.80 cN/tex for tenacity and 7.68% for elongation with good regularity index Ireg = 1.25.
摘要
本文介绍了突尼斯首次尝试红麻纺纱的结果。事实上,红麻纤维是刚性的,缺乏内聚力,这使得它们的纺纱变得困难和困难. 因此,本文描述了使用开口纺纱机纺制红麻/棉纤维的不同共混物的可能性. 研究了五种不同的红麻/棉花混合物(M1:10/90、M2:20/80、M3:30/70、M4:40/60和M5:50/50). 混合料中较高的红麻含量使纺纱过程变得困难甚至不可能. 对生产的纱线进行了表征,以评估其机械性能,并将其与类似的纱线性能进行比较. 这些共混物的纱线支数从41.86至69.16 tex不等,韧性为8.80 cN/tex至10.07 cN/tex,断裂伸长率为7%至8.93%. 结果表明,红麻/棉40/60共混比具有较好的力学性能和规律性,韧性为8.80 cN/tex,伸长率为7.68%,规律性指数Ireg = 1.25.
Introduction
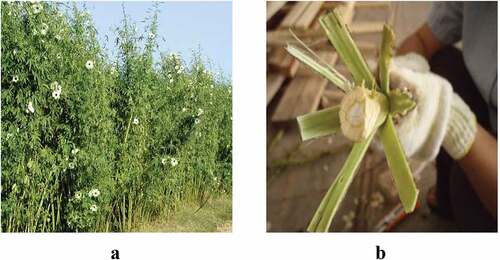
Kenaf is an annual crop known as Hibiscus Cannabinus L, which grows in all soils at all climatic conditions with minimal amount of water. Kenaf has a single, straight, and branchless stem from which two type of fibers can be produced: core fiber and bast fiber. Kenaf stem is made up of an inner woody core and an outer fibrous bark surrounding the core. The kenaf bast fiber are derived from the outer fibrous bark and they are extracted by separating the core from the fibrous outer layers.
Nowadays, these types of fibers are required for both technical and esthetic properties. They have the advantages of biodegradability, lightweight, low cost, and low environmental impact compared to synthetic fibers (Ahsan, Carron, and Mustafa Citation2019). In addition to that, Kenaf fibers have good antimicrobial and good absorbency that can be valorized in various textile applications (Ramakrishna et al. Citation2018Ramaswamy, Ruff, and Boyd Citation2016).
Currently, various research is interested on yarns and fabrics made by kenaf fibers and some of them include research on blending kenaf fibers with cotton. The fiber blend is generally used to improve the properties of yarn made by one of the fibers presents in the mixture or to give it more attractiveness. But the use of fiber with different properties such as: different length, different surface structure, crimps, etc. do not exhibit the same cohesive contact with each other and behave differently during their transformation process (Akin et al. Citation2016). Which lead to a difficulty in spinning flax fibers such as kenaf. As a result, these fibers are blended with other natural or man-made fibers, which will improve not only the spinability but also the properties of resultant blend (Ramakrishna et al. Citation2018).
In this context, this work is carried out in cooperation with a Tunisian cotton spinning company (SITEX) aiming to create a product with high added value to cope with the yarn high-cost production and create a competitive product. So, in this work, the results of the first attempt of spinning kenaf fibers in Tunisia using cotton spinning machines are presented. ()
Figure 1. A- Kenaf fiber, b- Kenaf stem.
Materials and method
Fiber extraction
Kenaf used in this study were cultivated in experimental field in Tunisia. The fibers used are mechanically extracted using a horizontal opener first and then a Shirley analyzer. The kenaf stem is passed perpendicularly to the rotation ax of the horizontal opener roll to separate the woody core and outer fibrous bark surrounding the core. The collected fibers need further operation to improve fiber separation, so a Shirley analyzer is used.
With reference to previous works (Bel-Berger et al. Citation1999; Zhang Citation2003), a softening treatment was found to be required. So, a textile softener was used under the mentioned conditions:
Treatment duration: 60 min
Temperature: 60°C
Concentration: 10 mL/L
This treatment aimed to ameliorate the compatibility in the cotton and kenaf blend.
Fiber characterization
The linear density was determined using the gravimetric method according to the standard NF G07–007.
Also, the mechanical properties were determined according to the NF G07–002, 50 tests were carried out to determine the maximum strength that a fiber can support and the corresponding strength and elongation.
Blend spinning
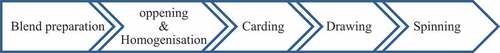
In this work, the cotton spinning process is adopted to spin the cotton/kenaf blend as shown in the ().
Figure 2. Spinning process.
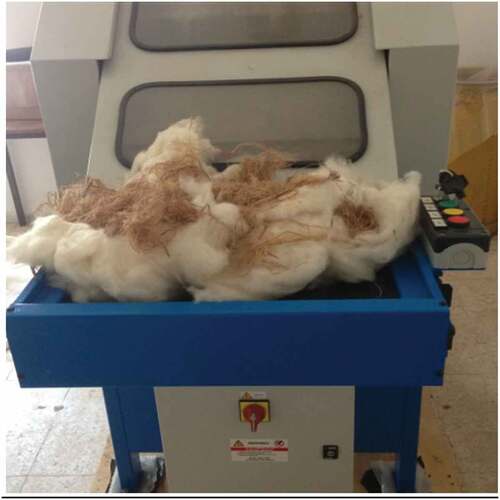
The softened fibers were blended with cotton in the ratio of 10%, 20%, 30%, 40%, and 50% using a cotton card. It is a mechanical process that cleans and mixes fibers to produce webs or sliver suitable for subsequent spinning operations () presents the state of the fiber blend at the entrance of the card). In this step, the lab carding machines were used. The blend was carded first to homogenize the fiber blend and then carded a second time to obtain a sliver.
Figure 3. The fibers at the card entrance.
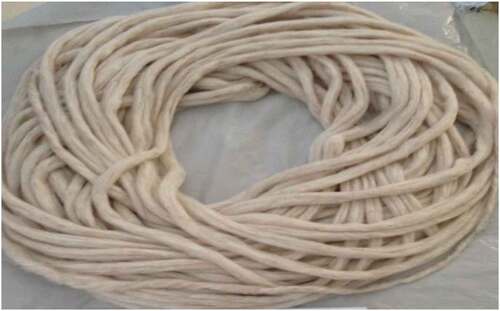
Drawing is the operation by which slivers are blended, doubled, and leveled. The drawing machine used in this step is available at the spinning laboratory of ISET Ksar Hellal. Several tests are carried out to fix the number of passages and the dubbing possible. () illustrates the slivers obtained after the step drawing (Dallel Citation2012).
Figure 4. Kenaf cotton silver.
The prepared slivers were used to make yarns using the open-end spinning technique. The used spinning machine is available at SITEX (Company of textile industry), Tunisia. This machine allows the control and adjustment of each spinning head in an individual and independent way. () resumes the setting machine used to produce yarn for each blend ratio and () presents the cotton/kenaf blend transformation.
Figure 5. Kenaf/Cotton blend transformation.
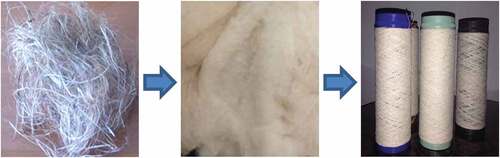
Table 1. Open-end setting machine.
Yarn characterization
Kenaf blend yarn was analyzed to compare the effect of kenaf blend ratio to the yarn’s properties.
The yarn count
The yarn count is an indispensable measurement to judge the quality of the yarn and to determine its uses. The yarn count is calculated using the standard NF EN 12,751 (AFNOR, November 1999).
Real composition determination
To determine the real composition of the yarns, we used a simple method of separating the kenaf and cotton fibers from the yarn and weighing them. Indeed, the separation of the fibers is done manually by the yarn detorsion to recuperate individual fibers and sort them to weigh them separately.
Mechanical properties
The yarn mechanical properties were determined according to the standard ISO 2062–1993. This step is essential to judge the quality of the yarn and to choose his destination and the other processes that can be applied on (weaving or knitting). The tensile test was carried out on a LLOYD dynamometer.
To compare the obtained results, the tenacity was calculated according to the formula presented below and it is the ratio of the maximum load and the count.
With: Fr: the maximum load (cN) and τ: tenacity (cN/tex)
The yarn regularity
Regularity is one of the most important parameters in yarn characterization. It describes the variation of the yarn thickness per unit length. It reveals the defects of the structure that depends on defects distribution which can affect the yarn appearance and properties.
The study of regularity is carried out on the multi-test Tomsic easy v1.4.2. The test conditions are as follows:
Speed: 25 m/min
Duration: 1 min
Thick: +50% (the threshold of increase of the mass in relation to the calculated average)
Thin: −50% (the threshold of decrease in mass compared to the calculated average)
Neps: +200% (the threshold of mass increase relative to mass
Results and conclusions
Fiber characterization
Fiber mechanically extracted and softened was characterized. Cotton and kenaf fiber properties are presented in ():
Table 2. Kenaf and cotton fiber properties.
Compared to cotton fibers, kenaf fibers have approximately the same tenacity but the cotton fibers are more flexible thanks to their low section diameter and high elongation. That’s why cotton fibers are used to increase cohesion in the blend to be able to spin the kenaf fibers.
Yarn characterization
Yarn produced were examined using Leica M50 optical microscope to observe the yarn structure. () illustrates the surface aspect of cotton kenaf yarns.
Figure 6. Yarn surface image for different blend ratio (˟10).
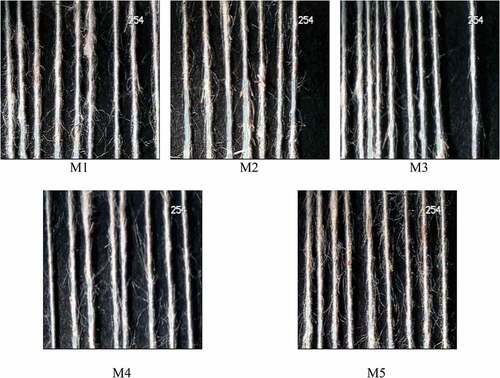
The images show that the yarn structure is compact with fewer fibers extending away from its surface. It is clear that when increasing the percentage of cotton fibers in the blend, the yarn pilosity increases this explained by the fact that cotton fibers are shorter than kenaf fibers that’s why they are not maintained on the yarn structure and the protruding ends hang freely outside the yarns.
A uniform section is observed, which is a characteristic of the open-end yarn. Also due to the poor degree of fibers parallelization, open-end yarns are voluminous.
Also, in the observed yarns, it was not very easy to identify cotton fibers and the fine kenaf fibers but the thick kenaf bundles could be seen very clearly. This indicates a good blending of the two kinds of fibers.
() shows the actual yarn composition. Indeed, there is a difference between the estimate percentage and the real composition. It is noted that the increase in the percentage of kenaf fibers in the mixture causes the increase in the fiber loss. This is due to the non-compatibility of the fiber and the machines used. The average fiber loss is about 3%. This is the total loss because there is no effective way of determining the fiber losses of kenaf and cotton separately but only evaluate the total loss and we conclude that when increasing the blending ratio of kenaf, the fiber losses also increased (Zhang Citation2003).
Table 3. Yarn composition.
Table 4. Yarn tensile properties.
() resumes the tensile properties of different yarns produced.
The results obtained show that the yarn tensile properties are characterized by a high coefficient of variation especially for M1. M4 and M5. Generally, long fibers are easier to spin than short fibers. The kenaf fibers are longer than the cotton fibers which must improve the regularity, and this is what we have noticed in M2 and M3 the coefficient of variation decreases from 28.49% for M1 to 7.88% and 8.93, respectively, for M2 and M3. But the regularity of property measured decreases (CV (%) increases) by increasing the percentage of kenaf in M5 et M4. This is due to the use of machines not adapted to kenaf fibers. So, the increase in the percentage of kenaf fibers in the mixture increases the irregularity (Dallel Citation2012).
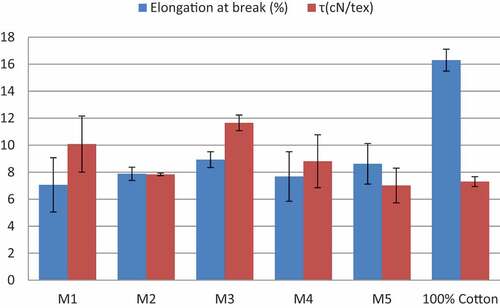
The yarn tensile properties (elongation and tenacity), presented in (), improve with the increase yarn count. Indeed, elongation and strength improve to reach maximum values of 8.93% and 6.82 N, respectively, for elongation and breaking force for the M3 mixture and then decrease for the two M4 and M5 mixtures. Compared to 100% cotton yarn, kenaf cotton blend presents better tenacity especially for M4, which has approximately the same yarn count. But for elongation, 100% cotton yarn has better elongation and this is due to the rigidity of kenaf fiber compared to cotton (Tao et al. Citation1999).
Figure 7. Mechanical properties of kenaf cotton yarn.
The tensile curve () reveals a rigid behavior of yarns made of kenaf/cotton blend. This behavior is clearer when increasing the percentage of kenaf in the blend. This is explained by the stiffness of kenaf fibers, which affects the yarn behavior.
Figure 8. Yarns tensile curve.
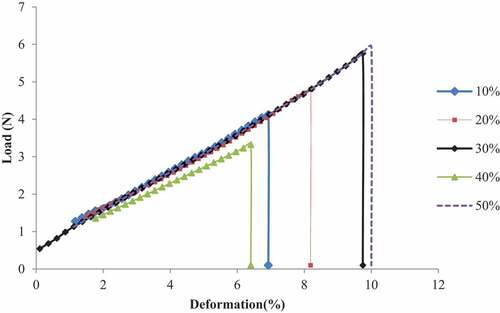
In the general case, the yarn tensile test curve has three zones (Dallel Citation2012):
A first linear zone governed by Hooke’s law where the load is proportional to the deformation. In this zone of low extension. the elastic recovery is total.
A second zone of extension characterized by a large deformation for a low load. In this zone the recovery is not total.
A third zone defined by a significant drop in load for a very short time. characteristic of the material breaking
For the obtained tensile curves, we notice the absence of the second zone. So, we have a first part which is a linear curve and then the breaking point and drop in load. This is also due to the high rigidity of the kenaf fibers. And as confirmation to this observation, we notice that by increasing the percentage of kenaf fibers in the mixture the yarn becomes more rigid.
The yarn regularity test is presented in ().
Table 5. Yarn regularity test results.
To evaluate yarn production quality, ε coefficient was calculated and it is the ratio (CV/U) (Dallel Citation2012).
This coefficient allows understanding the distribution of irregularities in the produced yarn. Indeed:
If ε is equal to (π/2) = 1.25, then the defect distribution follows a normal Gaussian law.
If ε is less than 1.25, then the distribution is a symmetrical distribution with a fairly strong periodic distribution.
If ε is more than 1.25, then it is an asymmetric distribution with periodic defects but random variations.
ε is calculated for each mixture, and the results are summarized in ():
Table 6. Yarn regularity coefficient and ε results.
For all manufactured yarns, the coefficient ε is different from 1.25 only the M2 blend has a ratio close to 1.25 so this blend presents a normal defect distribution. While for the M4 mixture we have a coefficient less than 1.25 which means that we are in the presence of a symmetrical distribution with the presence of periodic defects at all the yarn length. For all other mixtures M1, M3 and M5, this coefficient is more than 1.25 so the distribution is asymmetrical with periodic defects but random variation.
The fact that the defects are periodic allows us to conclude that these defects are related to the machines used and their settings.
To better assess the regularity of the yarns manufactured and give more precision to this analysis, we will calculate the Cvideal and the index of irregularity. Indeed, the Cvideal corresponds to the limit Cv obtained under the ideal manufacturing conditions (Dallel Citation2012; Zhang Citation2003).
The CVideal is calculated according to the following formulas:
i : index of fibers present in the mixture
Tfil : yarn count
Ti : fiber i count calculated according to the following formulas:
with α is the percentage of fiber i in the mixture
CVideal.i : ideal coefficient of variation for the fiber i.
Where:
CVi: the coefficient of variation of the fiber section and it is generally neglected.
n: number of fibers on the yarn section
All the calculated results are presented in ().
Table 7. Determination of the Cv ideal and the irregularity index ireg.
The Irregularity Index Ireg is the ratio between the Cvm and the Cvideol. This value expresses the quality of the yarn compared to a perfect regular yarn.
A perfectly regular yarn must have a regularity index equal to 1 and it has a good regularity if its index is between 1.2 and 1.4. So, the closer the value of the regularity index is to 1, the more regular yarn is as follows (Dallel Citation2012).
The results prove that Ireg is high, so we have a discrepancy between the values of Cvm and Cvideal. This can be explained by the fact that it is difficult to obtain regular yarn made from fibers with different characteristics (lengths, thinness, etc.) (Ramakrishna et al. Citation2018; Zhang Citation2003)
Conclusion
This work presents the results of the first attempt to spin kenaf in Tunisia and in cooperation with a cotton spinning company. We tried to adapt kenaf fibers to cotton spinning machines by a softening treatment but despite that it has been proved that spinning a100% kenaf yarn is not possible due to the rigidity of these fibers. That’s why the cotton fibers were used in blend with kenaf fibers to produce yarn.
The mechanical properties (elongation and breaking strength) improve when increasing the amount of kenaf in the fiber blend. When comparing the results of M2 to M5, indeed. The mechanical properties improve to reach maximum values of the breaking force to reach maximum values of 8.93% and 6.82 N, respectively, for the elongation and breaking force for the M3 mixture but M4 has the best regularity index Ireg.
The values of the uniformity index Um and the coefficient of variation CVm proved that the produced yarns are not regular, and this is explained by the difference between fiber properties. But we notice that this regularity was improved when increasing the amount of kenaf in the fiber blend.
To conclude, the results reveal that the kenaf-cotton blended M4 presents good properties compared to 100% cotton yarn expected elongation which allows producing fabrics and different weave structures that can be utilized for various potential applications like home textiles and medical textiles.
Highlights
This research mainly focuses on the development of kenaf cotton blend yarn and the evaluation of the yarn quality.
Kenaf fibers are rigid and lack of cohesiveness that makes their spinning a challenge and oblige us to add cotton to improve cohesiveness.
Kenaf cotton blended yarns were manufactured by open-end process. And the yarn quality was evaluated measuring the yarn count, yarn strength, yarn elongation, and yarn regularity.
The results prove that kenaf/cotton yarn presents good mechanical properties and regularity.
Disclosure statement
No potential conflict of interest was reported by the author(s).
References
- Ahsan, Q., T. S. S. Carron, and Z. Mustafa. 2019. On the use of nano fibrillated kenaf cellulose fiber as reinforcement in polylactic acid biocomposites. Journal of Mechanical Engineering and Sciences 13 (2):4970–10. doi:10.15282/JMES.13.2.2019.15.0412.
- Akin, D. E., R. B. Dodd, W. Perkins, G. Henriksson, and K. E. L. Eriksson. 2016. Spray Enzymatic Retting: A New Method for Processing Flax Fibers. Textile Research Journal 70 (6):486–94. doi:10.1177/004051750007000604.
- Bel-Berger, P., T. V Hoven, G. Ramaswamy, L. Kimmel, and E. Boylston. 1999. Cotton/Kenaf Fabrics : A Viable Natural Fabric. Journal of cotton science 3:60–70.
- Dallel, M. 2012. Evaluation Du Potentiel Textile Des Fibres d’Alfa (Stipa Tenacissima L.) : Caractérisation Physico-Chimique de La Fibre Au Fil. Undefined haute-alsace. France: Université de Haute Alsace, LPMT.
- Ramakrishna, G., J. Srinivasan, Niveda, and S. Gowtham. 2018. Development of Sustainable Textiles from Kenaf-Cotton Blended Yarn. doi:10.31031/TTEFT.2018.01.000514.
- Ramaswamy, G. N., C. G. Ruff, and C. R. Boyd. 2016. Effect of Bacterial and Chemical Retting on Kenaf Fiber Quality. Textile research journal 64 (5):305–08. doi:10.1177/004051759406400507.
- Tao, W., T. A. Calamari, C. Yu, and Y. Chen. 1999. Preparing and Characterizing Kenaf/Cotton Blended Fabrics. Textile Research Journal : Publication of Textile Research Institute Inc and the Textile Foundation 69 (10):720–24. doi:10.1177/004051759906901004.
- Zhang, T. 2003. Improvement of Kenaf Yarn for Apparel Applications. Faculty of the Louisiana State University and Agricultural and Mechanical College. https://digitalcommons.lsu.edu/gradschool_theses/2054.