
 ?Mathematical formulae have been encoded as MathML and are displayed in this HTML version using MathJax in order to improve their display. Uncheck the box to turn MathJax off. This feature requires Javascript. Click on a formula to zoom.
ABSTRACT
The global demand for plastics has been continuously increasing at a rapid rate and their disposal largely pollutes the atmosphere and oceans. Natural fibers possess the inherent characteristics required for plastic making and their disposal causes less harm to the environment. In this paper, physicochemical, thermal, mechanical and morphological characteristics of novel cellulosic fiber extracted from the bark of Tithonia diversifolia (TD) investigated through various characterization tests have been reported. TDFs were found to possess higher cellulose (63.9 wt.%) and high lignin content (19.3 wt.%) which make them stronger and more stable. Lower density (1440 kg/m3), higher crystallinity index (51.84%), higher tensile strength (243–386 MPa) and higher thermal stability (up to 337.17°C) make TDFs more suitable for making green composites. The morphology of the TD fiber surface observed through field emission scanning electron microscopy (FESEM) was found to be rougher with some serrations which facilitate better bonding characteristics with the polymer matrix.
摘要
全球对塑料的需求一直在快速增长,塑料的处理在很大程度上污染了大气和海洋. 天然纤维具有塑料制造所需的固有特性,其处理对环境的危害较小. 本文通过各种表征试验,研究了从虎耳草树皮中提取的新型纤维素纤维的物理化学、热学、力学和形态特征. 发现TDF具有较高的纤维素(63.9重量%)和较高的木质素含量(19.3重量%),这使它们更坚固和更稳定. 较低的密度(1440 kg/m3)、较高的结晶度指数(51.84%)、更高的拉伸强度(243-386 MPa)和更高的热稳定性(高达337.17°C)使TDF更适合制造绿色复合材料. 通过场发射扫描电子显微镜(FESEM)观察到的TD纤维表面的形貌更粗糙,具有一些锯齿,这有助于与聚合物基质更好地结合.
Introduction
From 1950 to 2015, 8.3 billion tonnes of plastics were produced globally, out of which 4.9 billion tonnes of plastic waste were generated and disposed of through landfills (Barnes Citation2019). About 8 million tonnes of plastic waste are dumped yearly into the ocean, and this results in the release of toxic chemicals such as polystyrene and Bisphenol-A during plastic degradation which adversely affects the life of marine habitats. The global demand for plastics has been increasing continuously over years, by about twentyfold times since 1964, and this huge demand for plastics is attributed mainly to the growing population and tremendous increase in the demand for automobiles (MacArthur, Waughray, and Stuchtey Citation2016). The rapid depletion of fossil fuel resources and the lack of environmentally safe disposal procedures for conventional petroleum-based plastics have necessitated the production of plastics using eco-friendly materials. Natural fibers derived from plants offer several significant advantages required for reinforcing polymer matrices. Some of them include abundant presence, high specific strength, renewability, biodegradability, nontoxic, high acoustic damping and lower density (Karimah et al. Citation2021). Despite many advantages, poor adhesion with polymer matrix and poor thermal stability limit the extent of application of natural fibers for composite making. However, many physical (stretching, calendaring, corona, plasma, ionized air, thermal, steam explosion, ultraviolet, electron radiation, dielectric barrier, etc.) and chemical (alkylation, acrylation, benzoylation, permanganate, silane, peroxide, etc.) treatments are adopted to overcome the drawbacks caused due to hydrophilicity and enhance the thermal stability of natural fibers (Ahmad, Hamid, and Osman Citation2019). Factors such as chemical composition, extraction technique, maturity of the plant and environmental conditions determine the overall properties of natural fibers (Sanjay et al. Citation2019). Natural fibers can be obtained from leaves, bast or stem, flowers, roots and grass of plants. The fibers extracted from bast or stem possess superior mechanical properties due to a high degree of polymerization and have been more suitable for reinforcing polymer matrices. Some of the bast fibers which were most commonly used include flax, hemp, jute, kenaf and ramie. The principal chemical constituents of plant fibers include cellulose, hemicellulose, lignin, pectin and wax. Cellulose is the only semi-crystalline constituent made up of D-anhydrogluco pyranose units linked together by β-1,4-glycosidic linkages. Cellulose provides strength, stiffness and stability to plant fibers. Hemicellulose comprises many complex sugar units such as xyloglucans, xylans, mannans, glucomannans and beta-glucans. It is highly hydrophilic in nature and is susceptible to biological and thermal degradation. Lignin is a complex three-dimensional polymer with ring-substituted phenyl propane’s monomeric units linked together. It provides rigidity and thermal stability to fibers. Waxes are the esters of long-chain fatty alcohols with long-chain fatty acid chains. The presence of the higher amount of wax adversely affects the interfacial adhesion between fiber and polymer matrix. The various methods of extraction adopted for obtaining the natural fibers include retting (chemical, dew, water, enzymatic), mechanical decortication, steam explosion and hydrothermal technique (Sisti et al. Citation2018).
Tithonia diversifolia (TD) was first introduced in West Africa as an ornamental plant and later spread to other tropical regions of the world for various purposes such as fuelwood, fodders, poultry feed, erosion control, soil rejuvenation and boundary demarcation (Olabode et al. Citation2007). TD belongs to the genus Tithonia and family Asteraceae and is commonly known as Mexican sunflower, tree marigold, Japanese sunflower and wild sunflower (Oyewole et al. Citation2008). TD is a perennial shrub that grows to a height of up to 3 m and bears daisy-shaped yellow-colored flowers of 5-15 cm in width (Mabou Tagne, Marino, and Cosentino Citation2018). The species is popularly known for its high medicinal value and has been used extensively used to treat various ailments such as malaria, diarrhea, fever, hematomas, hepatitis and wounds (Jian-Qiao et al. Citation2002). The fiber identified is novel since no characterization has been done previously and the promising part of the identified tree is that it is mostly grown as an ornamental plant in the most of households in Tamilnadu. The challenge often faced with natural fibers is the poor fiber-matrix interaction between hydrophilic fiber and hydrophobic matrix. In order to replace existing synthetic fibers and to save the environment it is essential that a new natural fiber with good properties for preparing high-strength composite members is the need of the hour. From the researcher’s knowledge and literatures available, it is the first time that the bark fibers of TD as novel fibers were characterized extensively. From the experimental data, it was observed that TD fiber is good reinforcement for the polymer matrix composites and, also, it is nonpoisonous and can be comfortably handled by humans. The scope is huge to utilize the TD as reinforcement for making polymer composite. TD was characterized by Fourier Transform InfraRed (FTIR) spectroscopy, X-Ray diffraction (XRD), field emission scanning electron microscope (FESEM), single fiber tensile test and atomic force microscopy (AFM).
Materials and methods
Fiber extraction
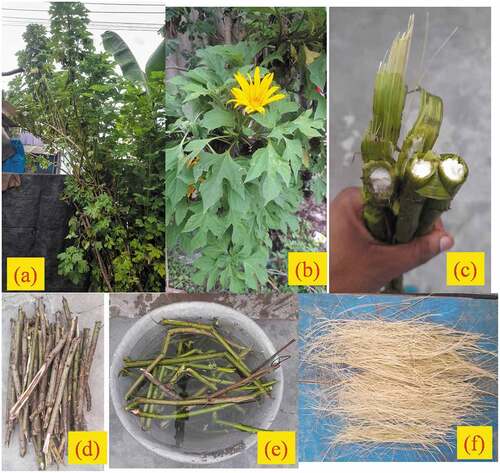
Tithonia diversifolia identified in Arakkonam town, Ranipet district, TamilNadu, India, was taken for the present investigation. The tree has grown to a height of 2 m approximately and was found to bear daisy-shaped yellow flowers as shown in . The water retting technique (Ilaiya Perumal and Sarala Citation2020) was adopted for the extraction of Tithonia diversifolia fibers. The stem of the tree was cut to short lengths using a sharp knife as shown in and soaked in water maintained at room temperature for a period of 14 days as shown in . During this period, microbes act upon the bark of the stem and facilitate easy separation of the inner fibrous layer from the outer layer through manual peeling. The wet fibers thus extracted were allowed to dry completely by placing them under direct sunlight for a period of 24hrs as shown in .
Figure 1. Tithonia diversifolia (a) Plant (b) Branches with flower (c) Stems with fiber (d) Cut stems for retting (e) Water retting (f) Extracted fibers (dried).
Chemical analysis
The chemical constituents of TDFs were determined through standard test methods. Kurschner and Hoffer’s method was adopted to assess the quantity of cellulose present in TDFs (Kurschner and Hoffer Citation1993). A thoroughly washed and oven-dried fiber sample weighing approximately 1 g was immersed in a mixture of 20 mL of 95% ethanol and 80 mL of 69% nitric acid and heated up to 110°C for 1 hour. The fibers were placed in an oven maintained at 60°C until constant weight is attained and the insoluble fraction thus left out represents the cellulose present in TDFs. The hemicellulose content in TDFs was determined through the NFT standard 12–008 method (Manivel et al. Citation2021). The powdered fiber samples were heated in hydrobromic acid, and the hemicellulose present in the sample was transformed to furfural and was separated out and measured using distillation and by applying the spectrophotometric technique. The lignin content in TDFs was determined by applying APPITA P11S–78 method. The crushed fiber sample was hydrolyzed using 72% of H2SO4 for one hour and at 30°C. The sample was then mixed with methylene chloride and placed in an autoclave maintained at 125°C for 1 hour. The lignin present in the sample was then filtered out through retentate and weighed. The wax content in TDFs was quantified through the Soxhlet extraction process (Conrad Citation1944).
The wax content present in TDFs was then determined using the Equationequation (1)(1)
(1)
Wf-Weight of oven dried sample (g)
Ww- Weight of wax extracted from the sample (g)
The ash content of TDFs was determined as per ASTM E 1755–01 standard. The crushed fiber sample was completely burnt to ash by placing the sample inside a calorimeter maintained at 250°C. The quantity of ash finally left out as residue was then weighed.
The density of TDFs was determined by applying the Mettler Toledo xsz05 balance method (Gopinath et al. Citation2016). TDF sample was completely dried by placing them in an airtight non hygroscopic desiccator containing CaCl2. The microbubbles, if any, present in the fiber sample were completely removed by impregnating the sample in toluene for 2 hours. The fibers were chopped to 10 mm size and placed in a pycnometer. The density of TDFs was then determined by using Equationequation (2)(2)
(2)
where
m1- mass of empty pycnometer (g)
m2- mass of pycnometer with fiber sample (g)
m3- mass of pycnometer with toluene (g)
m4- mass of pycnometer with fiber sample and toluene(g)
ρT– density of toluene (0.8669 g/cm3).
The moisture content present in TDF was determined through the normal weight loss method. A fiber sample weighing 20 mg was placed in an oven maintained at 100°C for 4 hours 30 minutes until constant weight is attained. The percentage of moisture content in TDFs is determined using Equationequation (3)(3)
(3) .
Fourier transform infrared spectroscopy
FTIR spectra of TDFs were obtained using an FTIR spectrometer (Model: FTIR-8400S Spectrum, Make: SHIMADZU, Japan). The fiber sample was powdered by using a mortar and pestle tools and mixed with potassium bromide. The mixture was made in pellet form by applying adequate pressure using a hydraulic press machine. Infrared radiation was allowed to an incident on the pelletized sample and FTIR spectra over the wavenumber region 4000 cm−1-500 cm−1 were generated by maintaining the scan rate of 32 scans/min and resolution of 4 cm−1.
X-ray diffraction
The molecular structure, percentage of crystallinity and crystallite size of TDFs were analyzed through X-ray diffraction using an X’pert Pro PANalytical system diffractometer over the range of 2θ from 10° to 80° and at step size (2θ) of 0.05°. The generator settings of 30 mA and 45kV and a scan rate of 5°/min were maintained during the investigation. A monochromatic beam of CuKα radiation of wavelength 0.1542 nm was generated by bombarding copper target using high-energy electrons and allowed to an incident on the sample placed on a rotating platform. The diffracted radiation was then captured by the detector which records the counts of X-rays scattered by the sample. The relative amount of crystalline cellulose out of the total quantity of cellulose which includes both crystalline and amorphous fractions known as crystallinity index(CI) was evaluated through the peak height method proposed by the Segal et al. (Citation1959) (Segal et al. Citation1959). The value of CI of TDF was thus determined using Segal Equationequation (4)(4)
(4) :
The size of cellulose crystals significantly influences the chemical reactivity and water absorption behavior of the fiber. Scherer’s empirical equation given in (5) (Indran and Edwin Raj Citation2015) was used to determine the crystallite size (CS) of TDFs.
where K = 0.89 is Scherer’s constant, β is the peak’s full width at half maximum and λ is the wavelength of radiation.
Thermal properties of TDFs
The thermal degradation behavior of TDFs was studied through various techniques such as thermogravimetric (TG), differential thermogravimetric (DTG) and differential thermal analysis (DTA). For this purpose, Jupiter simultaneous thermal analyzer (Model: STA 449F3, NETZSCH, Germany) was used. The procedure involves heating up of powdered fiber sample gradually from room temperature to 1000°C with the rate of temperature maintained at 10°C/min. The combustion process was performed in a nitrogen atmosphere so as to avoid charging effects due to oxidation and high-purity nitrogen gas was continuously passed into the furnace at a flow rate of 20 mL/min.
Tensile properties
The tensile resistance offered by TDFs was determined by performing a single fiber tensile test on twenty numbers of randomly selected TDF samples as per ASTM 3822–07. The fiber samples with a gauge length of 75 mm were subjected to tensile load using the INSTRON Universal testing machine of 5kN capacity load cell. During the test, crosshead speed was maintained at 0.1 mm/min.
Surface morphology
The characteristics of the fiber surface were studied through high-resolution scanning electron microscope images obtained using Schottky Emitter field emission scanning electron microscope (FESEM) (Model:Thermo Scientific Apreo S). The fiber samples were coated with a thin layer of gold to overcome the charging effects of the electron beam. An accelerating voltage of 30kV was maintained during the course of the examination.
Energy-dispersive X-ray spectroscopy (EDX)
The elements present at the fiber surface were analyzed by using an energy-dispersive spectrometer (EDS) analyzer (BRUKER(German), Model: Nano X flash detector with a magnification of 1000× and other settings such as accelerating voltage and working distance maintained at 10.0kV and 6.2 mm.
Atomic force microscopy (AFM)
Atomic force microscopy (AFM) analysis was used to assess the roughness of the TDF. The AFM analysis was performed in the Park XE-70 Model AFM (Korea Make) with XEI image processing software to investigate the data. The parameters such as average surface roughness (Ra), root-mean-square roughness (Rq or Rrms),10-point average roughness (Rz), skewness (Rsk), kurtosis (Rku) and maximum peak-to-valley height (Rt) can be found out from AFM analysis. The working range of the scanner scale in x, y and z-direction is 10 μm x 10 μm x 70 μm resolutions.
Results and discussions
Chemical composition of TDFs
The quantity of various chemical constituents present in TDFs and other natural fibers is provided in . TDFs were found to possess high cellulose content (63.9 wt%) comparatively more than that present in other natural fibers such as Carica papaya (38.71 wt.%), Althaea officinalis (44.6 wt .%), Pennisetum purpureum (46 wt.%), Parthenium hysterophorus (51.5 wt.%), Ficusreligiosa root (55.58 wt.%) and Cordia dichotoma (59.7 wt.%) (Sudhir Chakravarthy et al. Citation2020). The presence of higher cellulose promotes high mechanical strength and greater rigidity in TDFs. Hemicellulose content (19.40 wt. %) in TDFs was found to be higher than other natural fibers such as flax (14 wt.%), hemp (17.9 wt.%), Prosopis juliflora (16.14 wt.%), Calotropis gigantea (19.29 wt.%) and lower than Erythrina variegata (37.38 wt.%) (Gopinath, Billigraham, and Sathishkumar Citation2021). Lower hemicellulose improves resistance against chemical and biological attack and lowers the moisture absorption characteristics in TDFs. Lignin prevents the penetration of harmful enzymes through the cell wall and provides mechanical strength to the cell wall of natural fibers (Santos, Soares Teixeira, and Savastano Junior Citation2017). TDFs were found to possess high lignin content (19.3 wt.%) comparatively more than that observed in other natural fibers such as kenaf (8.18 wt.%), jute (12 wt.%), Carica papaya (14.26 wt.%), Albizia amara (15.61 wt.%) and Acacia leucophloea (17.73 wt.%) (Gopinath, Billigraham, and Sathishkumar Citation2021). The wax content (0.61 wt.%) in TDFs was found to be lower than most of the natural fibers, and this makes the fiber to be rougher and enables better bonding characteristics while reinforcing polymer matrices (Siva et al. Citation2020). The moisture content (9.8 wt.%) in TDFs was found to be comparatively lower than that present in other natural fibers such as Sansevieria ehrenbergi (10.55 wt.%), Hibiscus vitifolius (11.31 wt.%), Sida rhombifolia (12.02 wt.%) and jute (12.6 wt.%) (Manivel et al. Citation2021).
Table 1. Fiber classification, chemical compositions and density of raw TDFs and various natural fibers.
Density and diameter of TDFs
The density of TDF (1440 kg/m3) was found to be appreciably lower than other plant fibers such as jute (1460 kg/m3), hemp (1500 kg/m3) but higher than Sida cordifolia (1330 kg/m3), kenaf (1400 kg/m3), Acacia leucophloea (1385 kg/m3), Sida rhombifolia (1320 kg/m3), Cissus vitiginea (1287 kg/m3), Carica papaya (943 kg/m3) and Indian mallow (1330 kg/m3) (Gopinath, Billigraham, and Sathishkumar Citation2021). Java-based image processing image J software was utilized to find the average TDF diameter on the FESEM micrographs of individual TDF as shown in . FESEM examination was done on 25 different TDF specimens of each 40 mm in order to determine the diameter along the width. Fifty readings were recorded on each FESEM micrographs, and it was repeated on 25 samples and the mean, standard deviation and standard error of TDF diameter were calculated (Mwaikambo and Ansell Citation2006). The average diameter of the TDF specimens using image analysis software was found to be 320 µm, and this value is comparable with other natural fibers such as Petiole bark (250–650 µm), palm (400–490 µm), Coccinia grandis(543–621 µm), Phoenix dactylifera (577 ± 83 µm) and Cissus quadrangularis stem (770–870 µm). The correlation between the diameter and density of TDF is that the density tends to increase when the diameter values become smaller. An increase in density, which is directly related to the decrease in diameter, can be attributed to fewer defects in the TDF. With appropriate surface treatments, the diameter can further be reduced to have fewer defects in the fiber which directly influences the mechanical properties of the TDF (Indran and Edwin Raj Citation2015). The density of TDF is 1440 kg/m3, which confers that the fiber can be reinforced with matrix for making lightweight polymer and hybrid composites.
X-ray diffraction
The X-ray diffractogram of the TD fiber sample is shown in . The peak at 2θ = 22.28° corresponds to the crystallographic plane (002) of cellulose and that observed at 2θ = 18.73° corresponds to the amorphous fraction. The crystallinity index of Tithonia diversifolia fiber determined using Segal Equationequation (4)(4)
(4) was found to be 51.84% and the value of CI of TD fiber is found to be greater than that of other fibers such as Grewia tilifloia (41.7%), Lygeum spartum (46.19%) Cissus quadrangularis stem (47.15%), Coccinia grandis (46.09%) and Cyperus pangorei (41%) (Jayaramudu, Guduri, and Varada Rajulu Citation2010). A higher crystallinity index implies the existence of well-oriented cellulose crystals along the fiber axis, and this eventually results in high mechanical strength of fibers (Bezazi et al. Citation2014). The crystallite size of TDFs determined through Scherer’s Equationequation (5)
(5)
(5) was found to be 2.93 nm and comparatively higher than that of other natural fibers such as ferula (1.6 nm), Kigelia africana (1.73 nm), Coccinia grandis stem (1.91 nm), Hibiscus vitifolius (2.09 nm), Althae officinalis (2.4 nm) and Sida rhombifolia (2.75 nm) (Gopinath, Billigraham, and Sathishkumar Citation2021; Seki et al. Citation2013). The crystallinity index and crystal size of raw TDFs and various natural fibers are compared in .
Figure 2. X-ray diffraction (XRD) of TDF.
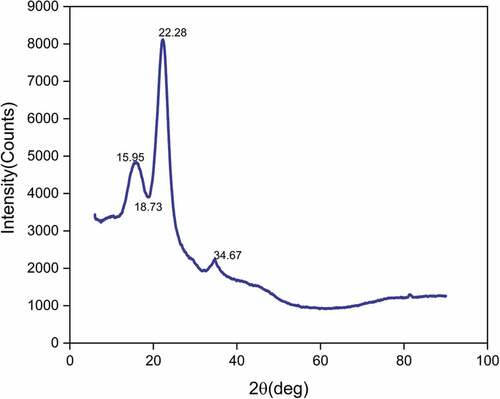
Table 2. Crystallinity index and Crystal size of raw TDFs and various natural fibers.
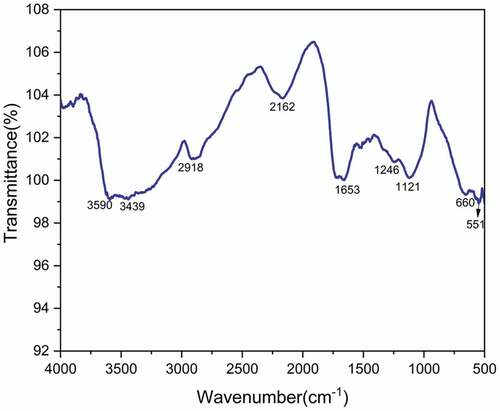
FTIR analysis
The FTIR spectrum of TDFs is shown in . The broad absorbance peak at 3400–3600 cm−1 range is attributed to OH stretching vibration of hydroxyl groups present in cellulose (Vijay et al. Citation2020), and it is absorbed at a peak of 3590 cm−1.Similar OH groups were absorbed in Erythrina variegata and Sida acuta fibers (Gopinath, Billigraham, and Sathishkumar Citation2021) at peaks of 3327 and 3341 cm−1. The prominent peak at 2918 cm−1 is attributed to the C-H stretching vibration of CH and CH2 groups present in cellulose and hemicelluloses (Kathirselvam et al. Citation2019). The similar CH and CH2 groups were absorbed in Erythrina variegata, Sida acuta and Sansevieria ehrenbergii fibers (Gopinath, Billigraham, and Sathishkumar Citation2021; Sathishkumar et al. Citation2013) at peak of 2918, 2924 and 2924 cm−1. The sharp peak at 2162 cm−1 corresponds to C≡C stretching and C≡N stretching of nitriles and alkynes (Tamanna et al. Citation2021). The sharp peak at 1653 cm−1 is attributed to carbonyl (C=O) stretching vibration of Hemicelluloses (Sahoo et al. Citation2021). The minor peak at 1246 cm−1 corresponds to the C-O stretching vibration of acetyl groups of lignin (Cai et al. Citation2016). It was absorbed from Erythrina variegata and Sida acuta fibers (Gopinath, Billigraham, and Sathishkumar Citation2021) at peaks of 1246, and 1246 cm−1. The peak at 1121 cm−1 corresponds to symmetric stretching vibration of β(1,4)- glycosidic links of cellulose (Alves et al. Citation2016). It was absorbed from Erythrina variegata, Sida acuta and Sansevieria ehrenbergii fibers (Gopinath, Billigraham, and Sathishkumar Citation2021; Sathishkumar et al. Citation2013) at a peak of 1042, 1028 and 1122 cm−1. The band at 660 cm−1 is attributed to the out-of-plane vibration of the ring structure and the band at 551 cm−1 indicates C-OH bending vibration (Bezazi et al. Citation2014). It was absorbed from Erythrina variegata, Sida acuta and Sansevieria ehrenbergii fibers (Gopinath, Billigraham, and Sathishkumar Citation2021; Sathishkumar et al. Citation2013) at a peak of 677, 604 and 618 cm-1.
Figure 3. FTIR spectrum of TDF.
Thermal analysis
Thermal analysis was conducted to identify the temperature at which each chemical constituent of TDFs degrades thermally. The thermal degradation behavior of TDFs was evaluated by using TG, DTG and DTA curves as shown in . The peak in the TG curve at 77.31°C attributed to the loss of moisture content present in TDFs through evaporation. The peak at 274.69°C observed in the DTG curve associated with a mass loss of 14.26% corresponds to the thermal depolymerization of hemicellulose. The prominent peak in DTG curve at 337.17°C with a mass loss of 51.60% is attributed to the thermal degradation of cellulose. Similar peaks of cellulose degradation were observed in other natural fibers such as kenaf (307.2°C), hemp (308.2°C), Cissus quadrangularis (328.9°C), Prosopis juliflora (331.1°C) and Acacia leucophloea (346.8°C) (Arthanarieswaran, Kumaravel, and Saravanakumar Citation2015; Indran and Edwin Raj Citation2015; Saravanakumar et al. Citation2013). After the thermal decomposition of cellulose, the thermal degradation of constituents such as lignin, wax and other impurities occurs over a wide range of temperatures. The thermal stability of TDFs can be assessed by evaluating the kinetic activation energy which represents the amount of energy required to decompose one mole of sample thermally. The activation energy (Ea) of TDFs obtained using the slope of the Broido plot as shown in and using Equationequation (6)(6)
(6) was found to be 94.87 kJ/mol which is comparatively higher than that of other natural fibers such as Saharan aloevera cactus leaf (60.2 kJ/mol), Cissus quadrangularis (65.23 kJ/mol), Lygeum spartum (68.77 kJ/mol) and Prosopis Juliflora (76.72 kJ/mol) (Manimaran et al. Citation2018; Sudhir Chakravarthy et al. Citation2020).
Figure 4. (a) TGA and DTG curve of TDF (b) DTA curve of TDF (c) Broido’s plot of TDF.
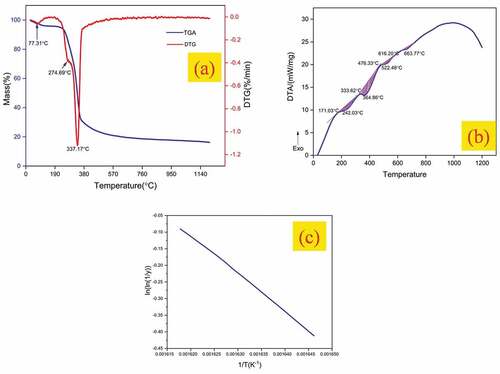
The range of temperature over which the thermal decomposition of each chemical constituent occurs is analyzed quantitatively through differential thermal analysis (DTA). In the DTA curve of TDF given in four endothermic peaks at 242.03°C, 364.86°C, 522.48°C and 663.77°C were observed. The first major endotherm ranging between 171.03°C and 364.86°C corresponds to thermal depolymerization of hemicellulose, and the second major endotherm existing within 333.62°C and 476.33°C attributed to the thermal degradation of cellulose. The minor endotherm which ranges between 476.33°C and 616.20°C corresponds to the thermal degradation of lignin and the peak at 663.77°C indicates the temperature at which thermal degradation of wax and other impurities occurs (Manivel et al. Citation2021).
Tensile properties of TDFs
The single fiber tensile test setup and stress vs. strain plot of twenty samples are shown in respectively. Further, the mechanical properties of raw TDFs and various natural fibers are provided in . The tensile strength of TDF was found to be 243–386 N/mm2 with failure strain 4.07–5.52%. TDF was found to offer comparatively higher tensile strength than other fibers such as Juncus effusus (113 ± 36 MPa), Piassava (134–143 MPa), Cyperus pangorei (196 ± 56 MPa), Arundo donax (248 MPa), Ficus racemosa (270 MPa) and Sansevieria ehrenbergi (278.82 MPa) (Manivel et al. Citation2021; Sudhir Chakravarthy et al. Citation2020). The tensile modulus determined using the slope of tensile stress vs. strain plot of each sample was found to be 5.87 to 7.02 GPa. The deformation characteristics of TDFs can be evaluated by determining the microfibrillar angle (α) using an empirical Equationequation (7)(7)
(7) . The value of α for TDF was found to be 16.23°–18.86°. The microfibrillar angle of natural fibers could range from 2° to 83° with 2° for kenaf and hemp fibers and 83° for ramie fibers (Chokshi et al. Citation2020). The natural fibers which possess lower microfibrillar angle offer high tensile strength and those which possess higher microfibrillar angle offer high ductility (Djafari Petroudy Citation2017).
Figure 5. Single fiber tensile test setup for TDF.
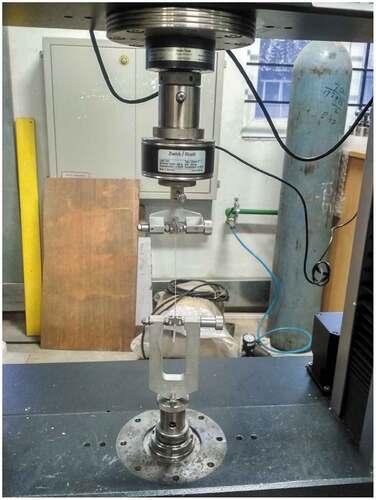
Figure 6. Stress vs strain plot of TDFs.
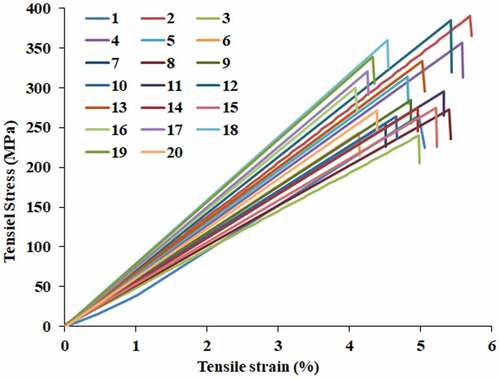
Table 3. Mechanical properties of raw TDFs and various natural fibers.
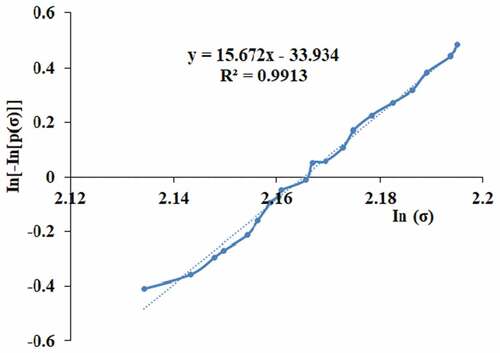
Weibull statistical analysis was used to make the relation between the various tensile strength and strains. It predicates the Weibull modulus of TDFs. Based on Weibull distribution analysis, the fiber strength in terms of survival probability is given in Equationequation 8(8)
(8) (Sathishkumar et al. Citation2013).
where σ, m, and σ0 is the tensile strength of fiber, Weibull modulus and characteristic strength of the fiber. N is the number of fibers taken for analysis (N = 20 samples). The following relation was used to calculate the Weibull modulus of the Sansevieria ehrenbergii fiber (Sathishkumar et al. Citation2013).
The Weibull modulus of the TDFs was calculated using Equationequation 9(9)
(9) and it is found to be around 2.16. Probability curve in was used to calculate the Weibull modulus (m) with help of an estimator (EquationEquation 10
(10)
(10) ) (Sathishkumar et al. Citation2013). It shows that the ratio of the vertical axis to the horizontal axis is confirmed by the Weibull modulus and R values which is equal to 0.99. So, this model value is equal to Sansevieria ehrenbergii fiber (Sathishkumar et al. Citation2013).
Figure 7. Weibull distribution plots of TDF.
Morphological analysis of TDFs
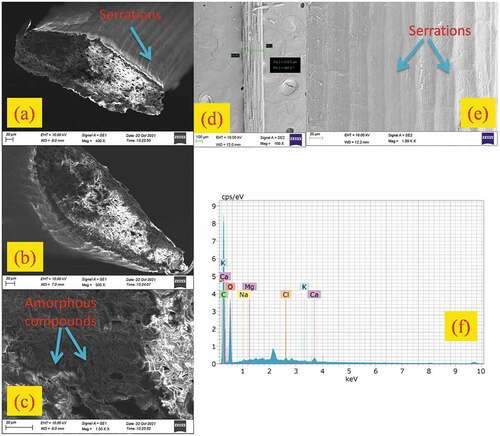
TDF surface morphology obtained using high-resolution FESEM at different magnifications (400×, 500× and 1.5K ×) in order to investigate the reinforcement and bonding ability is represented in . The cross-sectional surface of TDF as shown in reveals the multicellular surface structure with a higher amount of cellulose and rough surface with a little amount of wax. Small cracks and voids were also visible on the surface of the fiber. Similarly fiber external surface provided in shows a smaller quantity of impurities, pores and pits. It should be noted that pores contribute to surface roughness which significantly influences the tensile properties of fiber due to this a strong interfacial bonding between the fiber and matrix can occur which will further improve the mechanical properties of the fiber reinforced polymer matrix composites. Further surface image clearly reveals that the fiber should undergo chemical treatments in order to remove the undesirable debris and amorphous elements from the surface which will enhance the bonding between the fiber and the matrix.
Figure 8. (a-e) FESEM images of TDFs showing different surface morphologies (f) EDX analysis of TDF.
Energy-dispersive X-ray Spectroscopy (EDX)
The EDS spectrum showing the distribution of various elements on the surface of TDFs is given in . The atomic and weight percentage of elements present at the TDF surface is summarized in . The existence of high-intensity carbon and oxygen peaks at 0.25 and 0.52 keV in the spectrum corresponds to cellulose which is primarily built up of carbon and oxygen. The presence of relatively higher percentage of carbon than oxygen confirms the existence of amorphous constituents such as hemicellulose and lignin in higher fractions (Gopi Krishna, Kailasanathan, and NagarajaGanesh Citation2020).
Table 4. Various elements scattered on the surface of TDF.
Atomic force microscopy (AFM) analysis
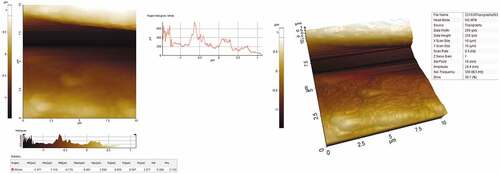
AFM images of TDF (both 2D and 3D high resolution) with surface roughness, prominent hills and valleys are represented in with indicated surface roughness values such as Ra (547 nm), Rq (655 nm) and Rz (2577 nm). The parameter roughness skewness (Rsk) computes the symmetrical profile of surface variations about the centerline (Manimaran et al. Citation2018). It should be known that the negative value of Rsk designates that the nature of the fibers is porous. The value obtained for TDF was −0.296, which means the fibers are slightly porous in nature. The Roughness kurtosis (Rku) parameter provides information about the roughness of the fibers. The obtained value of Rku is 2.13 which indicates that the surface of TDF is spiky.
Figure 9. 2D and 3D AFM images of TDF.
Conclusion
The suitability of novel cellulosic fiber extracted from the bark of Tithonia diversifolia for a composite application was assessed through various characterization tests. The chemical tests on TDFs revealed the presence of higher cellulose (63.9 wt.%), higher lignin (19.3 wt.%) and lower wax content (0.61 wt.%) which results in high strength and rigidity of fiber and facilitates better bonding characteristics when reinforced with polymer matrices while making composites. Through X-ray diffraction, the crystallinity index and crystallite size of TDFs were estimated to be 51.84% and 2.93 nm respectively. Higher crystallinity index and higher crystallite size lead to superior mechanical properties, lower water absorption and greater resistance against chemical attack. TDFs were found to exhibit higher kinetic activation energy (94.87 kJ/mol) and withstand higher temperature (up to 337.17°C). Higher tensile strength (243–386 MPa), lower density (1440 kg/m3) and better thermal stability validate TDFs as a promising reinforcement with matrix in the making of polymer composites for various non-structural applications such as partition boards in buildings, interior body panels in automobiles and for making sports goods. The scope for the future is that the identified novel fiber through characterization has shown good mechanical and structural property that is suitable for making sports and nonstructural automotive components. This characterization focused only on microstructure and mechanical properties; however, an intuition for the same will be carried out in the future to evaluate the thermal and tribological characteristics. However, more research must be done on processing techniques in a more sustainable way, which is of current scientific interest with appropriate chemical treatments which will eliminate the amorphous compounds found on the surface of TDFs toward making effective polymer composite reinforcements.
Highlights
Higher cellulose content (63.9 wt. %).
The density of TDF is found to be 1440 kg/m3.
Crystallinity index (CI) of 51.84% determined using the peak deconvolution method.
Microfibrillar angle of 16.23°-18.86°exhibits high ductility of TDF.
EDX reveals existence of high-intensity peaks of carbon and oxygen.
The tensile strength of fiber is ranging from 243 to 386 MPa.
Disclosure statement
No potential conflict of interest was reported by the authors.
References
- Ahmad, R., R. Hamid, and S. A. Osman 2019. Physical and chemical modifications of plant fibres for reinforcement in cementitious composites. Advances in Civil Engineering 2019March. Hindawi:e5185806. 10.1155/2019/5185806
- Alves, A. P. P., L. P. Z. de Oliveirade Oliveira, A. A. N. Castro, R. Neumann, L. F. C. de Oliveirade Oliveira, H. G. M. Edwards, and A. C. Sant’ana. 2016. The structure of different cellulosic fibres characterized by raman spectroscopy. Vibrational Spectroscopy 86 (86):324–19. doi:10.1016/j.vibspec.2016.08.007.
- Arthanarieswaran, V. P., A. Kumaravel, and S. S. Saravanakumar 2015. Characterization of new natural cellulosic fiber from acacia leucophloea bark. International Journal of Polymer Analysis and Characterization 204. Taylor & Francis:367–76. 10.1080/1023666X.2015.1018737
- Azeez, T. O., D. Okechukwu Onukwuli, J. Tagbo Nwabanne, and A. Tamunonengiofori Banigo. 2020. ‘Cissus Populnea Fiber - Unsaturated Polyester Composites: Mechanical Properties and Interfacial Adhesion’. Journal of Natural Fibers 17 (9):1281–94. doi:10.1080/15440478.2018.1558159.
- Barnes, S. J. 2019. Understanding plastics pollution: the role of economic development and technological research. Environmental Pollution 249 (June):812–21. doi:10.1016/j.envpol.2019.03.108.
- Baskaran, P. G., M. Kathiresan, P. Senthamaraikannan, and S. S. Saravanakumar. 2018. ‘Characterization of New Natural Cellulosic Fiber from the Bark of Dichrostachys Cinerea’. Journal of Natural Fibers 15 (1):62–68. doi:10.1080/15440478.2017.1304314.
- Bezazi, A., A. Belaadi, M. Bourchak, F. Scarpa, and K. Boba. 2014. Novel extraction techniques, chemical and mechanical characterisation of agave americana l. natural fibres. Composites Part B: Engineering 66 (November):194–203. doi:10.1016/j.compositesb.2014.05.014.
- Cai, M., H. Takagi, A. N. Nakagaito, L. Yan, and G. I. N. Waterhouse. 2016. Effect of alkali treatment on interfacial bonding in abaca fiber-reinforced composites. Composites Part A, Applied Science and Manufacturing 90 (November):589–97. doi:10.1016/j.compositesa.2016.08.025.
- Chokshi, S., V. Parmar, P. Gohil, and V. Chaudhary 2020. Chemical composition and mechanical properties of natural fibers. Journal of Natural Fibers00. Taylor & Francis:1–12. 10.1080/15440478.2020.1848738
- Conrad, C. M. 1944. Determination of wax in cotton fiber a new alcohol extraction method. Research-Article American Chemical Society World May 1. doi:10.1021/i560136a007.
- Djafari Petroudy, S. R. 2017. Physical and mechanical properties of natural fibers. Advanced High Strength Natural Fibre Composites in Construction: 59–83. Woodhead Publishing. 10.1016/B978-0-08-100411-1.00003-0
- Gopi Krishna, M., C. Kailasanathan, and B. NagarajaGanesh 2020. Physico-chemical and morphological characterization of cellulose fibers extracted from sansevieria roxburghiana Schult. & Schult. F leaves. Journal of Natural Fibers 00. Taylor & Francis:1–17. 10.1080/15440478.2020.1843102
- Gopinath, R., P. Billigraham, and T. P. Sathishkumar 2021. Characterization studies on new natural cellulosic fiber extracted from the bark of erythrina variegata. Journal of Natural Fibers 00. Taylor & Francis:1–20. 10.1080/15440478.2022.2157922
- Gopinath, R., K. Ganesan, S. S. Saravanakumar, and R. Poopathi 2016. Characterization of new cellulosic fiber from the stem of sida rhombifolia. International Journal of Polymer Analysis and Characterization 212. Taylor & Francis:123–29. 10.1080/1023666X.2016.1117712
- Hajiha, H., M. Sain, and L. H. Mei. 2014. ‘Modification and Characterization of Hemp and Sisal Fibers’. Journal of Natural Fibers 11 (2):144–68. doi:10.1080/15440478.2013.861779.
- Ilaiya Perumal, C., and R. Sarala. 2020. Characterization of a new natural cellulosic fiber extracted from derris scandens stem. International Journal of Biological Macromolecules 165 (December):2303–13. doi:10.1016/j.ijbiomac.2020.10.086.
- Indran, S., and R. Edwin Raj. 2015. CHaracterization of new natural cellulosic fiber from cissus quadrangularis stem. Carbohydrate Polymers 117 (March):392–99. doi:10.1016/j.carbpol.2014.09.072.
- Ishak, M. R., Z. Leman, S. M. Sapuan, A. M. M. Edeerozey, and I. S. Othman. 2010. ‘Mechanical Properties of Kenaf Bast and Core Fibre Reinforced Unsaturated Polyester Composites’. In IOP Conference Series: Materials Science and Engineering 11 (May), 012006. IOP Publishing. doi:10.1088/1757-899X/11/1/012006.
- Jayaramudu, J., B. R. Guduri, and A. Varada Rajulu. 2010. Characterization of new natural cellulosic fabric grewia tilifolia. Carbohydrate Polymers 79 (4):847–51. doi:10.1016/j.carbpol.2009.10.046.
- Jebadurai, S. G., R. E. Raj, V. S. Sreenivasan, and J. S. Binoj. 2019. Comprehensive Characterization of Natural Cellulosic Fiber from Coccinia Grandis Stem. Carbohydrate Polymers 207 (March):675–83. doi:10.1016/j.carbpol.2018.12.027.
- Jian-Qiao, G., J. J. Gills, E. Jung Park, E. Mata-Greenwood, M. E. Hawthorne, F. Axelrod, P. I. Chavez, H. H. S. Fong, R. G. Mehta, J. M. Pezzuto, et al. 2002. Sesquiterpenoids from tithonia diversifolia with potential cancer chemopreventive activity. Journal of Natural Products654. American Chemical Society:532–36. 10.1021/np010545m
- Karimah, A., M. Rasyidur Ridho, S. Sofyan Munawar, D. Sudarwoko Adi, R. D. Ismadi, B. Subiyanto, W. Fatriasari, and A. Fudholi. 2021. A review on natural fibers for development of eco-friendly bio-composite: Characteristics, and utilizations. Journal of Materials Research and Technology 13 (July):2442–58. doi:10.1016/j.jmrt.2021.06.014.
- Kathirselvam, M., A. Kumaravel, V. P. Arthanarieswaran, and S. S. Saravanakumar. 2019. Characterization of cellulose fibers in thespesia populnea barks: influence of alkali treatment. Carbohydrate polymers 217 (August):178–89. doi:10.1016/j.carbpol.2019.04.063.
- Khan, A., V. Raghunathan, D. L. Singaravelu, M. R. Sanjay, S. Siengchin, M. Jawaid, K. A. Alamry, and A. M. Asiri. 2020 August. Extraction and Characterization of Cellulose Fibers from the Stem of Momordica Charantia. Journal of Natural Fibers 1–11. doi:10.1080/15440478.2020.1807442.
- Kumar, R., N. Rajesh Jesudoss Hynes, P. Senthamaraikannan, S. Saravanakumar, and M. R. Sanjay. 2018. Physicochemical and Thermal Properties of Ceiba Pentandra Bark Fiber. Journal of Natural Fibers 15 (6):822–29. doi:10.1080/15440478.2017.1369208.
- Kurschner, K., and A. Hoffer. 1993. Cellulose and cellulose derivative. Fresenius Journal of Analytical Chemistry 92 (3):145–54. doi:10.1007/BF01354736.
- Li, X., L. G. Tabil, and S. Panigrahi. 2007. Chemical Treatments of Natural Fiber for Use in Natural Fiber-Reinforced Composites: A Review. Journal of Polymers and the Environment 15 (1):25–33. doi:10.1007/s10924-006-0042-3.
- MacArthur, D. E., D. Waughray, and M. R. Stuchtey. 2016. The new plastics economy, rethinking the future of plastics. In World Economic Forum.
- Manimaran, P., M. R. Sanjay, P. Senthamaraikannan, B. Yogesha, C. Barile, and S. Siengchin. 2020. ‘A New Study on Characterization of Pithecellobium Dulce Fiber as Composite Reinforcement for Light-Weight Applications’. Journal of Natural Fibers 17 (3):359–70. doi:10.1080/15440478.2018.1492491.
- Manimaran, P., S. P. Saravanan, and M. Prithiviraj. 2019 June. Investigation of Physico Chemical Properties and Characterization of New Natural Cellulosic Fibers from the Bark of Ficus Racemosa. Journal of Natural Fibers 1–11. doi:10.1080/15440478.2019.1621233.
- Manimaran, P., P. Senthamaraikannan, M. R. Sanjay, M. K. Marichelvam, and M. Jawaid. 2018. Study on characterization of furcraea foetida new natural fiber as composite reinforcement for lightweight applications. Carbohydrate polymers 181 (February):650–58. doi:10.1016/j.carbpol.2017.11.099.
- Manimaran, P., K. Solai Senthil Kumar, and M. Prithiviraj. 2019 November. Investigation of Physico Chemical, Mechanical and Thermal Properties of the Albizia Lebbeck Bark Fibers. Journal of Natural Fibers 1–12. doi:10.1080/15440478.2019.1687068.
- Manivel, S., N. Pannirselvam, R. Gopinath, and T. P. Sathishkumar 2021. Physico-mechanical, chemical composition and thermal properties of cellulose fiber from hibiscus vitifolius plant stalk for polymer composites. Journal of Natural Fibers00. Taylor & Francis:1–16. 10.1080/15440478.2021.1941484
- Mayandi, K., N. Rajini, P. Pitchipoo, J. T. Winowlin Jappes, and A. Varada Rajulu. 2016. Extraction and Characterization of New Natural Lignocellulosic Fiber Cyperus Pangorei. International Journal of Polymer Analysis and Characterization 21 (2):175–83. doi:10.1080/1023666X.2016.1132064.
- Mwaikambo, L. Y., and M. P. Ansell. 2006. Mechanical properties of alkali treated plant fibres and their potential as reinforcement materials. i. hemp fibres. Journal of Materials Science 41 (8):2483–96. doi:10.1007/s10853-006-5098-x.
- Olabode, O. S., W. A. Ogunyemi Sola, G. O. Adesina, and P. A. Babajide 2007. Evaluation of tithonia diversifolia (hemsl.) a gray for soil improvement. World Journal of Agricultural Sciences34. Citeseer:503–07
- Oyewole, I. O., G. O. Adeoye, G. N. Anyasor, and J. A. Obansa. 2008. Anti-malarial and repellent activities of tithonia diversifolia (hemsl.) leaf extracts. Journal of Medicinal Plants Research 2 (8):171–75. ( Academic Journals).
- Raghavendra, G., S. Ojha, S. K. Acharya, and S. K. Pal. 2014. Jute Fiber Reinforced Epoxy Composites and Comparison with the Glass and Neat Epoxy Composites. Journal of Composite Materials 48 (20):2537–47. doi:10.1177/0021998313499955.
- Reddy, B. M., Y. V. Mohana Reddy, B. C. Mohan Reddy, and R. M. Reddy. 2020. Mechanical, Morphological, and Thermogravimetric Analysis of Alkali-Treated Cordia-Dichotoma Natural Fiber Composites. In Journal of Natural Fibers 17 (5):759–68. doi:10.1080/15440478.2018.1534183.
- Sahoo, S. K., J. Ranjan Mohanty, S. Nayak, and B. Behera 2021. Chemical treatment on rattan fibers: durability, mechanical, thermal, and morphological properties. Journal of Natural Fibers1811. Taylor & Francis:1762–71. 10.1080/15440478.2019.1697995
- Sanjay, M. R., G. R. Arpitha, and B. Yogesha. 2015. Study on Mechanical Properties of Natural - Glass Fibre Reinforced Polymer Hybrid Composites: A Review. Materials Today: Proceedings, 4th International Conference on Materials Processing and Characterzation 2 (4):2959–67. doi:10.1016/j.matpr.2015.07.264.
- Sanjay, M. R., S. Siengchin, J. Parameswaranpillai, M. Jawaid, C. Iulian Pruncu, and A. Khan. 2019. A comprehensive review of techniques for natural fibers as reinforcement in composites: preparation, processing and characterization. Carbohydrate Polymers 207 (March):108–21. doi:10.1016/j.carbpol.2018.11.083.
- Santos, S. F., R. Soares Teixeira, and H. Savastano Junior. 2017. Interfacial transition zone between lignocellulosic fiber and matrix in cement-based composites. In Sustainable and nonconventional construction materials using inorganic bonded fiber composites, ed. H. S. Junior, J. Fiorelli, and S. Francisco, 27–68. dos Santos: Woodhead Publishing. doi:10.1016/B978-0-08-102001-2.00003-6.
- Saravana Kumaar, A., A. Senthilkumar, T. Sornakumar, S. S. Saravanakumar, and V. P. Arthanariesewaran. 2019. Physicochemical Properties of New Cellulosic Fiber Extracted from Carica Papaya Bark. Journal of Natural Fibers 16 (2):175–84. doi:10.1080/15440478.2017.1410514.
- Saravanakumar, S. S., A. Kumaravel, T. Nagarajan, P. Sudhakar, and R. Baskaran. 2013. Characterization of a novel natural cellulosic fiber from Prosopis juliflora bark. Carbohydrate polymers 92 (2):1928–33. doi:10.1016/j.carbpol.2012.11.064.
- Sathishkumar, T. P., P. Navaneethakrishnan, S. Shankar, and R. Rajasekar 2013. Characterization of new cellulose sansevieria ehrenbergii fibers for polymer composites. Composite Interfaces 20Taylor & Francis8: 575–93. 10.1080/15685543.2013.816652
- Segal, L., J. J. Creely, A. E. Martin, and C. M. Conrad 1959. An empirical method for estimating the degree of crystallinity of native cellulose using the X-ray diffractometer. Textile Research Journal 2910. 10–94786–94: SAGE Publications Ltd STM. 10.1177/004051755902901003
- Seki, Y., M. Sarikanat, K. Sever, and C. Durmuşkahya. 2013. Extraction and properties of ferula communis (chakshir) fibers as novel reinforcement for composites materials. Composites Part B: Engineering 44 (1):517–23. doi:10.1016/j.compositesb.2012.03.013.
- Senthamaraikannan, P., S. S. Saravanakumar, V. P. Arthanarieswaran, and P. Sugumaran. 2016. Physico-Chemical Properties of New Cellulosic Fibers from the Bark of Acacia Planifrons. International Journal of Polymer Analysis and Characterization 21 (3):207–13. doi:10.1080/1023666X.2016.1133138.
- Sisti, L., G. Totaro, M. Vannini, and A. Celli. 2018. Retting process as a pretreatment of natural fibers for the development of polymer composites. In Lignocellulosic composite materials, 97–135. springer series on polymer and composite materials. Cham: Springer International Publishing. doi:10.1007/978-3-319-68696-7_2.
- Siva, R., T. N. Valarmathi, K. Palanikumar, and V. S. Antony. 2020. Study on a novel natural cellulosic fiber from kigelia africana fruit: characterization and analysis. Carbohydrate polymers 244 (September):116494. doi:10.1016/j.carbpol.2020.116494.
- Sudhir Chakravarthy, K., S. Madhu, J. Siva Naga Raju, and M. Jabihulla Shariff. 2020. Characterization of novel natural cellulosic fiber extracted from the stem of cissus vitiginea plant. International Journal of Biological Macromolecules 161 (October):1358–70. doi:10.1016/j.ijbiomac.2020.07.230.
- Tagne, A. M., F. Marino, and M. Cosentino. 2018. Tithonia diversifolia (hemsl.) a. gray as a medicinal plant: a comprehensive review of its ethnopharmacology, phytochemistry, pharmacotoxicology and clinical relevance. Journal of Ethnopharmacology 220 (June):94–116. doi:10.1016/j.jep.2018.03.025.
- Tamanna, T. A., S. Alimuzzaman Belal, M. Abul Hasan Shibly, and A. Nabi Khan 2021. Characterization of a new natural fiber extracted from corypha taliera fruit. Scientific reports 111. Nature Publishing Group:1–13. 10.1038/s41598-021-87128-8
- Venkatachalam, N., P. Navaneethakrishnan, and T. P. Sathishkumar. 2016. ‘Characterization of Novel Passiflora Foetida Natural Fibers for Paper Board Industry’. Journal of Industrial Textiles 152808371668292. doi:10.1177/1528083716682923.
- Vignesh, V., A. N. Balaji, and M. K. V. Karthikeyan. 2016. Extraction and Characterization of New Cellulosic Fibers from Indian Mallow Stem: An Exploratory Investigation. International Journal of Polymer Analysis and Characterization 21 (6):504–12. doi:10.1080/1023666X.2016.1175206.
- Vijay, R., S. Manoharan, S. Arjun, A. Vinod, and D. Lenin Singaravelu. 2020. Characterization of silane-treated and untreated natural fibers from stem of Leucas aspera. Journal of Natural Fibers January (12):1–17. doi:10.1080/15440478.2019.1710651.
- Vinod, A., R. Vijay, D. L. Singaravelu, M. R. Sanjay, S. Siengchin, Y. Yagnaraj, and S. Khan. 2019 September. Extraction and Characterization of Natural Fiber from Stem of Cardiospermum Halicababum. Journal of Natural Fibers 1–11. doi:10.1080/15440478.2019.1669514.
- Yoganandam, K., P. Ganeshan, B. NagarajaGanesh, and K. Raja. 2020. ‘Characterization Studies on Calotropis Procera Fibers and Their Performance as Reinforcements in Epoxy Matrix’. Journal of Natural Fibers 17 (12):1706–18. doi:10.1080/15440478.2019.1588831.