
 ?Mathematical formulae have been encoded as MathML and are displayed in this HTML version using MathJax in order to improve their display. Uncheck the box to turn MathJax off. This feature requires Javascript. Click on a formula to zoom.
ABSTRACT
The objective of the current study is to develop a model employing a fuzzy logic expert system (FLES) for predicting the noise reduction coefficient (NRC) of a banana-glass fiber composite. Banana fiber has a strong ability to muffle sounds while having low tensile strength. Glass fiber, on the other hand, has a limited capacity for sound absorption despite having considerable tensile strength. A composite consisting of banana and glass fiber has been developed in order to increase noise reduction capability while keeping appropriate tensile strength. The sound adsorption test was done by passing sound through composites via an impedance tube. It was found that 25% banana and 75% glass hybrid composite having 5 mm thickness shows 375.96% more NRC than 100% glass fiber composite. Only a 25% increase of banana fiber content increased NRC incredibly. Different compositions of glass fiber, banana fiber, and thicknesses of the composites were taken as the input variables and the output, noise reduction coefficient. To better comprehend the relationship between these variables, a fuzzy logic-based model was created and the model’s coefficient of determination (R2) was found to be 0.9884. The model accurately anticipated the noise reduction coefficient of the composites with varying constituent percentages and thicknesses.
摘要
本研究的目的是开发一个使用模糊逻辑专家系统(FLES)预测香蕉玻璃纤维复合材料降噪系数(NRC)的模型. 香蕉纤维具有很强的消音能力,同时具有较低的抗拉强度. 另一方面,尽管玻璃纤维具有相当大的抗拉强度,但其吸声能力有限. 开发了一种由香蕉和玻璃纤维组成的复合材料,以提高降噪能力,同时保持适当的抗拉强度. 通过阻抗管使声音通过复合材料进行声音吸附试验. 研究发现,厚度为5 mm的25%香蕉和75%玻璃混合复合材料的NRC比100%玻璃纤维复合材料高375.96%. 香蕉纤维含量仅增加了25%,就令人难以置信地增加了NRC. 以玻璃纤维、香蕉纤维的不同组成和复合材料的厚度为输入变量,输出降噪系数. 为了更好地理解这些变量之间的关系,创建了一个基于模糊逻辑的模型,该模型的决定系数(R2)为0.9884. 该模型准确地预测了不同成分百分比和厚度的复合材料的降噪系数.
1. Introduction
Noise is an unwanted disturbing sound that affects the health and well-being of humans. Pollution of noise impacts millions of people daily (Smith and Twizell Citation1980). The most common cause of noise pollution is Noise Induced Hearing Loss (NIHL) (Konings, Van Laer, and Van Camp Citation2009). Long-time exposure to loud noise causes sleep disturbance, high blood pressure, fatigue, and cardiovascular & psycho-physiologic problems (van Kamp and Davies Citation2008). Those health problems affect all age groups and especially it keeps a negative impact on children (Mondal et al. Citation2022) A set of measures has been established worldwide to reduce noise pollution. It can be solved by a material that can reduce sound by dampening or lessening and converts the sound wave into heat energy (Na, Agnhage, and Cho Citation2012). Porous materials containing open pores like channels are efficient sound-absorbent materials because when sound passes through channels, it converts sound into heat (Cao et al. Citation2018). Textile fibrous materials are mostly used as porous sound-absorbing materials (Sun et al. Citation2021). However, sometimes it fails to absorb sound efficiently due to the complex structure of textile materials. The fiber properties, fabric construction, density, thickness and finishing types, etc. influence the sound absorbency of textiles (Flores Medina, Flores-Medina, and Hernández-Olivares Citation2016). In the field of technical textiles, researchers have given their efforts to researching the acoustic behavior of textile materials (Bhat and Messiry Citation2020). In comparison to conventional materials, natural and man-made fiber hybrid composites efficiently reduce noise (Adesina et al. Citation2019).
A textile composite combines with two or more components that create a completely unique mixture of qualities (Khalid et al. Citation2021, Citation2021). One part of the composite is a long stiff fibrous material, while the other part is the binder that holds the fibers in place (Khalid et al. Citation2021). The physicochemical properties of the composites largely depend on the properties of the constituent component (Nan, Shen, and Ma Citation2010). Hybrid composites consist of two or more reinforcing phases combined with multiple matrix phases or a single reinforcing phase combined with multiple matrix phases or a combination of multiple reinforcing phases with multiple matrix phases (Khalid et al. Citation2021, Citation2021). Hybrid composites are more flexible than single fiber-containing composites (Khalid et al. Citation2021). There are different types of hybrid composites exist such as hybrids between natural–natural fibers, natural–synthetic fibers, and synthetic–synthetic fibers (Amir et al. Citation2018). Conventionally, composite materials of glass wool as well as mineral-based materials, i.e. rock wool, vermiculite, perlite, etc., are used to insulate sound and heat in residential buildings (Singh and Mukhopadhyay Citation2022). However, these hybrid composites are found hazardous to human health and are often reported causing serious skin irritation (Lipworth et al. Citation2009) and respiratory diseases due to the presence of microcrystalline silica, tremolite, and amphibole fibers (Hodgson Citation1993). Recently, porous composite materials have been developed having the capacity to absorb sound wave according to the pores and porosity of the composite (Sarkar, Al Faruque, and Mondal Citation2021). Composites made from only banana fibers and also composites like banana-jute, banana-coir, banana-abaca fiber, and banana-bamboo fiber, etc. were applied for the sound absorption, which showed a very good sound absorbency; however, they failed to show good tensile strength (Magill et al. Citation2011). Composites made with only glass fiber and also glass fiber were mixed with different types of man-made fibers where very good tensile strength has been observed but sound absorption was not much studied for these kinds of materials (Faruk et al. Citation2014). Therefore, a banana-glass fiber composite may be a viable option for the creation of noise-isolating material with increased tensile strength (Sela et al. Citation2020).
Fuzzy modeling is a mathematical approach that uses fuzzy logic to represent and analyze complex systems that involve uncertainty or imprecision (Castillo et al. Citation2008). Fuzzy logic allows for reasoning with vague and ambiguous information, which makes it particularly useful for modeling human decision-making processes and natural systems (Gupta, Jain, and Joshi Citation2018). This modeling provides a powerful tool for understanding and analyzing complex systems that are difficult to model using traditional mathematical approaches (Mohd Adnan et al. Citation2015).
A study project on banana fibers for acoustic insulation and absorption was conducted with empirical observations as the primary source of data (Singh and Mukhopadhyay Citation2022). Using a fuzzy expert system, predictions were made in an additional study concerning the seam strength of denim (Sarkar, Al Faruque, and Mondal Citation2021). Based on the description above, the current work is a novel idea in which fuzzy logic was used to forecast the NRC of textile composites.
2. Materials and methodology
2.1. Materials
Banana & Glass fibers were used for the preparation of the composite. The banana fiber was prepared from the collected Banana Leaf. The glass fibers were brought from a local market in Khulna City, Bangladesh. Both fibers were entangled in a sheet or web form. A two-part epoxy having a Grade 1 viscosity as per ASTM C881 was used as a binder for manufacturing the composite in this study (Yemam et al. Citation2017). shows the detailed properties of the epoxy resin and hardener.
Table 1. Properties of epoxy resin and hardener.
2.2. Material preparation
2.2.1. Banana fiber preparation
Banana fibers were obtained as strands of continuous fibers. Individualized strands were manually combed with a hair comb to separate partially attached fibers, and to remove the undesirable wooden material. The paralleled and individualized fibers were trimmed to a length of 10 inches. After that, the fibers were weighed and stored for further use. The sorted fibers were then treated with NaOH solution having 3% concentration for about 12 hours (Muralikrishna et al. Citation2020). By weight, the material-to-liquor ratio was kept at 1:5 (Ramesh et al. Citation2014). The treatment procedure was carried out at a temperature of around 25°C (Feng et al. Citation2018). After 12 hours, the fibers were removed from the solution and properly washed with running tap water to remove any traces of alkali. Then, the fibers were dried in a vacuum oven at 60°C until they get a consistent weight and then kept in airtight polyethylene bags.
2.3. Glass fiber preparation
Glass fibers were collected from a local market in Khulna, Bangladesh. They were entangled in a sheet or web form. Glass (E-glass) nonwoven mat was brought from China (Qingdao Fulida Glass Co. Ltd.). After the removal of fibers manually from the sheet, the fibers were given a hot wash at 70°C for 20 minutes with the addition of a wetting agent and sequestering agent for better absorption of the chemicals.
2.4. Preparation of composite
The hybrid composite of banana-glass fiber having different content according to the weight percentage ranging from 0% to 100% were prepared. At the pre-treatment stage, the banana fiber was cut with a length of 12 inches in significant amount and web/sheet form glass fiber was cut with a length of 12 inches and width of 6 inches. The rectangle-shaped 12 × 8 sq. inch mold was cleaned by using a release agent before laying upon the fibers on the mold sheet. Then, the banana fibers were uniformly mixed according to the ratio with glass fibers with the help of a special type of brush. The uniform mixture was flattened pressing by a roller to obtain a specific uniform thickness of the mold. Fabricated samples were of three different thicknesses of 5 mm, 7 mm, and 10 mm. Thickness was controlled by mold height. For the fabrication of the composites, the hand lay-up process was chosen due to its simplicity, low-cost tooling, and wide range of sample sizes. The fabrication technique and parameters were optimized by keeping the 3:1 resin-to-hardener ratio. Also, the composites were gently compressed to squeeze the excess resin during wet conditions. Uniform pressure of 100 Pa was applied. After drying the composites, they were separated from the molds and cured for 24 hours to get the composites hard enough. In this present work, a total of 15 samples had been made with different fiber compositions based on weight percentage. The compositions are given in , and the figures of the composites are shown in .
Figure 1. Composition and thickness of different composites (a. 100% glass (5 mm), b. 100% banana (5 mm), c. 25% banana-75% glass (5 mm), d. 50% banana-50% glass (5 mm), e. 75% banana-25% glass (5 mm), f. 75% banana-25% glass (7 mm), g. 25% banana +75% glass with (7 mm), h. 75% banana-25% glass (10 mm), i. 50% banana-50% glass (10 mm), j. 25% banana-75% glass (10 mm), k. 100% glass (10 mm)).
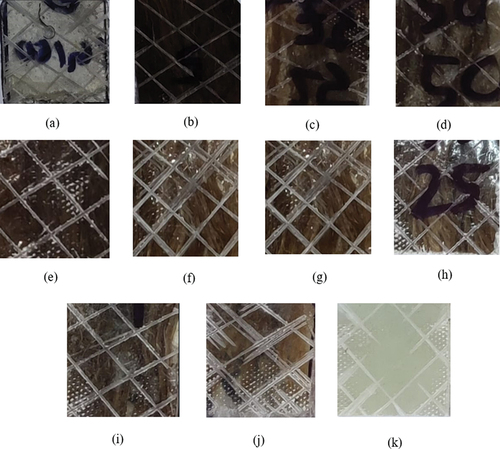
Table 2. Composition of fiber materials and thickness of composites.
2.5. Evaluation of sound measurement
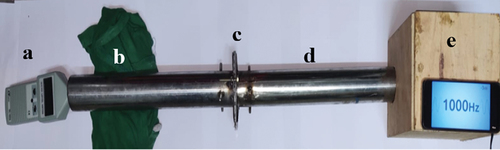
To determine the sound absorbency of the composites, a setup was established containing a sound source, impedance tube, and decibel meter according to ASTM E1050–10 (2010) standard. All the components were connected to initiate the sound absorbency measurement. A composite was kept in the middle of the tube, and the specific intensity, i.e.100 Hz, 500 Hz, 1000 Hz, 1250 Hz, and 1500 Hz, was generated. A decibel meter measured the noise shown in . However, measuring the sound-absorbing capacity is so tedious and time-consuming. To solve this problem, the sound absorbancy capacity is indicated using a single value known as the noise reduction coefficient (NRC). NRC is the arithmetical average of the sound absorption coefficients (α) in the central frequency bands such as 250 Hz, 500 Hz, 1000 Hz, and 2000 Hz, which can be calculated using the following EquationEquation 1(1)
(1) .
Figure 2. Setup for sound absorption measurement (a. decibel meter, b. supporting fabric to reduce vibration, c. composite, d. impedance tube, e. sound source).
2.6. Evaluation of tensile strength of composite
The tensile strength of a material refers to the maximum stress it can bear before it breaks down. Force was increased gradually over the time to the composites to measure how much force it can withstand. Tensile strength varies from material to material. It is measured in megapascals (MPa). The composites’ tensile strengths were tested on Universal Testing Machine (UTM). Composite samples were mounted between the upper and lower crossbar of UTM. Constant rates of load were applied to the testing sample with respect to time. The composite sample size was kept 8” (H) × 2.5” (W) with 65% humidity and 25°C.
2.7. Fourier transform-infrared spectroscopy (FTIR)
FTIR was done to identify the functional groups of the banana-glass fiber composite. The FTIR spectra was recorded by using an ATR-FTIR (Attenuated Total Reflection-Fourier Transform Infrared Spectroscopy) ranging from 400 to 4000 cm−1. Total 20 scans were done for identifying the functional groups of banana, glass, and banana–glass composite. Composite samples were crushed and converted into powder form which was later mixed with KBr powder followed by pressing the mixture into ultra-thin pellets.
2.8. Development of fuzzy model
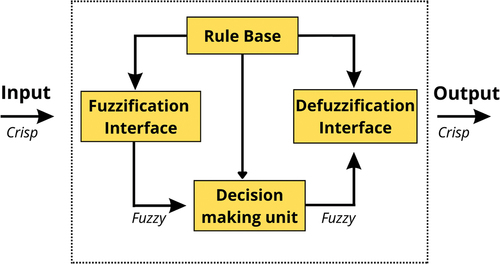
Fuzzy logic system was developed by Zadeh of University of California in 1965 (Gupta Citation2011). The system was adopted worldwide as a successful methodology in various fields of research. The four main components of a fuzzy logic system are shown in . The following are the four basic components of the fuzzy logic system (Larsen Citation1997).
Figure 3. Basic components of fuzzy intelligent system.
2.8.1. Fuzzification interface
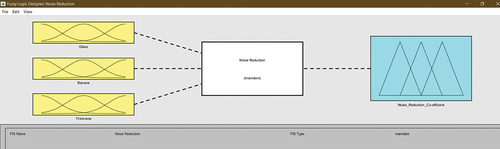
The fuzzification interface is the first block of the fuzzy expert system where the selected input variables are converted into different linguistic terms (Umano, Hatono, and Tamura Citation2002). Different membership functions are represented numerically to quantify the degree to which an element belongs to a set. Three inputs (Glass fiber %, Banana fiber %, and composite thickness) and their effect on the output (NRC) are centrally processed by Mamdani fuzzy interface in . Mamdani explains the complex non-linear relationship between the input and output variables.
Figure 4. Fuzzy inference mechanism for noise reduction coefficient.
2.8.2. Rule bases
There are two types of fuzzy expert rule bases, i.e. Mamdani and Sugeno (Thaker and Nagori Citation2018). In this study, Mamdani rules have been implemented. Fuzzy rules are created according to the input and output variables and are operated by the if-then statement.
2.8.3. Decision-making logic
Decision-making logic plays a major role in the fuzzy logic expert system as it works as human-like decision-making (Improta et al. Citation2020). In this study, we have used the Mamdani max-min fuzzy inference. represents the mechanism of the fuzzy inference system in the case of three inputs and a single output. The Mamdani fuzzy interface works as the central processing unit and plays a key role in explaining the complex non-linear relationship between the input variables and output (Turkdogan-Aydinol and Yetilmezsoy Citation2010).
2.8.4. Defuzzification interface
Defuzzification interface is the final unit in the fuzzy logic expert system. The system converts the final output into precise crisp numeric values along with the conclusions made by the decision-making logic (Jain and Raheja Citation2015). Several types of defuzzification interface, i.e. centroid, center of sum, mean of maxima, and left–right maxima are used (Hussain, Ahmed, and Kim Citation2019). However, the center of gravity (centroid) is the most widely used defuzzification method since it ensures a linear interpolation of the output between the rules as this operator assures a linear interpolation of the output between the rules.
2.8.5. Defuzzification interface
The conversions of fuzzy output into a nonfuzzy crisp value Z can be expressed by using equation (2).
where bi is the position of the singleton and µi is the membership function of i rules.
2.9. Development of the model based on the fuzzy expert system
Three process variables namely banana, glass, and thickness were used as the input parameters and noise reduction coefficient as the output parameter for the construction of the fuzzy logic system. By using a fuzzy logic toolbox from Matlab, the proposed fuzzy model of the noise reduction coefficient (NRC) was developed. For fuzzification, three linguistic fuzzy sets Low (L), Medium (M), and High (H) were chosen for input variables banana, glass, and thickness, they were evenly spaced and covered up the full input ranges. Five output fuzzy sets as Very Low (VL), Low (L), Medium (M), High (H), and Very High (VH) were employed for the noise reduction coefficient, which are presented in .
Table 3. Linguistic fuzzy sets of noise reduction coefficient.
In our current study, the triangular-shaped membership functions were used for both the input and output variables. The result from the triangular-shaped membership functions were found accurate and more precise. Mamdani max-min inference mechanism and the center of gravity defuzzification method have been applied in this research work. Fuzzification of the used factors was performed by EquationEquation (1)(1)
(1) , (Equation4
(4)
(4) ), and (Equation5
(5)
(5) ), respectively.
Where i1 is the first input, i2 is the second input, i3 is the third input, and o1 is the output variable.
Prototype triangular-shaped fuzzy sets for the fuzzy variables were developed using a fuzzy toolbox from MATLAB. The membership values are presented in . In this study, a total of 24 fuzzy rules have been formulated based on expert opinion. The rules are tabulated in .
Figure 5. Membership function of (a) glass, (b) banana, (c) thickness, and (d) noise reduction coefficient (NRC).
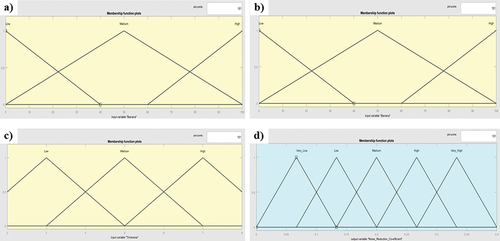
Table 4. Fuzzy rules for noise reduction coefficient.
2.10. Experimental procedure and data acquisition
2.10.1. Validation of prediction accuracy
Three input variables and one output variable are utilized to construct a fuzzy intelligent model to predict the noise reduction coefficient. The input variables are banana fiber composition, glass fiber composition, and thickness, whereas the output variable is the noise reduction coefficient. The observed noise reduction coefficient of 10 samples was correlated with the predicted value using the fuzzy intelligence model to validate the generated model. The coefficient of determination (R2) is then calculated to determine the precision of fuzzy modeling. The prediction accuracy of the developed model has been investigated according to the global prediction errors such as correlation coefficient (R) and coefficient of determination (R2). It is obtained from an excel graph of the correlation between measured and predicted values of noise reduction coefficient.
The formulations of the prediction errors are as follows:
Correlation coefficient = R
Coefficient of determination = R2
Where,
RSS = sum of squares of residuals,
TSS = total sum of squares
Mean Absolute Error (MAE) measures the average magnitude of the errors in a set of predictions, without considering their direction.
Mean Squared Error (MSE) is a statistical measure, which measures the average of the squared differences between the predicted values and the actual values in a dataset.
Root Mean Square Error (RMSE) is a standard way to measure the error of a model in predicting quantitative data (Abimbola Helen, Bolanle, and Samuel Citation2016). Formally, it is defined as follows:
Where,
ŷi is the predicted value
yi is the actual measured value
n is the total number of observations in the dataset
3. Result and discussion
3.1. Fourier transform-infrared spectroscopy (FTIR)
In , FTIR spectrum of glass fiber is shown. Here, the 486 cm−1 and the 771.15 cm−1 IR bands are associated with O-Si-O bending vibrations and the Si-O-Si symmetric stretching vibrations, respectively. The sharp and strong IR band at 1048.12 cm−1 is due to the Si-O-Si asymmetric stretching vibration. The 1641.21 cm−1 and the 3429.22 cm−1 IR bands are due to bending vibrations and stretching vibrations of the water molecule, respectively.
Figure 6. FTIR spectrum of (a) glass fiber, (b) banana fiber, and (c) banana-glass fiber composite.
In the FTIR spectrum of banana fiber , the existence of the C-H stretching in the alkane functional group was identified in the IR band at 2919.12 cm−1. The O=C=O stretching was shown by the frequency of 2377.46 cm−1. The vibration of C=O stretching in the aldehyde group was shown in the IR band at 1713.96 cm−1. Aromatic skeleton vibrations at 1593 cm−1 and 1245 cm−1 confirm the presence of lignin and hemicellulose in the sample.
In , the FTIR spectrum of the banana-glass composite is shown. Here, the FTIR spectrum was characterized by an O-H band at 3564.29 cm−1 and an intense C-H band at 2911.02 cm−1, which are typical vibrations of methoxyl groups. The absorption of carbonyl groups evolved as a band at 1726.98 cm−1. The peaks at 1277.54 cm−1 correspond to C-O with an aromatic ring and the ether bond (-O-) at 1049.91 cm−1. The peak at 879.92 cm−1 indicated the presence of silicon, which was similar to the spectrum found in glass fiber. The epoxy resin structure was indicated by the presence of bands at 3544.73 cm−1 and 1725.16 cm−1. In addition, there was no stretching vibration absorption for the epoxy group at 914 cm−1. All these peaks ensure the presence of banana and glass fiber along with the epoxy resin in the composite.
3.2. Tensile strength test
Different compositions of banana-glass fiber composites were prepared to evaluate tensile strength by using Universal Testing Machine (UTM). The result based on the tensile () represents that the banana fiber and the composite containing a high amount of banana fiber showed very low tensile strength compared to the glass fiber and the composite containing a high amount of glass fiber composites.
Figure 7. Strength test of different fiber composite.
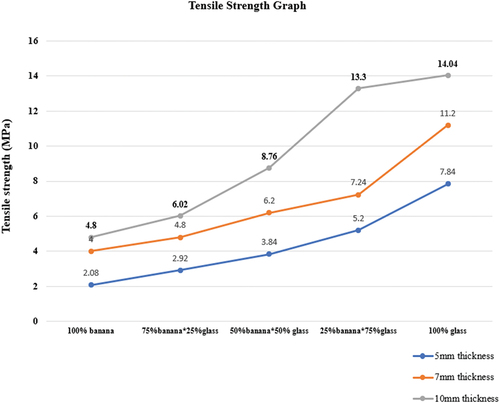
Precisely, it could be claimed that the increment in tensile strength might be achieved with the increment of glass content and thickness of the composite (). It is obvious because the tensile strength depends on various factors, and among them, the amount of glass fiber and thickness are top. It is well known that the higher amount of glass fiber as reinforcing material makes more solid part and solid portion are stronger compared to the same amount of the natural material (Cenna et al. Citation2000). Therefore, the strength of the composite increases with the increment of solid content of synthetic fiber. Similarly, the thickness of the composite influences the composite strength (Jawaid, Abdul Khalil, and Abu Bakar Citation2011). The higher thickness means more reinforcing material and matrix a unit length of the composite.
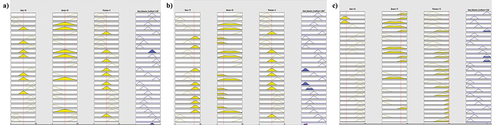
Sound Absorption Coefficient:
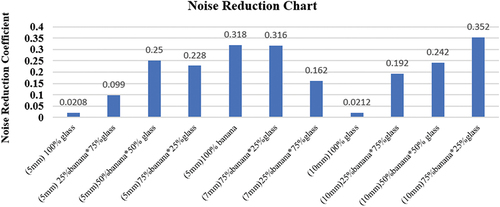
The sound absorption coefficient is a measurement of how well a substance absorbs sound. For different sound bands such as 100 Hz, 500 Hz, 1000 Hz, 1250 Hz, and 1500 Hz, the sound absorption coefficient of each particular combination is measured which is shown in . From the figure, it has been discovered that differing fiber compositions of two distinct fibers exhibit dissimilar properties regarding sound absorption. The composite comprised of 100% banana fiber offers the best sound-absorbing properties. The sound-absorbing capacity of the 100% glass fiber composite is the lowest. However, the 100% banana shows the lowest tensile strength, whereas 100% glass fiber shows the maximum tensile strength (). The composite having more banana fiber content is full of amorphous regions than crystal structure. For which sound insulation property increases and tensile strength reduces due to the pores (Motaleb, Mizan, and Milašius Citation2020). Hence, it is understood that the sound absorption capacity of banana-glass fiber composite is increased with the increment of the percentage of banana fiber.
Figure 8. Noise reduction coefficient of different composites.
3.2.1. Fuzzy logic operation
From the rule viewer of the fuzzy logic model, is one of the important output interfaces of a fuzzy expert system. This interface mainly acts as a tool that is used to select the input parameters for the desired output value. For example, in this interface, if the input parameters are tweaked (Glass and/or Banana and/or Thickness), the output parameter of the noise reduction coefficient will change accordingly and logically. The noise coefficient for 50% glass and 50% banana having 5 mm thickness is 0.267. If the composition of glass fiber, banana fiber, and thickness is 75%, 25%, and 5 mm, respectively, then the noise reduction coefficient is 0.0917 (). However, with increasing the glass fiber composition to 75% and reducing the banana fiber composition to 25%, having 5 mm thickness the noise coefficient is found to be 0.0917. However, when the glass is 25%, the banana is 75% and the thickness is 10, and then the noise reduction coefficient is 0.333 (). This selection is possible for a wide range of input and output data, and this system can respond even with a slight change in the input and output parameters.
Figure 9. Fuzzy Rule viewer of a) 50% Glass, 50% Banana, Thickness 5 mm; b) 75%Glass, 25% Banana, Thickness 5 mm; and c) 25% Glass, 75%Banana, Thickness 10 mm.
Using MATLAB fuzzy toolbox, the fuzzy surface was developed as shown in , which explains the relationship between Glass fiber, Banana Fiber, and Thickness on the input side and noise reduction coefficient on the output side. It is evident from the figure that the relation between any of the individual inputs (glass/banana/thickness) and output (noise reduction coefficient) can be interpreted. Importantly, the complex relationships between both the inputs (glass/banana/thickness) and output (noise reduction coefficient) can also be established. It is clear from the figure that, with the increment of Banana and Thickness, the output increases. However, the output noise reduction coefficient decreases with the increase of Glass. With the help of the rule viewer (), the crisp values in every point of the complex mesh structure can be numerically calculated. This mesh plot depicts the dynamic operation of the fuzzy logic system over time.
Figure 10. Surface viewer for noise reduction coefficient.
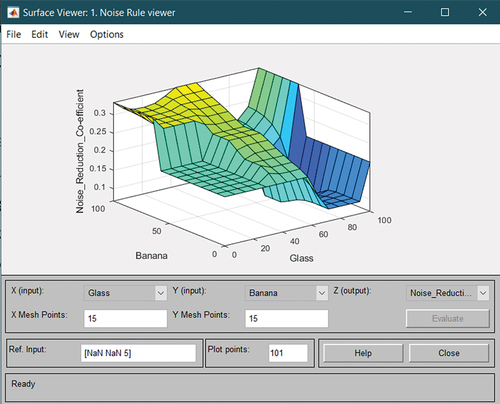
Moreover, this model could be able to detect a very small-scale change in the noise reduction coefficient when the banana and/or glass and/or thickness changes. As the noise reduction coefficient is one of the top parameters because it determines how much quieter an acoustic product can be. As this model can suggest the optimum input parameters, hence, it is possible to suggest that the required glass, banana, and the thickness of the composite should have to be chosen to achieve the optimum noise reduction coefficient while maintaining the required tensile strength.
3.3. Validation of noise reduction coefficient prediction
The suitability and fit of the developed model have been exclusively assessed by using experimental data. The obtained experimental results were compared with the predicted results obtained from the Fuzzy Logic Expert System (FLES) model. Then, Mean Relative Error (%), the coefficient of determination (R2), Mean Absolute Error (MAE), Mean Squared Error (MSE), and Root Mean Square Error (RMSE) were calculated to check the compatibility of the results. The total comparison of the actual and predicted results is presented in . The correlation between the FLES model predicted and the experimental/actual values of noise reduction coefficient using different composition percentages of Banana and Glass and thickness is presented in .
Figure 11. Correlation between measured and predicted values of noise reduction coefficient by fuzzy logic model.
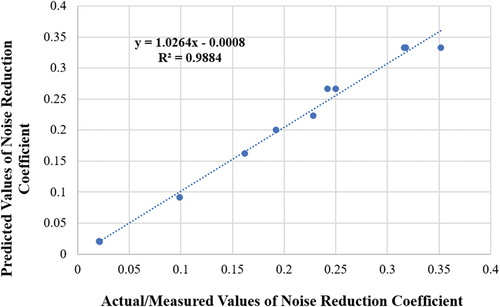
Table 5. Comparison of actual and predicted values of noise reduction coefficient.
The Coefficient of Determination (R2) was found to be 0.9884 (R = 0.9941). Hence, it can be assumed that the predicted model can explain up to 99% of the total change in noise reduction coefficient as a result of the change in the composition of banana and Glass and thickness of the composite.
4. Conclusion
In this research work, the fabrication procedure, sound absorption properties, and mechanical properties of banana-glass fiber reinforced different types of composites were studied. Mechanical properties like tensile strength are investigated in the composites made by hand layout technique. Results showed that only glass composite exhibits superior tensile strength than banana-glass reinforced composite and banana-only composite. However, a high percentage of Banana fiber in the composite showed a high noise reduction capacity compared to the composite having high glass fiber. By analyzing the experimental study and developed model, it is eminent that Banana %, Glass%, and thickness directly possess an effect on the noise reduction coefficient of the composites. The experimental and model-predicted results were compared, and the prediction accuracy of the developed model was assessed by calculating the coefficient of determination, correlation coefficient, Mean Relative Error (%), Mean Absolute Error (MAE), Mean Squared Error (MSE), and Root Mean Square Error (RMSE).
The major outcomes of the study have been summarized below.
The sound absorption coefficient was found maximum for 75% banana *25% glass with 10 mm thickness.
Composite exhibits superior tensile strength when glass fiber composition 100% and 10 mm thickness
The Mean Relative Error between the predicted values and experimental values of noise reduction coefficient (NRC) was found to be 4.81%, which is lower than the acceptable limit of 5%. Also, the Mean Absolute Error (MAE), Mean Squared Error (MSE), and Root Mean Square Error (RMSE) were found to be 0.0104, 0.0002, and 0.0141, respectively. These findings suggest that the developed model is suitable for predicting the noise reduction coefficient (NRC) with satisfactory accuracy.
The correlation coefficient (R) and the Co-efficient of determination (R2) were found to be 0.99 and 0.9884, respectively, which indicated a good fit of the model data with experimental data and hence suggests that the model is well compatible.
Finally, it can be concluded that the developed fuzzy model can be used in the development of sound-insulating composites considering the sound absorption capacity and tensile properties of constituents. Therefore, we believe that this method is super convenient to predict the noise reduction coefficient (NRC) of the composite with response to the prediction accuracy results such as Coefficient of determination (R2), correlation coefficient (R), Mean Absolute Error (MAE), Mean Squared Error (MSE), and Root Mean Square Error (RMSE).
Highlights
Banana-glass fiber composites were developed by hand lay-up process having different percentages of them.
Different sound frequencies were employed to evaluate the noise reduction capacity of the composites.
Tensile strength of the composite was maximum for 100% glass fiber with increased thickness.
The sound absorption coefficient was found optimum for 75% banana & 25% glass with higher thickness.
A fuzzy model was developed to predict the noise reduction coefficient, where the coefficient of determination was found to be around 99%.
Disclosure statement
No potential conflict of interest was reported by the authors.
References
- Abimbola Helen, A., O. A. Bolanle, and F. O. Samuel. 2016. Comparative analysis of rainfall prediction models using neural network and fuzzy logic. International Journal of Soft Computing and Engineering (IJSCE) 6:2231–17.
- Adesina, O. T., T. Jamiru, E. R. Sadiku, O. F. Ogunbiyi, and L. W. Beneke. 2019. Mechanical evaluation of hybrid natural fibre–reinforced polymeric composites for automotive bumper beam: A review. International Journal of Advanced Manufacturing Technology 103 (5–8):1781–97. doi:10.1007/s00170-019-03638-w.
- Amir, S. M. M., M. T. H. Sultan, M. Jawaid, A. H. Ariffin, S. Mohd, K. A. M. Salleh, M. R. Ishak, and A. U. Md Shah. 2018. Nondestructive testing method for Kevlar and natural fiber and their hybrid composites. Durability and Life Prediction in Biocomposites, Fibre-Reinforced Composites and Hybrid Composites 367–88. doi:10.1016/B978-0-08-102290-0.00016-7.
- Bhat, G., and M. E. Messiry. 2020. Effect of microfiber layers on acoustical absorptive properties of nonwoven fabrics. Journal of Industrial Textiles 50 (3):312–32. doi:10.1177/1528083719830146.
- Cao, L., Q. Fu, Y. Si, B. Ding, and J. Yu. 2018. Porous materials for sound absorption. Composites Communications 10 (May):25–35. doi:10.1016/j.coco.2018.05.001.
- Castillo, O., P. Melin, J. Kacprzyk, and W. Pedrycz (2008). Type-2 fuzzy logic: Theory and applications 145. 10.1109/grc.2007.118
- Cenna, A. A., J. Doyle, N. W. Page, A. Beehag, and P. Dastoor. 2000. Wear mechanisms in polymer matrix composites abraded by bulk solids. Wear 240 (1–2):207–14. doi:10.1016/S0043-1648(00)00365-3.
- Faruk, O., A. K. Bledzki, H. P. Fink, and M. Sain. 2014. Progress report on natural fiber reinforced composites. Macromolecular Materials and Engineering 299 (1):9–26. doi:10.1002/mame.201300008.
- Feng, A., Z. Jia, Q. Yu, H. Zhang, and G. Wu. 2018. Preparation and characterization of carbon nanotubes/carbon fiber/phenolic composites on mechanical and thermal conductivity properties. Nano 13 (4):1–10. doi:10.1142/S1793292018500376.
- Flores Medina, N., D. Flores-Medina, and F. Hernández-Olivares. 2016. Influence of fibers partially coated with rubber from tire recycling as aggregate on the acoustical properties of rubberized concrete. Construction and Building Materials 129:25–36. doi:10.1016/j.conbuildmat.2016.11.007.
- Gupta, M. M. 2011. Forty-five years of fuzzy sets and fuzzy logic-A tribute to professor Lotfi A. Zadeh (the father of fuzzy logic). Scientia Iranica 18 (3 D):685–90. doi:10.1016/j.scient.2011.04.023.
- Gupta, C., A. Jain, and N. Joshi. 2018. Fuzzy logic in natural language processing - a closer view. Procedia computer science 132:1375–84. doi:10.1016/j.procs.2018.05.052.
- Hodgson, A. A. 1993. Industrial fibres: A technical and commercial review. The Annals of Occupational Hygiene 37 (2):203–10. doi:10.1093/annhyg/37.2.203.
- Hussain, S., M. A. Ahmed, and Y. C. Kim. 2019. Efficient power management algorithm based on fuzzy logic inference for electric vehicles parking lot. IEEE Access 7:65467–85. doi:10.1109/ACCESS.2019.2917297.
- Improta, G., V. Mazzella, D. Vecchione, S. Santini, and M. Triassi. 2020. Fuzzy logic–based clinical decision support system for the evaluation of renal function in post-transplant patients. Journal of Evaluation in Clinical Practice 26 (4):1224–34. doi:10.1111/jep.13302.
- Jain, V., and S. Raheja. 2015. Improving the prediction rate of diabetes using fuzzy expert system. International Journal of Information Technology and Computer Science 7 (10):84–91. doi:10.5815/ijitcs.2015.10.10.
- Jawaid, M., H. P. S. Abdul Khalil, and A. Abu Bakar. 2011. Woven hybrid composites: Tensile and flexural properties of oil palm-woven jute fibres based epoxy composites. Materials Science and Engineering: A 528 (15):5190–95. doi:10.1016/j.msea.2011.03.047.
- Khalid, M. Y., A. Al Rashid, Z. U. Arif, W. Ahmed, H. Arshad, and A. A. Zaidi. 2021. Natural fiber reinforced composites: Sustainable materials for emerging applications. Results in Engineering 11 (April):100263. doi:10.1016/j.rineng.2021.100263.
- Khalid, M. Y., A. Al Rashid, Z. U. Arif, M. F. Sheikh, H. Arshad, and M. A. Nasir. 2021. Tensile strength evaluation of glass/jute fibers reinforced composites: An experimental and numerical approach. Results in Engineering 10 (May):100232. doi:10.1016/j.rineng.2021.100232.
- Khalid, M. Y., Z. U. Arif, M. F. Sheikh, and M. A. Nasir. 2021. Mechanical characterization of glass and jute fiber-based hybrid composites fabricated through compression molding technique. International Journal of Material Forming 14 (5):1085–95. doi:10.1007/s12289-021-01624-w.
- Khalid, M. Y., R. Imran, Z. U. Arif, N. Akram, H. Arshad, A. A. Rashid, and F. P. G. Márquez. 2021. Developments in chemical treatments, manufacturing techniques and potential applications of natural-fibers-based biodegradable composites. Coatings 11 (3):1–18. doi:10.3390/coatings11030293.
- Khalid, M. Y., A. A. Rashid, Z. U. Arif, N. Akram, H. Arshad, and F. P. G. Márquez. 2021. Characterization of failure strain in fiber reinforced composites: Under on-axis and off-axis loading. Crystals 11 (2):1–11. doi:10.3390/cryst11020216.
- Konings, A., L. Van Laer, and G. Van Camp. 2009. Genetic studies on noise-induced hearing loss: A review. Ear and Hearing 30 (2):151–59. doi:10.1097/AUD.0b013e3181987080.
- Larsen, H. L. 1997. Fundamentals of fuzzy sets and fuzzy logic. AAUE Computer Science 1:1–8. http://citeseerx.ist.psu.edu/viewdoc/download?doi=10.1.1.94.3978&rep=rep1&type=pdf.
- Lipworth, L., C. La Vecchia, C. Bosetti, and J. K. McLaughlin. 2009. Occupational exposure to rock wool and glass wool and risk of cancers of the lung and the head and neck: A systematic review and meta-analysis. Journal of Occupational and Environmental Medicine 51 (9):1075–87. doi:10.1097/JOM.0b013e3181b35125.
- Magill, J. D., K. Midden, J. Groninger, and M. Therrell (2011). A history and definition of green roof technology with recommendations for future research. Department of Plant, Soil, and Agricultural Systems in the Graduate School, Master of, 62. http://opensiuc.lib.siu.edu/cgi/viewcontent.cgi?article=1132&context=gs_rp&sei-redir=1&referer=http://www.google.com.my/url?sa=t&rct=j&q=A+HISTORY+AND+DEFINITION+OF+GREEN+ROOF+TECHNOLOGY+WITH+RECOMMENDATIONS+FOR+FUTURE+RESEARCH&source=web&cd=1&ved=0CB4QFj
- Mohd Adnan, M. R. H., A. Sarkheyli, A. Mohd Zain, and H. Haron. 2015. Fuzzy logic for modeling machining process: A review. Artificial Intelligence Review 43 (3):345–79. doi:10.1007/s10462-012-9381-8.
- Mondal, M. S., J. Sarkar, N. Hasan, H. A. Mehedi, and P. Dutta. 2022. Development of Recycled Natural Fiber Based Composite Material by Hand Lay-Up Process and Analysis of Its Acoustic & Physical Properties. Journal of Natural Fibers 19 (16):14898–908. doi:10.1080/15440478.2022.2069193.
- Motaleb, K. Z. M. A., R. A. Mizan, and R. Milašius. 2020. Development and characterization of eco-sustainable banana fiber nonwoven material: Surface treatment, water absorbency and mechanical properties. Cellulose 27 (14):7889–900. doi:10.1007/s10570-020-03343-y.
- Muralikrishna, M. V. V., T. S. A. Surya Kumari, R. Gopi, and G. B. Loganathan. 2020. Development of mechanical properties in banana fiber composite. Materials Today: Proceedings 22 (xxxx):541–45. doi:10.1016/j.matpr.2019.08.189.
- Na, Y., T. Agnhage, and G. Cho. 2012. Sound absorption of multiple layers of nanofiber webs and the comparison of measuring methods for sound absorption coefficients. Fibers and Polymers 13 (10):1348–52. doi:10.1007/s12221-012-1348-5.
- Nan, C. W., Y. Shen, and J. Ma. 2010. Physical properties of composites near percolation. Annual Review of Materials Research 40 (August 2015):131–51. doi:10.1146/annurev-matsci-070909-104529.
- Ramesh, M., T. Sri Ananda Atreya, U. S. Aswin, H. Eashwar, and C. Deepa. 2014. Processing and mechanical property evaluation of banana fiber reinforced polymer composites. Procedia Engineering 97:563–72. doi:10.1016/j.proeng.2014.12.284.
- Sarkar, J., M. A. Al Faruque, and M. S. Mondal. 2021. Modeling the seam strength of denim garments by using fuzzy expert system. Journal of Engineered Fibers and Fabrics 16. doi:10.1177/1558925021988976.
- Sela, S. K., A. K. M. Nayab-Ul-Hossain, N. Hasan, S. Z. Hussain, and S. Sadman. 2020. Surface modification and qualitative natural coloring of raw jute to reduce electrical resistance and induce anti-microbial properties. Applied Surface Science Advances 1 (April):100018. doi:10.1016/j.apsadv.2020.100018.
- Singh, V. K., and S. Mukhopadhyay. 2022. Banana fibre-based structures for acoustic insulation and absorption. Journal of Industrial Textiles 51 (9):1355–75. doi:10.1177/1528083720901823.
- Smith, P., and E. H. Twizell. 1980. A finite element model of temperature distribution in the human torso. Applied Mathematical Modelling 4 (3). doi: 10.1016/0307-904X(80)90124-9.
- Sun, Y., Y. Chu, W. Wu, and H. Xiao. 2021. Nanocellulose-based lightweight porous materials: A review. Carbohydrate Polymers 255:117489. doi:10.1016/j.carbpol.2020.117489.
- Thaker, S., and V. Nagori. 2018. Analysis of fuzzification process in fuzzy expert system. Procedia computer science 132:1308–16. doi:10.1016/j.procs.2018.05.047.
- Turkdogan-Aydinol, F. I., and K. Yetilmezsoy. 2010. A fuzzy-logic-based model to predict biogas and methane production rates in a pilot-scale mesophilic UASB reactor treating molasses wastewater. Journal of Hazardous Materials 182 (1–3):460–71. doi:10.1016/j.jhazmat.2010.06.054.
- Umano, M., I. Hatono, and H. Tamura (2002). Fuzzy expert system shells 219–25. 10.1109/tai.1994.346492
- van Kamp, I., and H. Davies (2008). Environmental noise and mental health: Five year review and future directions. Noise as a Public Health Problem. Proceedings of 9th Congress of the International Commission on the Biological Effects of Noise (ICBEN), Foxwoods, CT, USA, 295–301.
- Yemam, D. M., B. J. Kim, J. Y. Moon, and C. Yi. 2017. Mechanical properties of epoxy resin mortar with sand washing waste as filler. Materials 10 (3):246. doi:10.3390/ma10030246.