
ABSTRACT
This study examines the impact of temperature and humidity on cotton fiber quality during initial processing. Conducted in a Xinjiang cotton ginning mill, we used the USTER HVI1000 to analyze five quality indices: upper half mean length, uniformity, short fiber index, tensile strength, and elongation. Results indicated that temperatures below 13°C increased fiber brittleness, moisture, and significantly reduced length and strength. Optimal conditions were observed at temperatures between 13°C to 20°C with normal humidity, where length and strength were maintained. Above 20°C, the dry environment led to a decrease in these indices. While higher temperatures and lower humidity helped remove impurities and lessen cotton knots, relative humidity below 45% increased static electricity and knots. Despite data limitations, this study moves towards identifying optimal temperature and humidity levels for improving cotton quality during initial processing, providing a theoretical foundation for future enhancements.
摘要
研究了棉花初加工过程中温度和湿度对棉花纤维各项质量指标的影响. 在新疆某轧棉厂进行了广泛的跟踪试验和取样,采用USTERHVI1000大容量棉纤维测试仪对棉花样品的上半部分平均长度、整齐度、短纤维指数、断裂强力比和断裂伸长率五项指标进行了测试和分析. 结果表明,当轧棉环境温度低于1℃3℃时,轧棉后棉纤维脆性增加,表面潮湿,长度和强度指标显著下降. 当轧棉环境温度在3℃~10℃之间时,相对湿度正常,轧棉后棉花的长度和强度指标相对较好. 然而,当轧棉环境温度超过10℃时,环境变得干燥,棉花的长度和强度指标再次呈下降趋势. 较高的温度和较低的相对湿度有利于去除杂质,减少棉花结的形成,但当相对湿度降至45%以下时,会产生静电,棉花结的数量有增加的趋势. 目前,由于数据的限制,无法获得最准确的数据,但随着实验数据的增加,我们将对温度和湿度有更准确的了解,这有助于提高棉花在初始加工过程中的质量. 这将为提高棉纤维初加工的各项指标提供理论依据.
Xinjiang, as the main cotton-producing region in China, has seen its proportion of the national total cotton output continuously increasing since 2010. In 2018 and 2020, the output of Xinjiang cotton accounted for 83.8% and 87.3% of the national total output, respectively (China Fiber Inspection Bureau Citation2009, Citation2018). Despite the widespread use of mechanical cotton-picking technology in Xinjiang, there remains a certain gap in fiber quality compared to imported cotton. Therefore, improving the quality of Xinjiang cotton is crucial for enhancing the competitiveness of the industry chain.
The initial processing of Xinjiang cotton usually takes place from October each year to January of the following year, during which the workshop temperature and humidity are greatly affected by the outdoor environment, and sealing measures are usually not adopted (Cao, Xu, and Xie Citation2019). During this stage, the temperature fluctuates between −10°C and 25°C, and the workshop temperature is below 10°C for 2/3 of the time. Low temperatures often accompany high humidity, which significantly impacts cotton fiber performance. In a low temperature and high humidity environment, cotton knots and slivers are easily produced during the processing, and it is not conducive to impurity removal. This study aims to measure the temperature and humidity during each process of the initial cotton processing and take samples, analyze the degree of impact of temperature, humidity, and regain rate on the appearance quality of cotton (such as cotton knots, impurities, and color grade), providing a theoretical basis for the improvement of the ginning process and equipment.
Sampling
Sampling arrangement
Sampling dates
From October 12, 2020 to December 10, 2020, and from October 20, 2021 to December 1, 2021.
Sampling location: A ginning mill in northern Xinjiang.
Sampling method and temperature and humidity testing: Firstly, about 1 kg of cotton sample is collected at the cotton feeding mouth (automatic cotton feeder), then about 1 kg of samples are similarly collected 30s-60s later at the second duplex seed cotton cleaner (hereinafter referred to as seed cleaner), duplex sawtooth gin, air-flow lint cleaner (hereinafter referred to as lint cleaner), and sawtooth gin respectively, and the temperature and humidity of the sampling mouth, workshop, and outdoor environment are measured.
Sampling variety: Mechanically picked fine staple cotton
Cotton sample production process
Cotton bale → cotton feeding mouth → heavy impurity cleaner → first drying tower → discharge type cotton leaf cleaner → first duplex seed cleaner (upper cleaner + lifting cleaner + lower cleaner) → second drying tower → second duplex seed cleaner (upper cleaner + lifting cleaner + lower cleaner) → duplex sawtooth gin → air-flow lint cleaner → sawtooth lint cleaner → baler.
Note: No sample was taken from the first duplex seed cleaner because there was no suitable cotton intake.
Experimental apparatus and testing
Experimental apparatus
Experimental apparatus: Temperature and humidity detection box (self-made), XJ130 cotton regain rate tester, USTER AFIS-PRO2 tester, electronic balance, USTER HVI1000 large capacity fiber tester.
Data testing and research indicators
Regain rate, temperature and humidity test at each stage:
Measure the temperature and humidity at each stage and immediately take samples to the laboratory for determining the regain rate of cotton at each stage using the cotton regain rate tester. Each link tests 10 times and takes the average.
Testing of various fiber properties:
Grab 100 g-200 g samples from each cotton sample, bring the grabbed cotton samples to the textile factory laboratory for temperature and humidity balance, and use the USTER HVI1000 large capacity fiber tester for the full set of indicators of the cotton sample’s length, strength, fineness, color features, impurities, etc. Each sample tests 4 times, each group of samples tests 10 times, and takes the average.
Note: To protect the equipment, large impurities such as cotton stalks and cotton shells have been manually removed before the test. The testing and analysis here mainly focus on the tiny impurities in the fiber.
Cotton knot test:
Because the cotton knot has a big impact on the quality of textiles, we use AFIS to test the cotton knots in the cotton samples separately.
Selection of analysis indicators:
In the early research, we found that there was no obvious and regular relationship between the fineness index (Micronaire value and maturity coefficient) and color characteristic index (yellowness and reflectance) of lint and the environmental temperature and humidity. Therefore, we do not discuss them here.
Results and analysis
Correlation analysis of temperature, humidity and regain rate
In order to explore the relationship between temperature, humidity, and regain rate, this study tested the temperature and humidity of the outdoor, workshop, and sampling mouths of each processing step, and the regain rate of lint at each step after ginning. The test results are shown in . Based on the data, we classified the temperature in 5°C intervals and sorted the data in the order of the cotton processing flow.
Table 1. Temperature and humidity inside and outside the workshop and at each process cotton picking point, as well as the moisture regain rate of seed cotton.
From , we can observe that relative humidity varies with temperature changes. As the temperature drops, relative humidity rises. Over two months, the ambient temperature dropped by about 20°C, while the relative humidity increased by about 40% points. The temperature and humidity fluctuated in response to outdoor temperature and humidity fluctuations. The workshop temperature was 1 to 3°C higher than outside, with an increase of 1 to 2°C in the fall and 2 to 3°C in the winter. The workshop’s relative humidity was 2 to 12% points lower than outside, about 2 to 5% points lower in autumn and about 10% points lower in winter. This shows that the difference in temperature and humidity between the workshop and the outdoors in autumn is smaller than in winter.
There were temperature differences among the various stages sampled at the same time. However, the temperatures of the sampling points in the three stages of calendaring, air flow skin cleaning, and sawtooth skin cleaning were very close, all about 2°C higher than in the workshop. This is mainly due to the good insulating effect of cotton and the residual heat from the cotton baking process. When the workshop temperature was −8.4°C, the temperature of the sawtooth skin cleaning process was lower than the flower feeding port, but higher at other times. This suggests that when the ambient temperature is low, with the loosening of cotton fibers and the entry of cold air around, the residual heat from cotton baking is no longer retained.
Relative humidity showed a decreasing trend during the processing, dropping about 20% points from the flower feeding mouth to the sawtooth skin cleaning process. In addition, the relative humidity in the sawtooth skin cleaning stage was 4 to 7% points lower than in the workshop, mainly because some moisture was carried away and discharged by the airflow during the transportation process. Under low temperature conditions, the moisture regain rate of lint cotton in these three processes increased as the process continued, indicating that the cotton was in a moisture-absorbing state. In this case, the lint cotton showed an “inner dry, outer wet” state, and the moist surface could easily cause a large number of cotton knots and rovings during processing, which would affect the processing quality of lint cotton and is not conducive to processing.However, under higher temperature conditions, the moisture regain rate of lint cotton in these three processes showed a downward trend, indicating that the lint cotton was in a moisture-releasing state (Zhang et al. Citation2022). At this time, the air was relatively dry, the surface of cotton fibers was relatively dry, which was conducive to impurity removal. However, if the air is too dry, such as when the relative humidity is below 45%, it may affect the processing quality of lint cotton due to static electricity issues (Xu Citation1997).
Correlation analysis between HVI indicators and temperature and humidity
Analysis method
In the cotton processing process, both the regain rate and environmental temperature and humidity have a significant impact on processing quality (Cao et al. Citation2021). However, due to the challenges of current data collection and limitations in the volume of data, it is difficult for us to fully discover significant patterns between these factors from multiple angles. In the calendaring factory where sampling was carried out this time, the regain rate of cotton was well controlled with little fluctuation. In addition, from the temperature and humidity tables presented earlier, it was observed that the relative humidity of the air is largely influenced by temperature. Therefore, in order to carry out as accurate analysis as possible, we choose to use temperature as a comprehensive indicator of these three factors (regain rate, humidity, and temperature) and make it our dependent variable.
Due to the limited amount of data, it is impossible to directly draw a non-linear trend between temperature and quality indicators. To solve this problem, we will use a multilayer perceptron (MLP) to capture the non-linear relationship between the independent variable (temperature) and the dependent variable (such as length and strength indicators). First, we will carry out appropriate preprocessing on the data, including dealing with missing values and feature scaling, etc. Then, we set suitable model parameters according to the problem and data characteristics, such as the number of hidden layers, the number of neurons in each hidden layer, activation functions, and optimizers, etc.
We will train the multilayer perceptron model using the training set, adjusting network weights automatically to minimize prediction errors. After the model training is completed, we will use the test set to evaluate the model’s accuracy. This will involve calculating various performance indicators, such as R2 value, mean square error (MSE), root mean square error (RMSE), and mean absolute error (MAE), to ensure the model has good predictive ability. Once the model accuracy has been verified, we will use the well-trained multilayer perceptron model to generate data, and create scatter plots with smooth curves based on the generated data. These scatter plots will intuitively show the non-linear relationship between temperature and quality indicators such as cotton length and strength. In this way, we can gain a deeper understanding of the impact of temperature on cotton processing quality and provide valuable references for practical applications.
Establishment of the multilayer perceptron model
Given the small scale of our data, we paid special attention to avoiding overfitting when selecting the model and adjusting parameters. Firstly, we divided the dataset into a training set and a test set, and preprocessed the data, including dealing with missing values and feature scaling. Then, we implemented the multilayer perceptron regression using the MLPRegressor class in the scikit-learn library in Python.
In order to find suitable model parameters, we tried different hidden layer structures, activation functions, and optimizers. We evaluated the performance of the model under different parameter combinations using the cross-validation method, thereby determining the optimal parameter settings. The final selected model has one hidden layer, containing 10 neurons, and uses the ReLU activation function as well as the lbfgs optimizer.
After determining the parameter settings, we fitted the model using the training set. During this process, the model automatically adjusted weights to minimize prediction errors. Then, we evaluated the model’s performance using the test set and calculated relevant evaluation indicators such as R2 value, MSE, RMSE, and MAE. The final model performed well, with high accuracy and goodness of fit.
Analysis results
Relationship between temperature and average length of the upper half of cotton (en)
“Based on the results of cross-validation, the average Mean Squared Error (MSE) and other key statistics of the model are as follows:
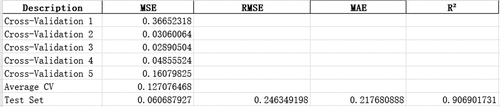
The coefficient of determination R2 of the model is 0.9069017308507582, indicating high predictive performance.”
According to the model’s predictions, we find that the average length of the upper half of the cotton exhibits a trend of first increasing and then decreasing with temperature (see ). When the temperature drops to 0°C or below, the cotton is in a high-humidity state. The strength of cotton fibers increases, but at the same time, the binding force between the base of the fiber and the cottonseed also increases, making it difficult to roll the cotton, and low temperature also reduces the flexibility of the cotton fibers and increases their brittleness. Especially below −5°C, there may be problems such as ice crystal rupture and fiber puncturing, leading to a decrease in the average length of the upper half of the cotton. When the ambient temperature drops to −8.1°C, due to freezing, humidity, and other reasons, the physical and mechanical properties of cotton fibers are poor, fibers tend to tangle, and mechanical tearing results in the smallest average length of the upper half of the cotton.
Figure 1. The relationship between environmental temperature and the average length of the upper part of cotton.
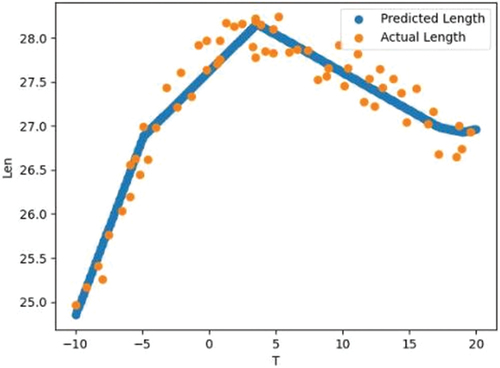
In the temperature range of 3°C to 10°C, the relative humidity of the environment is in the normal range, at which time the average length of the upper half of the cotton is larger. However, when the temperature rises to 16.4°C, the relative humidity of the environment is lower. The dry environment makes the surface of cotton fibers brittle, and with the increase of the rolling speed, the average length of the upper half decreases.
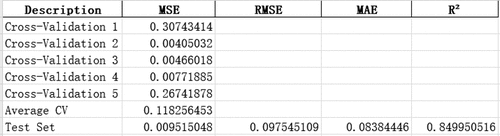
The R2 value indicates that the model can explain nearly 85% of the variation in the cotton’s short fiber index, showcasing its excellent predictive power.
reveals the impact of temperature on the short fiber index. Below 0°C, the short fiber index significantly increases with the decrease in temperature, especially after −5°C, the increase is even more prominent. This situation may be the result of factors such as fiber entanglement caused by low-temperature humidity, the decrease in cotton fiber flexibility and the increase in brittleness caused by low temperature, and the possible fiber injuries caused by ice crystal rupture. Above 0°C, with the rise in temperature, the short fiber index shows slow growth, which is mainly caused by the increase in ginning speed. However, when the temperature rises above 15°C, entering the dry zone, the strength of cotton fibers decreases to an appropriate level as the moisture regain rate decreases, thus leading to a tendency for the short fiber content to decrease.
Figure 2. The relationship between environmental temperature and cotton fiber short fiber index.
Based on the cross-validation results of the multilayer perceptron model, the performance metrics for each fold and the overall test set are outlined in the table below:
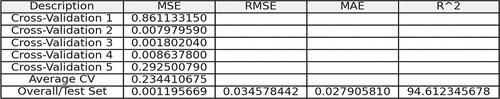
The R2 value indicates that the model can explain nearly 96% of the variability in cotton’s tensile strength ratio, demonstrating its good predictive ability.
shows that the tensile strength ratio of cotton fibers increases with temperature. When the temperature is below about −2°C, the relative humidity is high, generally above 75%, making the cotton fibers more likely to entangle. Additionally, the binding force between the fiber base and the cottonseed increases, which complicates the ginning process. When the temperature drops even lower, ice crystals can form in the cotton fibers, damaging them and leading to the lowest tensile strength ratio. As the temperature ranges from −2°C to 15°C, the relative humidity remains within a normal range, and the moisture regain rate fluctuates slightly with the temperature increase, thus the tensile strength ratio of the cotton fibers increases with temperature. When the temperature is above 15°C, on one hand, the reduction in the cotton fibers’ flexibility and brittleness results in less damage to the cotton, and on the other hand, due to the lower relative humidity, the decrease in the moisture regain rate and the increase in ginning speed lead to a more gentle rise in the strength of the cotton fibers. The combined effect of these factors results in a slight upward fluctuation in the tensile strength ratio of the cotton fibers.
Figure 3. The relationship between environmental temperature and the tensile strength of cotton.
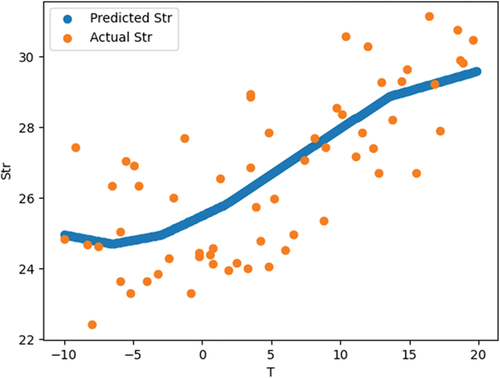
Figure 4. The relationship between environmental temperature and the elongation at break of cotton fibers.
According to our multilayer perceptron model, the performance metrics for each fold and the overall test set are summarized in the table below:
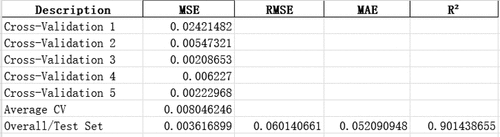
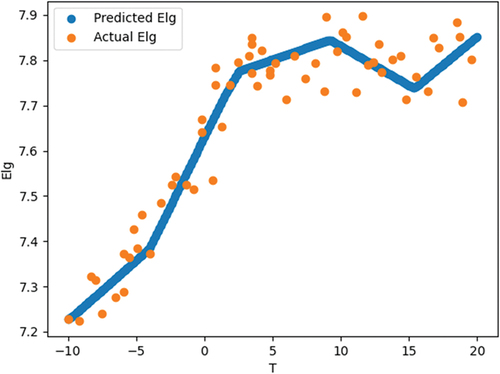
The R2 score indicates that the model can explain about 90.14% of the data variability, demonstrating relatively good predictive performance.
According to analysis, When the temperature is around 2°C or lower, the relative humidity of the environment is high, and the moisture regain rate of cotton fibers is higher, which, along with the entanglement between fibers, results in a lower rate of elongation at break for cotton fibers. When the temperature is between 3°C and 10°C, the relative humidity is within the normal range, so the elongation at break of cotton fibers increases. When the temperature exceeds 10°C, the relative humidity is lower (around 40%), and the moisture regain rate of cotton fibers is lower. Drying causes the elongation at break of cotton fibers to decrease. Near 15°C, there is a scatter point far from the regression curve. Upon reviewing the data corresponding to the ginning machine speed, it was found to be higher than the average speed of the ginning machine during that period, which might be the reason for the lower data at this point.
When studying the relationship between environmental temperature and seed cotton impurities, the model score calculated using the model is only 0.132664, indicating that environmental temperature is not the main determinant of impurities. Analysis from the shows that 58%~76% of the impurities are removed during the seed cleaning process, and as the number of process paths increases, the number of impurities in each process continues to decrease. Looking at the temperature and humidity in the workshop, as the temperature decreases and the relative humidity increases, the overall impurity cleaning efficiency is increasing, from 78.3% to 86.5%.
Table 2. Test results of cotton impurities under different workshop temperature, humidity, and ginning machine speed.
Data shows that the lower the temperature, the better the impurity cleaning effect, which is different from our understanding of the general rule, which is that as the environmental temperature decreases and the relative humidity increases, the impurity removal effect will decrease, especially when the temperature reaches below 0°C. However, by observing the cotton baking temperature in , we found that the cotton baking temperature of this factory increases as the workshop temperature decreases, so we believe that the cotton baking temperature is the main factor affecting the impurity cleaning effect, and the environmental temperature and humidity are secondary influencing factors.
Analysis of temperature and cotton knot index in each process
Figure 5. Growth rate of cotton bolls.
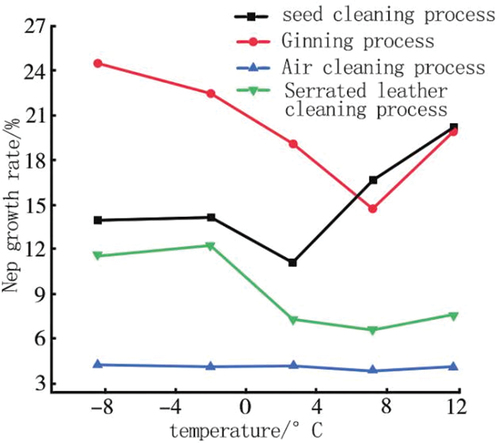
As can be observed from , as the process flow increases, the number of cotton knots continues to rise, but the growth rate varies under different temperature and humidity conditions. At 11.8°C, the growth rate of cotton knots is higher. The main reason is that the relative humidity in the workshop is lower at this time, with an average value of less than 45%, and about 40% inside the machine. In this dry environment and with a lower fiber regain rate, static electricity is easily generated, and at this time the roller speed is at its highest point, enhancing the mechanical force. Below 0°C, the growth rate of cotton knots is also high. This is mainly because the relative humidity in the workshop is higher at this time, the cotton fibers are in a state of moisture absorption, the friction coefficient increases, and they are prone to entanglement. At −8.4°C, the growth rate of cotton knots reaches its maximum. Although the speed of the car is the lowest at this time, due to the relative humidity in the workshop being at its highest point throughout the year, the inappropriate temperature and humidity environment makes the cotton present a “wet outside and dry inside” state. Therefore, the entanglement problem is very serious, and the workshop stoppage rate also reaches the highest level of the year.
Table 3. Workshop temperature and humidity in relation to carding machine speed.
Table 4. Experiment results of cotton neps under different carding machine speeds.
In order to further explore the extent of temperature impact on the knot formation in each process, we analyzed the cotton knot growth rate in different temperatures, as shown in . Firstly, from , we can observe that the seed-cleaning process and carding process are significantly influenced by environmental temperature and humidity on knot formation, and under 0°C, saw-tooth lint cleaning process is also heavily influenced by the environmental temperature. However, in the air-jet lint cleaning process, the impact of environmental temperature and humidity on the knot formation is less.
Secondly, by analyzing the line in , we find that as the temperature decreases, the cotton knot growth rate in the seed-cleaning process shows a downward trend. This is mainly because in a high-temperature workshop, the carding process is at an early stage. Although the cotton seeds and leaves are relatively humid at this time, the connection force between the seed cotton fiber base and cotton seed increases, making carding difficult, fibers are easy to tangle, which easily leads to cotton knot formation. However, due to the subsequent humidification process, the drying tower temperature is low. On the contrary, in a low-temperature environment, due to the natural humidification of seed cotton and the high temperature of the drying tower, the cotton fibers become dry, which is conducive to impurity removal and thus reduces the formation of cotton knots.
Further observing lines 5 (b) and 5 (d), we find that as the temperature decreases, the cotton knot growth rate in the carding and saw-tooth lint cleaning processes shows an upward trend. This is mainly because in a low-temperature environment, the air is humid, the regain rate rises, and the cotton fiber is in a moisture-absorbing state. The fiber surface is moist, which is prone to cotton knots and slivers under the action of mechanical forces. Notably, the cotton knot growth rate in the carding process is high at 11.8°C. This is due to the low relative humidity and dry environment at this time, which reduces the fiber regain rate and is prone to static electricity, thus increasing the number of cotton knots. As seen from the line in , the cotton knot growth in the air-jet lint cleaning process is largely unaffected by temperature and humidity.
Conclusions
The initial regain rate of seed cotton and the drying tower temperature are among the primary factors influencing the formation of cotton knots and the effect of impurity removal. Within a certain range, increasing the drying temperature of cotton can help improve the impurity removal effect and reduce the formation of cotton knots.
When the temperature drops to between 1°C and 3°C, the environment enters a damp area. Although the air humidity is relatively high at this time, the actual moisture content is relatively low. In this stage, the regain rate of cotton fiber is at its highest in the year, but the actual moisture absorption of cotton fiber is not substantial, and the moisture on the surface of the cotton fiber is more, leading to an increase in the surface humidity of the cotton fiber. Combined with the low temperature, which increases the brittleness of the fiber, the length and strength indices of cotton fibers processed during this period are the lowest.
When the temperature is between 3°C and 10°C, the relative humidity of the environment is within the normal range, and the brittleness of the fiber decreases, leading to an upward trend in the length and strength indices of the cotton fiber.
When the temperature exceeds 10°C, the environment enters a dry state. The regain rate of the fiber is relatively low. Although the brittleness of cotton fiber decreases and the flexibility increases, which are beneficial to the ginning process during this stage, due to the low regain and high car speed, the strength index of cotton fiber remains unchanged, and other length strength indices show a downward trend.
While the initial regain rate and drying tower temperature remain crucial in determining the cotton knot formations, other environmental factors also play a significant role. Specifically, a dry workshop environment is conducive to impurity removal and helps decrease cotton knot occurrences. However, if the relative humidity falls below 45%, it may cause electrostatic issues, thereby increasing cotton knots. On the other hand, when workshop temperatures are too low and humidity too high, cotton might seem damp externally but remain dry internally. This imbalance can lead to increased cotton knots and hamper effective impurity removal.
These findings are important for understanding and optimizing environmental factors during the cotton processing process, and they can help us adjust the production process to improve the processing quality of cotton.
Disclosure statement
No potential conflict of interest was reported by the author(s).
Additional information
Funding
References
- Cao, J. Q., L. Cheng, C. Y. Zhang, S. Q. Yuan, and H. Xu. 2021. “Current Situation and Countermeasures of Primary Processing of Machine-Picked Cotton in Xinjiang.” Cotton Textile Technology 49 (2): 75–13.
- Cao, J. Q., H. Xu, and Z. L. Xie. 2019. “Study on the Impact of Cotton Ginning on Impurities and Cotton Knots of Machine-Picked Cotton.” Modern Textile Technology 27 (6): 5. https://doi.org/10.19398/j.att.201809007.
- China Fiber Inspection Bureau. 2009. “Test Plan for the Project Studying the Effect of Temperature and Humidity on the Regain Rate of Cotton.” China Fiber Inspection 2:66–68. https://doi.org/10.3969/j.issn.1671-4466.2009.02.030.
- China Fiber Inspection Bureau. 2018. “Analysis Report on the Quality of Chinese Cotton (2017/2018).” Research on China’s Cotton and Hemp Industry Economy 3:14–22. https://doi.org/10.14162/j.cnki.11-4772/t.2018.12.002.
- Xu, H. 1997. “Cooling and Dehumidification of Fine Yarn Workshop in Cotton Spinning Mills in Xinjiang Region in Summer.” Cotton Textile Technology 10:34–36.
- Zhang, C. Y., H. L. Zhou, S. Q. Yuan, H. Xu, and D. D. Fang. 2022. “Impact of Initial Cotton Processing Temperature and Humidity on Cotton Knots, Impurities, and Color Grade.” Cotton Textile Technology 50 (7): 44–49.