
 ?Mathematical formulae have been encoded as MathML and are displayed in this HTML version using MathJax in order to improve their display. Uncheck the box to turn MathJax off. This feature requires Javascript. Click on a formula to zoom.
ABSTRACT
Capitalizing on invasive plant species and stopping their aggressive spread might be achieved by using them as a renewable source of useful products such as cellulose. The study aimed to develop new cellulose-based food packaging materials with antioxidant and antimicrobial activity. The cellulose was extracted from the invasive plant species Robinia pseudoacacia pods, crosslinked with citric acid, used as reinforcement for polyvinyl alcohol (PVA) and functionalized with ferulic acid (FA). The obtained materials were characterized by XRD, ATR-FTIR, contact angle and SEM. The materials exhibited low solubility in water and the swelling degree was proportional to the FA content. The FA release from the matrix was assessed by HPLC and the antioxidant profile by CUPRAC, FRAP, and TEAC methods. The obtained materials inhibited the growth of bacteria, yeasts and molds, being especially active on Gram-positive bacteria and yeasts. Overall, the most promising formulation for further developing new packaging materials for products with water activity less than 0.95 was the one with the highest FA content.
摘要
利用入侵植物物种并阻止其侵略性传播,可以通过将其用作纤维素等有用产品的可再生来源来实现. 本研究旨在开发具有抗氧化和抗菌活性的新型纤维素基食品包装材料. 从入侵植物Robinia pseudoacacia荚中提取纤维素,用柠檬酸交联,用作聚乙烯醇(PVA)的增强剂,并用阿魏酸(FA)进行功能化. 通过XRD、ATR-FTIR、接触角和SEM对所得材料进行了表征. 材料在水中的溶解度较低,溶胀度与FA含量成正比. 通过HPLC评估FA从基质中的释放,并通过CURAC、FRAP和TEAC方法评估抗氧化特性. 所获得的材料抑制细菌、酵母和霉菌的生长,尤其对革兰氏阳性细菌和酵母具有活性. 总的来说,对于进一步开发水活度低于0.95的产品的新包装材料,最有希望的配方是FA含量最高的配方.
Introduction
Increasing awareness of the negative impact of synthetic packaging materials on food quality as well as human and environmental health led to the need to find new biodegradable alternatives and as much as possible from natural sources (Callegarin et al. Citation1997). Currently, the most commonly used materials in the packaging industry are produced from fossil fuels (Shchipunov Citation2012) and have low biodegradability, their widespread use has become a severe environmental threat (Tang et al. Citation2012). Therefore, research in recent years has focused on using natural biopolymers, such as cellulose, starch, chitin, and chitosan, to develop new packaging materials. Cellulose has a high biodegradability rate and is the most abundant biopolymer in nature, being considered one of the most promising and ecological renewable resources (Sinharay and Bousmina Citation2005; Vítková et al. Citation2017). On the other side, the use of non-wood resources is encouraged to reduce deforestation. One exception is represented by the invasive woody species (such as Gleditsia triacanthos, Robinia pseudoacacia, Ailanthus altissima, Amorpha fruticosa, etc.) that need to be harvested for both stopping their accelerated spread in the already invaded areas and using the reproductive parts for possible applications (Glišić et al. Citation2014; Vítková et al. Citation2017).
Cellulose use in different applications is limited by its hygroscopic nature, so moisture absorption can lead to fibers swelling and, further, to composite micro-cracking and poor mechanical properties. However, this problem could be overcome by decreasing the number of free hydroxyl groups involved in the binding of other types of molecules. Chemical treatments could activate these groups or introduce new sites that can effectively interconnect with the matrix. To improve the mechanical performance of cellulosic composites, a series of studies have been performed using surface treatments, such as silane, benzoylation, peroxide, and polyvinyl alcohol treatment (Laxmeshwar et al. Citation2012; Majumdar and Adhikari Citation2005; Pasquini et al. Citation2008).
Cellulose-based packaging materials are not naturally rich in active compounds and thus cannot be considered an effective protective barrier in food packaging applications. In this respect, the concept of active packaging materials has been developed, being defined as a material designed to extend the food product’s shelf life and maintain or improve the food’s safety and quality (Latos-Brozio and Masek Citation2020). These materials are generally designed to have a high biodegradability rate, adjusted to the product shelf life. They could incorporate active components to be released or absorbed into or from foods or the food environment. Many active packaging systems are known, such as those releasing O2 and ethylene with moisture regulating effect, CO2, antioxidants, antimicrobials, or those with controlled release or adsorption of aromas and odors (Realini and Marcos Citation2014; Vermeiren et al. Citation1999).
Therefore, reinforcing cellulose with bioactive compounds can provide many benefits to the packaged product (Vermeiren et al. Citation1999). Bulk immobilization (Vermeiren et al. Citation1999), supercritical impregnation (Milovanovic et al. Citation2016), and surface immobilization (Harini and Sukumar Citation2019) are methods used to infuse active compounds in packaging. In addition, using antioxidant agents such as ascorbic acid, tannic acid, ferulic acid, etc., can increase packaged products’ shelf life, and decrease the microbial load (Ghaderi et al. Citation2014).
The water activity of the products must be taken into account when developing new active packaging formulations. The materials we propose are intended for products with water activity less than 0.95, for which the most common microbial contaminants are: Salmonella sp., Bacillus sp., Vibrio parahaemolyticus, Clostridium botulinum, Serratia sp., Lactobacillus sp., Pediococcus sp., Staphylococcus aureus, most Saccharomyces sp., some other yeasts and molds (Fontana Citation2000), and in rare cases, Pseudomonas sp. and E. coli (Martínez Citation2002). Therefore, due to the ease of biodegradation and release of active ingredients, these materials are recommended for food packaging with a water activity below 0.95% so that the moisture of the products does not allow early degradation of the packaging. In the case of Listeria sp., it has been observed that cell proliferation in products with borderline water activity depends on the pH of the product and the salt content (Schvartzman et al. Citation2011).
Takahashi et al (Takahashi et al. Citation2013) have evaluated the use of ferulic acid (FA) as an antibacterial agent on L. monocytogenes, S. aureus, B. cereus, E. coli, S. typhimurium, and P. fluorescens strains. Thus, this active ingredient can be used as an antimicrobial agent for all types of products.
In this context, the study aimed to obtain invasive plants cellulose-based functionalized materials to be further used for the development of new food packaging materials, with antioxidant and antimicrobial activity, designed for food products with water activity less than 0.95.
Materials and methods
All chemicals ethanol (HPLC grade), acetic acid (HPLC grade), methanol (HPLC grade), Folin – Ciocalteu’s phenol reagent (2 M), sodium carbonate, ferulic acid, 2,2-Diphenyl-1-picrylhydrazyl (DPPH), 2,4,6-tripyridyl-s-triazine (TPTZ), CuCl2, neocuproin, and ammonium acetate buffer (1 M, pH = 7.00), toluene (99.8% purity), sodium hypochlorite (6–14%), NaOH, lignin and Trolox (6-hydroxy-2,5,7,8-tetramethylchroman-2-carboxylic acid) were purchased from Sigma Aldrich (Germany). AgNO3 (0.1 N) was purchased from Merck (Germany). All culture media (tryptone soy agar, Sabouraud agar, tryptone soy broth, Sabouraud broth and Muller – Hilton agar) were purchased from Oxoid (UK). All chemicals used were analytical grade.
Cellulose isolation (NC)
The extraction of crude cellulose from R. pseudoacacia pods is based on a method adapted from Marinas et al. and Zhuo et al (Marinas et al. Citation2023; Zhuo et al. Citation2017). Thus, the extractable compounds were extracted from 15 g of pods ground from R. pseudoacacia in a solution of toluene-ethanol (2: 1 volume ratio) at 90°C for 8 hours. The powder was then treated with sodium hypochlorite under acidic conditions (glacial acetic acid) at 70°C for 6 hours to remove lignin, followed by treatment with 2% aqueous NaOH solution at 90°C for 2 hours to remove the aqueous solution of hemicellulose. Next, the lignocellulosic material was subjected to 6 cycles of sodium hypochlorite under acidic conditions for 2 h, followed by final purification with a 2% NaOH solution at 90°C for 2 hours. After each step, the presence of lignin was evaluated by spectrophotometric determination of the cinnamic groups. Finally, the cellulose was washed until the pH was 6, and each supernatant was assessed by titration with AgNO3 to remove chloride ions (Kassab et al. Citation2020).
Carboxylated NC (C-NC), its use as reinforcement of polyvinyl alcohol, followed by functionalization with FA (PVA-C-NC-FA)
C-NCs were obtained by subjecting the NC to the hydrolysis of the citric acid/hydrochloric acid mixture. A preheated acid solution of 90% citric acid (3 M) and 10% hydrochloric acid (1 M) (v/v) was added to the NC. The reaction was performed at 80°C for 5 days, stirring at 250 rpm. Subsequently, after cooling to room temperature, the resulting suspension was washed several times using successive centrifugations at 10,000 rpm at 10°C for 10 minutes at each stage, then dialyzed with distilled water until a pH similar to distilled water was reached. The resulting C-NC suspension was ultrasonicated for 30 minutes (Kassab et al. Citation2020) and lyophilized.
According to Wang et al (Wang et al. Citation2019) a two-step process is needed to prepare PVA-C-NC-FA: i) 0.5 g of lyophilized NC powder was homogeneously dispersed in 50 mL of purified water; ii) HEPES (4-(2-hydroxyethyl)-1-piperazineethanesulfonic acid) (0.5 g) was dissolved in the NC suspension, and the pH was adjusted to 8.0 with NaOH. The solution was allowed to stir for 24 hours to homogenize the cellulose completely. After that, PVA powder (5.0% by weight) was added to the NC suspension with stirring at 90°C until a homogeneous solution formed.
Next, the solution was brought to 30°C, and 0.5%, 0.33%, 0.05% and 0% (m/v) FA were added. The solutions were homogenized under mechanical stirring for 2 h (Hu et al. Citation2017). The final solutions were poured into a clean, dry Petri dish at room temperature to allow the film formation. The film was left at room temperature for 24 hours.
ATR-FTIR
The FTIR spectra for NC, C-NC, PVA-C-NC, and PVA-C-NC-FA were recorded at room temperature using the Cary 630 FTIR Spectrometer in ATR mode (Agilent Technologies Inc., Santa Clara, CA, USA) and Agilent MicroLab Software FTIR System (Agilent Technologies, Inc., USA). The chosen measurement range was 4000–650 cm−1, the number of scans was 400, and the resolution was 4 cm−1.
Xrd
The X-ray diffraction (XRD) patterns were recorded using a Bruker – D8 Advance diffractometer (Bruker AXS, Karlsruhe, Germany) in Bragg – Brentano configuration. The range of measurements was from 6° to 70°, with 2θ-steps of 0.02° and 1 s counting time. A Ni-filtered copper Kα1-Kα2 radiation doublet and a LynxEye 1D detector were employed to carry out the XRD patterns.
Surface wettability
Static (equilibrium) CAs were measured using a drop shape analysis instrument, model DSA100 (Krüss GmbH, Hamburg, Germany). The samples were positioned on a plane stage, under the tip of a stainless-steel needle, with a blunt end, with an outer diameter of 0.5 mm. The needle was attached to a syringe controlled by DSA3 software supplied with the instrument and was used to drop water with a controlled volume on the test surface as well as to evaluate the contact angle. The volume of water droplets was ≈1 µL with a pumping rate of 5 µL/min. The tests were carried out at room temperature (Stan et al. Citation2020).
Scanning electron microscopy (SEM)
A Zeiss Gemini 500 field emission scanning electron microscope (Oberkochen, Germany) was used in the morphology analysis of NC, C-NC, PVA-C-NC and PVA-C-NC-FA films, as well as film thickness measurement. For this, the samples (discs with a diameter of approximately 0.5 cm) were fixed without any intervention on the surface, on the vertical wall of support specific to the technique.
Solubility in water and swelling
A method modified by Chana-Thaworn et al (Chana-Thaworn, Chanthachum, and Wittaya Citation2011). was applied to measure the film solubility. Portions of film measuring 1 × 3 cm2 were cut and dried at 105°C for 24 hours and then weighed to about 0.1 g for the initial dry weight. The films were placed in a glass flask with 50 mL of distilled water and gently shaken at 25°C for 24 hours. The solution was filtered through Whatman filter paper no. 1 to recover the remaining undissolved film. After immersion, the remaining pieces of film were dried at 105°C to constant weight (final dry weight). The tests for each type of film were performed in triplicate. Water solubility (%) was calculated using the following equation:
where: mi – initial weight and mf – final weight.
The cellulose films used weighed 0.1 g and they were treated with methanol, dried utterly (60°C for 24 hours), and immersed in distilled water for 30 min. Excess distilled water was removed with filter paper, and the wet mass of the materials was determined (method adapted from (Ngadaonye et al. Citation2013) and (Vasconcelos, Gomes, and Cavaco-Paulo Citation2012). The percentage of water absorbed was calculated as follows:
where: mw – wet weight and mi – initial weight.
Kinetic release of FA
The cellulosic materials (0.015 g) were immersed in 10 mL of distilled water, and the FA release was measured at different time intervals (0, 5 min, 10 min, 20 min, 30 min, 45 min, 60 min, 90 min, 120 min, 150 min, 200 min). After 200 min, daily measurements were taken until equilibrium was reached. Each point in the graph represents the average of three measurements, a protocol adapted from Popa et al (Popa et al. Citation2018). FA and PVA were quantified by HPLC with UV detection (Agilent 1260, Agilent Technologies, Santa Clara, USA) according to Cayan et al. (Çayan et al. Citation2020) with slight modification. Detection was carried out using Diode Array Detector (DAD) at 280 nm as the preferred wavelength. FA and PVA (Eisa and Shabaka Citation2013) were separated on a reverse-phase C18 column (Zorba, 250 × 4.6 mm, 5 μm, 100 Å; Phenomenex, Torrance, USA). The column was thermostatically controlled at 40°C. The flow rate was 1.5 mL/min, the injection volume was 20 μL, and the total run time was 10 min. The mobile phase composition was: solvent A (0.5% aqueous acetic acid) and solvent B (0.5% acetic acid in methanol). The gradient started at 0–20% B (0–0.01 min), 20–60% B (0.01–2 min), 60–80% (2–5 min), and 80–20% (5–10 min).
Antioxidant activity
DPPH
The DPPH (2,2-diphenyl-1-picrylhydrazyl) assay was performed according to the method of Madhu (Madhu et al. Citation2013). The standard curve was linear between 0 and 200 mM Trolox (R2 = 0.9987). Results were expressed as millimolar TE (Trolox equivalent)/g material.
CUPRAC
The CUPRAC method is based on reducing a cupric complex, neocuproin, by antioxidants in copper form. Copper ion reduction was performed according to a method described by Celik et al (Çelik et al. Citation2010):. 60 µL of sample/standard solutions of different concentrations were mixed with 50 µL CuCl2 (10 mM), 50 µL neocuproin (7.5 mM), and 50 µL ammonium acetate buffer 1 M, pH = 7.00. After 30 min, the absorbance was measured at 450 nm. The stock Trolox solutions required for the calibration curve were 2 mM, and the working concentrations were between 0.125 and 2.0 mM (R2 = 0.9989). The results were expressed in mg Trolox/g of material.
FRAP
The FRAP assay – the determination of the antioxidant capacity of iron reduction was performed by the method described by Thaipong et al (Thaipong et al. Citation2006). The stock solutions included 300 mM acetate buffer, pH 3.6, 10 mM 2,4,6- tripyridyl-s-triazine (TPTZ) solution in 40 mM HCl, and 20 mM FeCl3 6 H2O solution. The fresh working solution was prepared by mixing 25 mL acetate buffer, 2.5 mL TPTZ solution, and 2.5 mL FeCl3 6 H2O solution and warming at 37°C before use. After incubation, the absorbance was read at 593 nm. A 1 mM Trolox stock solution was used to plot the calibration curve, the concentration ranging between 25 and 250 µM Trolox (R2 = 0.9991). The results were expressed in mg Trolox/g of material.
Antimicrobial activity
Microbial strains
The reference strains from the American Type Culture Collection (ATCC, Manassas, VA, USA) were used for testing antimicrobial activity (Listeria ivanovii ATCC 19,110, Listeria innocua ATCC 33,096, Staphylococcus aureus ATCC, Bacillus cereus ATCC, Shigella flexneri ATCC12022, Salmonella typhimurium vs. enterica ATCC 14,028, Escherichia coli ATCC 25,922, Candida glabrata ATCC MYA-2950 and Saccharomyces cerevisiae). In addition, some filamentous fungal strains isolated from vegetal seeds were also tested (Aspergillus niger, Alternaria alternata, Rhizopus nigricans and Cladosporium cladosporioides).
Logarithmic reduction of CFU/mL by active principles release
The antimicrobial activity (bacterial and yeast strains) of PVA-C-NC and PVA-C-NC-FAs disk samples (60 mm diameter) was determined by logarithmic and percentage reduction of microorganisms. The samples were immersed in 1.8 mL of Peptone Water seeded with 0.2 mL of 104 CFU/mL (obtained by diluting the suspension 0.5 McFarland − 1.5 × 10⁸ CFU/mL for bacterial strains and 1.4 × 10⁶ for yeasts – the suspensions used were checked by plate counting method) and incubated at 37°C for 24 hours. After contact with the microbial inoculum for 24 hours, the discs were shaken vigorously before successive ten-fold dilutions were made and spotted in agar media plates (ALOA for Listeria sp. strains, Muller – Hilton for the other bacterial strains, and Sabouraud for yeasts) in order to determine the CFU (colony forming unit)/mL after 24 hours at 37°C incubation. The assay was performed in triplicate. The logarithmic reduction was calculated using the formula:
where A is CFU/mL of samples (strain with material); B is CFU/mL of positive control (strain without material contact).
In the case of filamentous fungi, a suspension of 1 McFarland was prepared in a 0.01% Tween 80 solution. To evaluate the logarithmic reduction of microbial growth, samples were incubated in 0.9 mL RPMI 1640 and inoculated with 0.1 mL fungal suspension. Both positive control (untreated strain) and negative control (sterility control) were used. The 24-well plates were incubated for 3 days at 28°C, after which they were seeded on DG18 medium (Dichloran Glycerol Agar) by displaying 100 µL of suspension in triplicate. Finally, the plates were incubated for 5 days at 28°C.
The influence of FA release on the microbial adherence capacity to the inert surface
The impact on the ability of microbial adherence to the inert substratum (96- polystyrene well plate for bacterial and yeast strains and 24-well plate for molds) was measured after running the quantitative analysis of the antimicrobial activity, through the microtiter method, after fixation with cold methanol (5 min) and 0.1% crystal violet staining (for 15 min). The absorbance of the biological material resuspended in acetic acid 33% under stirring at 150 rev/min for 15 min was measured at 490 nm. Negative (culture medium sterility control) and positive (untreated microbial culture) controls were used.
Statistical analysis
Data were expressed as means ± SD determined by triplicate analysis. The statistical analysis was conducted using GraphPad Prism 9. Data were analyzed using an unpaired t-test corrected for multiple comparisons using the Holm-Sidak method. The level of significance was set to p < 0.05.
Results and discussion
Isolation and characterization of cellulose from R. Pseudoacacia pods
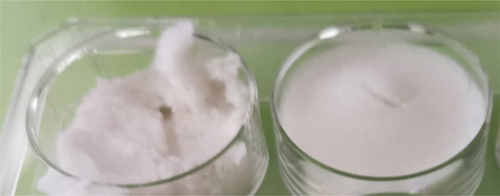
Efficient cellulose isolation has been achieved by pretreatment of biomass to remove component resins and waxes and to reduce the recalcitrant nature of the lignocellulosic components of biomass. Pretreatment also solubilizes lignin and hemicellulose, increasing its accessibility during hydrolysis. shows the aspect of isolated cellulose. After the two-stage bleaching treatment, the color of the sample was changed to off-white. The bleaching process removed residual lignin from the sample remaining after the acid-leaching step (Galiwango et al. Citation2019). R. pseudoacacia pods proved to be poor in lignin, leading to fewer delignification cycles. After obtaining a concentration below the limit of detection of the cinnamic derivatives content, the cellulosic material was washed until no chloride ions were found, quantified by the Mohr titrimetric method.
Figure 1. Freeze-dried crude cellulose obtained from R. pseudoacacia pods.
The FTIR spectra were analyzed after each delignification cycle for the qualitative determination of the stage of lignin and hemicellulose specific bands elimination and the correlation with the content of cinnamic groups by the UV-VIS spectrophotometric method. The vibrational bands are shown in .
Figure 2. FTIR spectra of cellulose obtained from R. pseudoacacia pods (NC) and cellulose activated by acid hydrolysis with 6 M citric acid (C-NC).
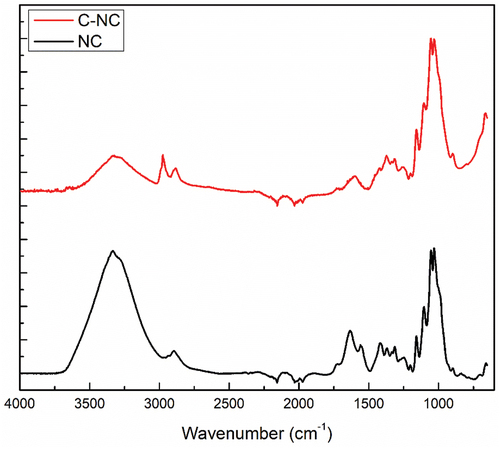
The wide absorption band observed between 3400 and 3500 cm−1 is attributed to the stretching vibration of the -OH group, while that present around 2900 cm−1 is attributed to the -CH groups of cellulose. As Yang et al. have also reported, the strong peak around 1030 cm−1 is attributed to the pyranose skeletal ring’s C-O-C stretching vibration (Yang et al. Citation2016). Cellulose tends to be hydrophilic and thus interacts strongly with water at the molecular level. Therefore, the maximum absorption around 1630 cm−1 is attributed to the OH bending in water (Johar, Ahmad, and Dufresne Citation2012; Jonoobi et al. Citation2011). The bands around 1610 and 1320 cm−1 are attributed to the CH2 extension of an aromatic ring and the C-O extension of an etheric bond, respectively. To highlight the effectiveness of delignification after each cycle, residual lignin fractions in the cellulose samples were analyzed. Absorption bands around 1725 cm−1 are assigned to groups C = O due to partial acetylation of cellulose during the bleaching process, as previously reported by (Yang et al. Citation2016; Zuluaga et al. Citation2007). The absence of bands at the wavenumbers 1512 and 1613 cm−1 denotes lignin removal from the lignocellulosic matrix (Taflick et al. Citation2017), observed after several delignification cycles. The lack of absorption band at the wave number of about 1602 cm−1 was specific for the strong water affinity of hemicelluloses. The lack of bands at 1384 and 1124 cm−1, attributed to C-H deformations and C-O-C vibrations, confirms the successful removal of hemicelluloses (Yao et al. Citation2017). The weak band at 899 cm−1 is characteristic of β-glycosidic bonds (Sabiha-Hanim, Mohd Noor, and Rosma Citation2015).
Synthesis and physico-chemical characterization of C-NC
Subsequently, the obtained nanocellulose was subjected to acid hydrolysis with citric acid, providing a carboxylated surface. This hydrolysis ensures the thinning of the fibers to the nanoscale by solubilizing the amorphous areas and functionalizing the surface. Thus, the FTIR analysis () showed the formation of new bands at the wavenumbers 1600 and 2982 cm−1 and the disappearance of the bands from 1205, 1337, 1423, 1562, 1639, and 2902 cm−1. At the same time, a small band at 1729 cm−1 can be observed in the C-NC spectrum (), which is associated with the carboxyl groups formed on the cellulose surface by the esterification reaction between the hydroxyl groups of the cellulose and the groups citric acid carboxyl (Yu et al. Citation2016; Zhuo et al. Citation2017). Thus, the asymmetric vibrational mode of the carboxyl group is usually attributed to the wavenumber of 1600 cm−1 (Jeschull, Scott, and Trabesinger Citation2019). In addition, the two bands in the region 2941 and 2887 cm−1 are due to aliphatic stretching vibrations C-H (Talari et al. Citation2017).
According to Wing (Wing Citation1996) cellulose esterification with citric acid at high temperatures allows citric acid to form anhydrides that subsequently react with cellulose hydroxyl groups. The degree of substitution depends on the reaction conditions, such as reactant concentration, pH, time, and temperature. The crosslinked and lyophilized material was characterized by XRD () to verify the purity of the native cellulose.
Figure 3. XRD spectrum of cellulose cross-linked with citric acid and dialyzed to pH 6.5.
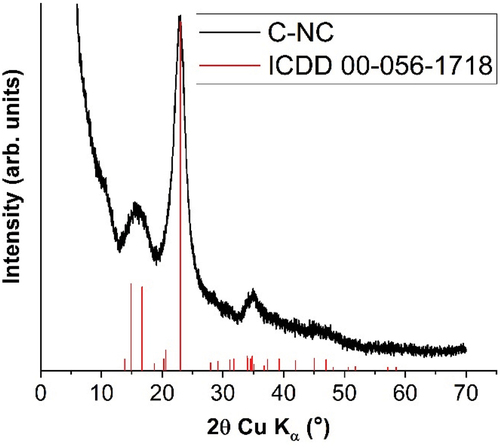
The XRD pattern of the cellulose () was indexed using the International Center for Diffraction Data (ICDD) database. The diffraction lines were attributed to the cellulose Iβ form (ICDD file no. 00-056-1718) and, within the detection limit of the diffractometer, no secondary phases were observed. However, due to its small crystallites (~5 nm), only broad overlapped diffraction peaks near 16°, 23° and 35° can be observed. In order to analyze the surface properties, the measurement of the contact angle on the surface of the crosslinked cellulose compared to the native cellulose, which proved to be hydrophobic, was performed. The water contact angle is used in this experiment as the most convenient method of analyzing the hydrophilic/hydrophobic properties of the modified surface compared to the initial one. Non-crosslinked type I cellulose was observed to be super hydrophilic, while crosslinked citric acid increased its hydrophobicity, obtaining a contact angle of 119.05 ± 5.30º.
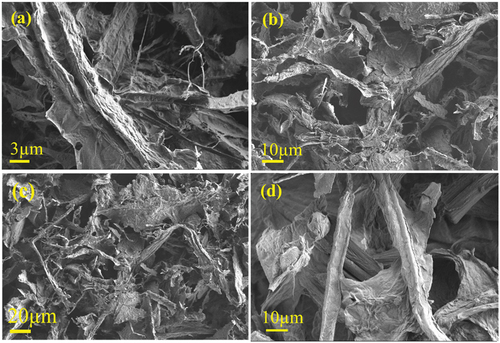
shows the morphology of both the native cellulose and the cellulose dissolved in 6 M citric acid solution at 80°C, obtained by scanning electron microscopy. The basic form of cellulose was changed by dissolution. The dissolved cellulose flocculated, and the cellulose fibers were damaged, making it impossible to measure their size. These results proved that acid hydrolysis of cellulose occurred in the created system. The scanning electron microscope used to perform a deeper examination of the surface morphologies of the crude cellulose highlighted the presence of nanometer-size fibers (). The native cellulose had a somewhat different morphology than the citric acid crosslinked cellulose (). The crosslinking with citric acid increased the hydrophobicity of the material and at the same time, a breakdown of the cellulose fibers was observed.
Figure 4. SEM images of the surface of cellulosic material obtained from R. pseudoacacia crosslinked with citric acid (a) 3000 ×, (b) 1000 ×, (c) 500 ×, and SEM images of the native cellulose (d) 1000 ×.
Physico-chemical characterization of cellulose materials functionalized with FA and its performance as reinforcement of a PVA matrix
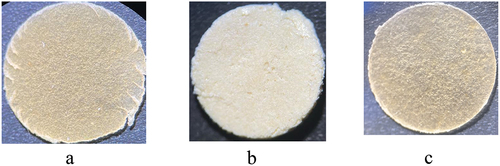
After lyophilization, the crosslinked cellulosic material reacted with FA used for its antioxidant feature and PVA to strengthen the material. A homogeneous mixture of crosslinked cellulose and PVA was formed at 90°C and then gradually decreased to 30°C, to allow the addition of FA. The macroscopic appearance of the obtained materials is present in . The film thickness of PVA-C-NC, PVA-C-NC-FA-0.05, and PVA-C-NC-FA-0.5 were 184.73 ± 2.69 μm, 153.97 ± 9.37 μm, and respectively 330.07 ± 2.74 μm.
Figure 5. Macroscopic appearance of materials obtained by reinforcing PVA with a citric acid modified-cellulose (isolated from R. pseudoacacia pods), and functionalized with different concentrations of ferulic acid (A − 0.05%, B − 0.5%, C − 0%).
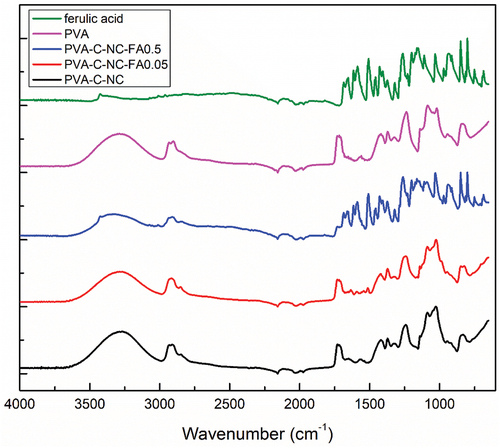
According to the FTIR spectra (), the obtained materials with different concentrations of FA preserved the specific skeleton of this molecule, which can be proven by the presence of bands at the wavenumbers 1515 and 1600 cm−1 (C = C aromatic) (Sajjadi, Shokoohinia, and Moayedi Citation2012). In addition, several new bands were formed at the wave numbers 827, 1639, 2855, 2916, and 2922 cm−1, which could be attributed to the following groups: -CO2, -C = O, C-H symmetrical and asymmetrical stretch. The 1204 cm−1 wavenumber band is found only in the spectrum of the material with the highest concentration of FA and is common with that of pure FA, being attributed to the in-plane C-OH group at the C6 folding (Han et al. Citation2013).
Figure 6. FTIR spectra of PVA-C-NC-FA films obtained from R. pseudoacacia pods (NC) and cellulose crosslinking by hydrolysis with 6 M citric acid (C-NC).
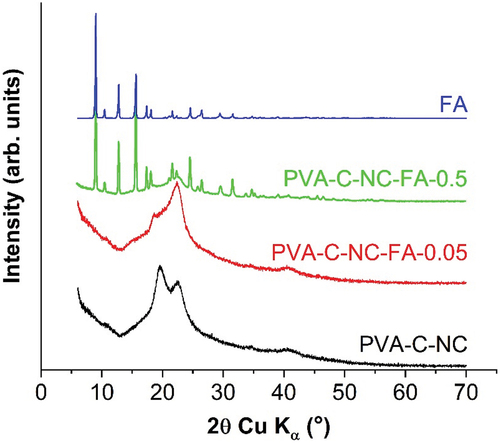
XRD patterns of PVA-C-NC, PVA-C-NC-FA-0.05 and PVA-C-NC-FA-0.5 materials are shown in . The numerous sharp peaks in the PVA-C-NC-FA-0.5 model suggest that the crystalline FA particles coated the cellulose nanofibers (Huang et al. Citation2018). The semi-crystalline, hydrophilic nature of PVA and cellulose was demonstrated by two blunt peaks identified by ICDD file no. 00-064-1489 (PVA) and ICDD file no. 00-056-1718 (crude cellulose). In the composite with the lowest concentration of FA (0.05%) these peaks were absent, the spectrum being almost similar to that of the control PVA crosslinked cellulose.
Figure 7. XRD spectra of FA, PVA-crosslinked cellulose with citric acid (PVA-C-NC), with citric acid – FA 0.05% (PVA-C-NC-FA-0.05) and with citric acid – FA 0.5% (PVA-C-NC-FA-0.5).
The wetting behavior of PVA and crosslinked cellulose materials was investigated by evaluating the contact angle by the water drop method. It was observed that with the increase of FA concentration, the contact angle decreases and, implicitly, the hydrophobicity of the materials, as observed in . The contact angle drops with increasing FA concentration ().
Figure 8. The surfaces wettability behavior of PVA-C-NC composites with different concentrations of FA: a) 0%, b) 0.05% and c) 0.5%.
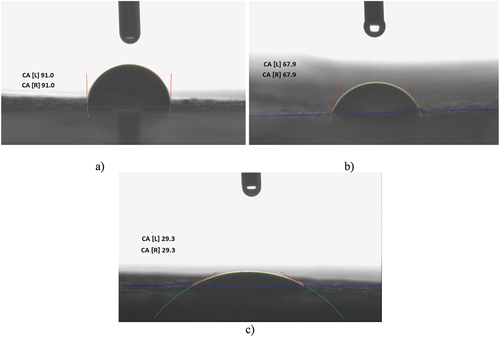
Table 1. The contact angles of samples.
Surface tension characterization is critical in the food science area, particularly for packaging and coating materials that require active principles loading to improve the process and quality of the packed product. The “hydrophobic” and “hydrophilic” relative surfaces are defined as having a water contact angle θ > 65° and respectively θ < 65° (Vogler Citation1998). Therefore, the material without FA is hydrophobic, the one containing 0.05% FA is at the interface of hydrophobicity and hydrophilicity and that containing 0.5% FA is hydrophilic. SEM was used to study the morphology of the formulated samples and to determine how the nanocellulose is dispersed in the matrix. SEM analysis revealed that the PVA-C-NC control showed microfibers covered by a PVA film so that the dimensions could not be measured ().
Figure 9. SEM images of the surface of PVA-cellulose films at magnitude of 200× for PVA-C-NC (a), PVA-C-NC-FA-0.05 (b) and PVA-C-NC-FA-0.5 (c).
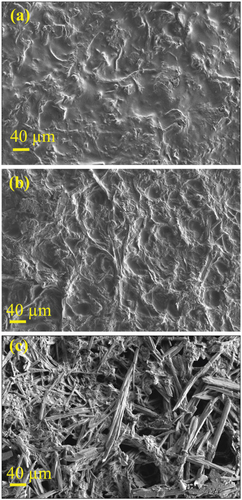
In the case of the material PVA-C-NC-FA-0.05, fibers of 7–20 μm in size were observed, but probably due to the low concentration of FA (0.05%), the fibers are rare, having an appearance similar to that of PVA-C-NC control ().
By increasing the concentration of FA, the microfibers crosslinking was augmented, so the PVA-C-NC-FA-0.5 material showed fibers of 2–15 μm in size, and the denatured microfibers are smaller (). All films showed a smooth and uniform surface, involving FA homogeneous dispersions and cross-linked cellulose extracted from the R. pseudoacacia pods in the PVA matrix. This phenomenon could most likely be attributed to the formation of hydrogen bonds between the hydroxyl groups of FA, cellulose microfibers and PVA (Choo et al. Citation2016; Dai, Huang, and Huang Citation2018). The SEM showed that the surface of the PVA-C-NC-FA-0.5 sample is rough and robust, implying a marked resistance to cracking. The uniform distribution of FA at the fiber surface could be attributed to the favorable molecular interactions between cellulose on the one hand and matrix constituents on the other (Taheri et al. Citation2020).
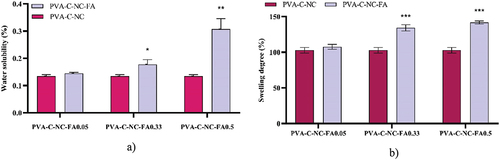
Another important physical parameter for packaging is water solubility, as it could affect resistance to moisture, especially for products with water activity above 0.95. All three samples were found to have low solubility, ranging from 0.31 ± 0.03 to 0.13 ± 0.01% after 24 hours of contact with distilled water at 25°C. The hydrophilic nature of PVA and the presence of FA increase the solubility of the films (), which, similar to the swelling behavior (), is directly proportional to the FA content. Peng et al (Peng, Wu, and Li Citation2013) reported that the swelling degree of a polymeric material strongly depends on the amount and nature of intermolecular chain interactions. Solubility is closely related to the hydrophilic properties of the films, and swelling involves water diffusion, ionization of carboxyl groups, dissociation of hydrogen and ionic bonds, and relaxation of the polymer. Silva et al (Silva, Bierhalz, and Kieckbusch Citation2009) observed a higher solubility and swelling degree of the pectin films with a reduced crosslinking degree of the intermolecular chain, possibly associated with a decreased retraction force, that allowed better water absorption.
Figure 10. Water solubility (%) – a) and swelling degree (%) – b) of PVA – C- NC films with different concentrations of FA (*p < 0.05, **p < 0.01, ***p < 0.001).
Releasing the FA from the matrix and the antioxidant activity in temporal dynamics
The release of the active ingredients was quantified using the standard FA curve. The release rate of FA from the PVA-cellulose matrix was observed to be 7.23 ± 0.01 µg/mL/min, 6.03 ± 0.04 µg/mL/min, and 5.11 ± 0.13 µg/mL/min for the matrix with 0.50%, 0.33% and 0.05% FA, respectively (). The in vitro FA release profile reached a constant value after 120 min, representing 1.45% of the amount of FA introduced in the material with the highest concentration of FA, probably the rest being either sequestrated in the composite or denatured. The FA release profile reached a constant value after 20 min in the case of material with the lowest FA content, representing 2.84% of the total FA amount introduced.
Figure 11. Ferulic acid (FA) release kinetics from the PVA-C-NC-FA matrix as a function of the initially introduced FA concentration, expressed as mg of FA released from one g of material (a) and PVA solubilization kinetics from the PVA-C-NC matrix, expressed as µg PVA released from one g of material (b).
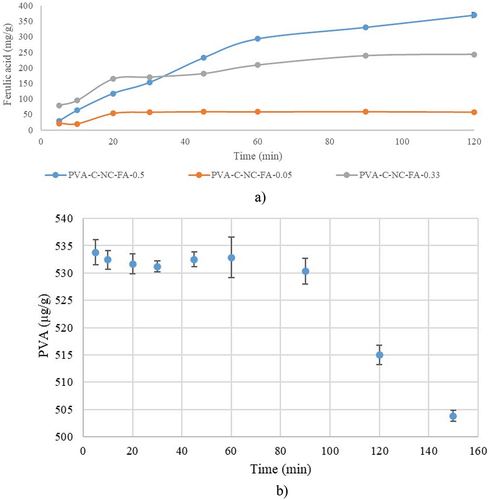
For the PVA-C-NC matrix without FA, a specific PVA peak was identified, which is constant up to 60 min, after which it begins to solubilizate at a rate of 6.593 ± 0.06 µg/mL/min (). PVA is a synthetic polymer widely used for food packaging because it is biodegradable, nontoxic, has a good capacity to form thin layers, has water processability, fast availability, and low cost (Suganthi et al. Citation2020). So, FA acts as a barrier in the solubilization of PVA. This finding is supported by the scientific literature, specifically, ferulic acid led to more significant changes in PVA films, promoting the crystallinity, stiffness, and barrier capacity of water vapor and oxygen, according to Andrade et al. (Citation2021). These changes were explained by establishing hydrogen bonds between the hydroxyl groups in PVA and phenolic acid’s carboxyl and hydroxyl groups.
Considering that the release of FA continues after 60 min it could be concluded that the release of FA from the matrix is not influenced by the PVA solubility.
Antioxidants have received special attention in the biological, medical, nutritional and agrochemical fields and have led to the need for simple, convenient and reliable methods for determining the antioxidant capacity, such as those used in this study were: CUPRAC, FRAP and DPPH. The assays of total antioxidant capacity (TAC) should be applicable to both lipophilic and hydrophilic antioxidants (Karadag, Ozcelik, and Saner Citation2009).
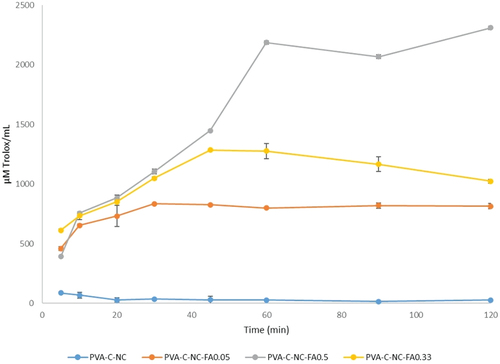
TAC vales determined by CUPRAC values are higher than those determined by FRAP and DPPH methods () probably due to the lower redox potential of the CUPRAC reagent (Apak et al. Citation2004). At the same time, the reduced redox potential improves the redox cycle, so copper reduction may be an even more sensitive indicator of the potential prooxidant activity of antioxidants (Prior, Wu, and Schaich Citation2005).
Figure 12. Antioxidant activity of PVA-C-NC with FA of different concentrations, by the CUPRAC method (p < 0.05, samples compared to control without FA).
In , a maximum antioxidant activity can be observed by the CUPRAC method after 90 min for the material with 0.5% FA, the TAC increasing in time, from 20 to 90 min. In the case of the 0.05% FA variant, the maximum antioxidant activity was recorded after 30 min, while for the PVA control, in 20 min. The differences are statistically significantly higher than the PVA-cellulose control for FA variants over 0.33% at any time (p < 0.05).
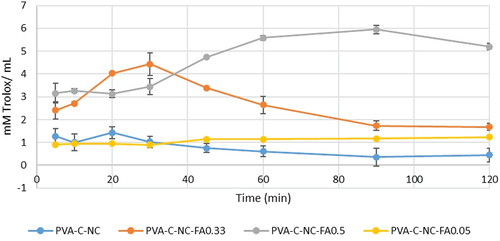
Another antioxidant activity assay method is DPPH, but this has many disadvantages, like as: it can be dissolved only in organic media, which is an important limitation when interpreting the role of hydrophilic antioxidants (Arnao Citation2000), the absorption of the DPPH radical after the reaction with an antioxidant is reduced by light (Ozcelik, Lee, and Min Citation2003), the presence of oxygen and the type of solvent (Apak et al. Citation2004). In it can be observed that the antioxidant activity of FA released from the matrix increases up to 60 min, after which it remains constant in the case of 0.50% FA variant (5.6125 µM Trolox/mL/min). In the version with 0.05% FA, the antioxidant activity oscillates up to 90 min, after which it starts to decrease (33.103 µM Trolox/mL/min). The best antioxidant activity observed by the DPPH method was for the average concentration of FA, for which the rate of active compound release with antioxidant effect was 24.721 µM Trolox/mL/min. The discrepancies between the three variants can also be given by the denaturation of FA by dimerization/trimerization. The material without FA has no antioxidant activity. Therefore, the antioxidant activity is generated only by FA ().
Figure 13. Antioxidant activity of PVA-C-NC with FA of different concentrations, by the DPPH method (p < 0.05, samples compared to control without FA).
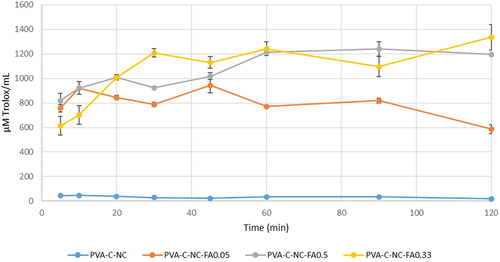
In the case of FRAP method, the trend is similar to the CUPRAC method for the material with the highest concentration of FA, the antioxidant activity increases with the release of FA from the matrix up to 60 min, after which it remains steady (). For the 0.05% FA variant, a plateau was reached after 30 min. The difference from the control without FA is significant (p < 0.05). The release rate of compounds with antioxidant capacity was 23.039 µM Trolox/mL/min for material with 0.5% FA, 16.543 µM Trolox/mL/min for material with 0.33% FA and 13.415 µM Trolox/mL/min for material with 0.05% FA.
Figure 14. Antioxidant activity of PVA-C-NC with FA of different concentrations, by the FRAP method (p < 0.05, samples compared to control without FA).
Antimicrobial and antibiofilm activity
The microbial species selected for evaluating antimicrobial and antibiofilm activities can proliferate in environments with water activity ≤0.95. The obtained cellulose-based materials have been shown to be active in limiting the degree of microbial growth for both bacterial and fungal strains, the most active being the one with the highest FA content.
The use of FA as an antimicrobial agent was preferred because it does not vaporize and practically does not migrate into the food, thus avoiding the modification of the sensory properties. Other natural antimicrobials, such as the essential oils (Sharma et al. Citation2020; Tao, Sedman, and Ismail Citation2021), are known for their cytotoxic effects above certain concentrations (Miladi et al. Citation2013; Reichling et al. Citation2009) therefore toxicity tests are absolutely necessary to be performed.
The comparative analysis of the efficiency of cellulosic materials obtained from R. pseudoacacia pods showed that PVA-C-NC-FA-0.05 has been significantly more active on S. aureus, S. cerevisiae and E. coli strains, PVA-C-NC-FA-0.33 on S. aureus, S. enterica and C. clandosporos and PVA-C-NC-FA-0.5 on S. aureus, B. cereus, L. ivanovii, S. enterica, E. coli, C. glabrata, S. cerevisiae and C. clandospores strains (). For A. alternata strain, the number of spores/mL could not be determined.
Table 2. Percentage reduction of microbial viability (MV) by the biocomposite films obtained from PVA reinforced with cellulose isolated from R. pseudoacacia pods and functionalized with different concentrations of FA (0.05%, 0.33%, 0.5%). Statistical interpretation was performed in comparison with the material without FA.
In case of PVA-C-NC-FA-0.5, the percentage of microbial viability decrease was approximately 23.65% in the case of L. ivanovii, 48.14% for S. enterica, 15.49% for E. coli and 22.89% for S. cerevisiae (p < 0.05) ().
The hydrophobicity of the cell surface and the presence of extracellular filamentous appendages may influence the rate and degree of microbial attachment. In addition, the hydrophobicity of the cell surface is important in adhesion because hydrophobic interactions tend to increase proportionally to the nonpolar nature of one or both surfaces involved, i.e., the microbial cell and the adhesion surface (Donlan Citation2002).
In this context, the capacity of the active ingredient from the materials to inhibit the microbial adhesion to the packaging material could represent an advantage. In order to unveil this feature, we have determined the biofilm inhibition index, by the purple crystal microtiter methods. All tested materials containing FA were significantly more active than those without FA, the antibiofilm effect being more potent against the bacterial strains ().
Table 3. Inhibition index of biofilm growth (IIBG%) for the biocomposite films obtained from PVA reinforced with cellulose and functionalized with different concentrations of FA (0.5%, 0.33%, 0.05% and 0%). Statistical interpretation was performed in comparison with the material without FA (*p < 0.05, **p < 0.01, ***p < 0.001, ****p < 0.0001).
The PVA-C-NC-FA-0.05 was more active against S. aureus, L. ivanovii, E. coli and S. cerevisiae; PVA-C-NC-FA-0.33 on S. aureus, C. glabrata, S. cerevisiae and A. alternata and PVA-C-NC-FA-0.5 on S. aureus, L. ivanovii (p < 0.001), S. enterica, E. coli, C. glabrata, S. cerevisiae, R. nigricans and A. alternata (). For the B. cereus strain, no adherence was observed.
Conclusion
The cellulose was extracted from the invasive plant R. pseudoacacia pods and subjected to two cycles of delignification for purification. The final materials were obtained by reinforcing PVA with a citric acid modified-cellulose and adding FA (with different concentrations) that will be released from the matrix, so that the antioxidant activity was directly proportional to the content of released active principles and the contact time.
These materials have antimicrobial activity, the one with the highest concentration of FA being the most active, especially on S. aureus, S. cerevisiae and R. nigricans strains. In the case of A. alternata strain, all materials, including those without an active ingredient, inhibit 100% microbial viability. This variant statistically significantly reduced microbial adhesion except for C. clandosporos.
Therefore, the proposed materials have good antimicrobial and antibiofilm activity in order to use them as potential antimicrobial and antioxidant materials with applications in the food industry, especially for products with a water activity below 0.95. Therefore, the study will be extended to assess the stability, migration of the active ingredient, and possible interactions with nutrients in foods with water activity less than 0.95.
Highlights
New biocomposite films with polyvinyl alcohol and functionalized with ferulic acid.
Exploring the influence of ferulic acid concentration on material properties.
An invasive plant cellulose-based functionalized materials.
Developing food packaging materials with antioxidant and antimicrobial activity.
Authors contributions
All of the authors contributed to the study’s concept and design. The study was drafted by I.C.M. The experiments were carried out by I.C.M., D.-M.G., E.M., L.N., I.Z., and M.A. The data were interpreted by I.C.M., D.-M.G., E.O., and M.C.C. The final manuscript was read and approved by all authors.
Consent
I confirm that any participants (or their guardians if unable to give informed consent, or next of kin, if deceased) who may be identifiable through the manuscript (such as a case report), have been given an opportunity to review the final manuscript and have provided written consent to publish.
Ethics declarations
I confirm that all the research meets ethical guidelines and adheres to the legal requirements of the study country.
Supplemental Material
Download Zip (148 KB)Acknowledgments
The authors would like to thank for financial support from the Research Institute of the University of Bucharest (by the O.I.M. under Grant ICUB 20968/30.12.2020) and the Romanian Ministry of Research, Innovation, and Digitization under Core Program of the National Institute of Materials Physics (PN23080303 and PC1-PN23080101). We acknowledge the support of the project CNFIS-FDI-2024-F-0484 INOVEX: Supporting the Development of New Competencies and Innovative Tools for Excellence in Interdisciplinary Research at the University of Bucharest.
Disclosure statement
No potential conflict of interest was reported by the author(s).
Supplementary material
Supplemental data for this article can be accessed online at https://doi.org/10.1080/15440478.2024.2355297
Additional information
Funding
References
- Andrade, J., C. González-Martínez, and A. Chiralt. 2021. “Effect of Phenolic Acids on the Properties of Films from Poly (Vinyl Alcohol) of Different Molecular Characteristics.” Food Packaging and Shelf Life 29:100711. https://doi.org/10.1016/j.fpsl.2021.100711.
- Apak, R., K. Güçlü, M. Özyürek, and S. E. Karademir. 2004. “Novel Total Antioxidant Capacity Index for Dietary Polyphenols and Vitamins C and E, Using Their Cupric Ion Reducing Capability in the Presence of Neocuproine: CUPRAC Method.” Journal of Agricultural and Food Chemistry 52:7970–22. https://doi.org/10.1021/jf048741x.
- Arnao, M. B. 2000. “Some Methodological Problems in the Determination of Antioxidant Activity Using Chromogen Radicals: A Practical Case.” Trends in Food Science & Technology 11 (11): 419–421. https://doi.org/10.1016/S0924-2244(01)00027-9.
- Callegarin, F., J. A. Q. Gallo, F. Debeaufort, and A. Voilley. 1997. “Lipids and Biopackaging.” Journal of the American Oil Chemists’ Society 74 (10): 1183–1192. https://doi.org/10.1080/10408390802145724.
- Çayan, F., E. Deveci, G. Tel-Çayan, and M. E. Duru. 2020. “Identification and Quantification of Phenolic Acid Compounds of Twenty-Six Mushrooms by HPLC–DAD.” Journal of Food Measurement and Characterization 14 (3): 1690–1698. https://doi.org/10.1007/s11694-020-00417-0.
- Çelik, S. E., M. Özyürek, K. Güçlü, R. Apak. 2010. “Determination of Antioxidants by a Novel On-Line HPLC-Cupric Reducing Antioxidant Capacity (CUPRAC) Assay with Post-Column Detection.” Analytica Chimica Acta 674 (1): 79–88. https://doi.org/10.1016/j.aca.2010.06.013.
- Chana-Thaworn, J., S. Chanthachum, and T. Wittaya. 2011. “Properties and Antimicrobial Activity of Edible Films Incorporated with Kiam Wood (Cotyleobium Lanceotatum) Extract.” LWT - Food Science and Technology 44:284–292. https://doi.org/10.1016/j.lwt.2010.06.020.
- Choo, K., Y. Ching, C. Chuah, S. Julai, and N.-S. Liou. 2016. “Preparation and Characterization of Polyvinyl Alcohol-Chitosan Composite Films Reinforced with Cellulose Nanofiber.” Materials 9 (8): 644. https://doi.org/10.3390/ma9080644.
- Dai, H., Y. Huang, and H. Huang. 2018. “Enhanced Performances of Polyvinyl Alcohol Films by Introducing Tannic Acid and Pineapple Peel-Derived Cellulose Nanocrystals.” Cellulose 25 (8): 4623–4637. https://doi.org/10.1007/s10570-018-1873-5.
- Donlan, R. M. 2002. “Biofilms: Microbial Life on Surfaces.” Emerging Infectious Diseases 8:881–890. https://doi.org/10.3201/eid0809.020063.
- Eisa, W. H., and A. A. Shabaka. 2013. “Ag Seeds Mediated Growth of Au Nanoparticles within PVA Matrix: An Eco-Friendly Catalyst for Degradation of 4-Nitrophenol.” Reactive and Functional Polymers 73:1510–1516. https://doi.org/10.1016/j.reactfunctpolym.2013.07.018.
- Fontana, A. J. 2000. “Understanding the Importance of Water Activity in Food.” Cereal Foods World 45:7–10. https://www.mendeley.com/catalogue/ec8f200e-8481-313e-b7be-2e0f8c6a8fdb/?utm_source=desktop&utm_medium=1.19.8&utm_campaign=open_catalog&userDocumentId=%7Bd08aaa91-4b62-462b-a785-ba9e9df61d53%7D.
- Galiwango, E., N. S. Abdel Rahman, A. H. Al-Marzouqi, M. M. Abu-Omar, and A. A. Khaleel. 2019. “Isolation and Characterization of Cellulose and α-Cellulose from Date Palm Biomass Waste.” Heliyon 5:e02937. https://doi.org/10.1016/j.heliyon.2019.e02937.
- Ghaderi, M., M. Mousavi, H. Yousefi, and M. Labbafi. 2014. “All-Cellulose Nanocomposite Film Made from Bagasse Cellulose Nanofibers for Food Packaging Application.” Carbohydrate Polymers 104:59–65. https://doi.org/10.1016/j.carbpol.2014.01.013.
- Glišić, M., D. Lakušić, J. Šinžar-Sekulić, and S. Jovanović. 2014. “GIS Analysis of Spatial Distribution of Invasive Tree Species in the Protected Natural Area of Mt.” Avala (Serbia) Botanica Serbica 38:131–138. https://www.mendeley.com/catalogue/6f1baa58-b3a0-3d83-91df-cc411146f4c7/?utm_source=desktop&utm_medium=1.19.8&utm_campaign=open_catalog&userDocumentId=%7B53fb6d48-0eaa-4243-b28e-da1a9773236b%7D.
- Han, J., C. Zhou, Y. Wu, F. Liu, and Q. Wu. 2013. “Self-Assembling Behavior of Cellulose Nanoparticles During Freeze-Drying: Effect of Suspension Concentration, Particle Size, Crystal Structure, and Surface Charge.” Biomacromolecules 14:1529–1540. https://doi.org/10.1021/bm4001734.
- Harini, K., and M. Sukumar. 2019. “Development of Cellulose-Based Migratory and Nonmigratory Active Packaging Films.” Carbohydrate Polymers 204:202–213. https://doi.org/10.1016/j.carbpol.2018.10.018.
- Huang, W., Y. Yang, B. Zhao, G. Liang, S. Liu, X.-L. Liu, D.-G. Yu, et al. 2018. “Fast Dissolving of Ferulic Acid via Electrospun Ternary Amorphous Composites Produced by a Coaxial Process.” Pharmaceutics 10 (3): 115. https://doi.org/10.3390/pharmaceutics10030115.
- Hu, Z., R. M. Berry, R. Pelton, and E. D. Cranston. 2017. “One-Pot Water-Based Hydrophobic Surface Modification of Cellulose Nanocrystals Using Plant Polyphenols.” ACS Sustainable Chemistry & Engineering 5:5018–5026. https://doi.org/10.1021/acssuschemeng.7b00415.
- Jeschull, F., F. Scott, and S. Trabesinger. 2019. “Interactions of Silicon Nanoparticles with Carboxymethyl Cellulose and Carboxylic Acids in Negative Electrodes of Lithium-Ion Batteries.” Journal of Power Sources 431:63–74. https://doi.org/10.1016/j.jpowsour.2019.05.036.
- Johar, N., I. Ahmad, and A. Dufresne. 2012. “Extraction, Preparation and Characterization of Cellulose Fibres and Nanocrystals from Rice Husk.” Industrial Crops and Products 37:93–99. https://doi.org/10.1016/j.indcrop.2011.12.016.
- Jonoobi, M., A. Khazaeian, P. M. Tahir, S. S. Azry, and K. Oksman. 2011. “Characteristics of Cellulose Nanofibers Isolated from Rubberwood and Empty Fruit Bunches of Oil Palm Using Chemo-Mechanical Process.” Cellulose 18:1085–1095. https://doi.org/10.1007/s10570-011-9546-7.
- Karadag, A., B. Ozcelik, and S. Saner. 2009. “Review of Methods to Determine Antioxidant Capacities.” Food Analytical Methods 2 (1): 41–60. https://doi.org/10.1007/s12161-008-9067-7.
- Kassab, Z., I. Kassem, H. Hannache, R. Bouhfid, A. E. K. Qaiss, and M. El Achaby. 2020. “El Achaby M. Tomato Plant Residue As New Renewable Source for Cellulose Production: Extraction of Cellulose Nanocrystals with Different Surface Functionalities.” Cellulose 27 (8): 4287–4303. https://doi.org/10.1007/s10570-020-03097-7.
- Latos-Brozio, M., and A. Masek. 2020. “The Application of Natural Food Colorants as Indicator Substances in Intelligent Biodegradable Packaging Materials.” Food and Chemical Toxicology 135:110975. https://doi.org/10.1016/j.fct.2019.110975.
- Laxmeshwar, S. S., D. J. Madhu Kumar, S. Viveka, and G. K. Nagaraja. 2012. “Preparation and Properties of Biodegradable Film Composites Using Modified Cellulose Fibre-Reinforced with PVA.” ISRN Polymer Science 2012:1–8. https://doi.org/10.5402/2012/154314.
- Madhu, G., V. C. Bose, A. S. Aiswaryaraj, K. Maniammal, and V. Biju. 2013. “Defect Dependent Antioxidant Activity of Nanostructured Nickel Oxide Synthesized Through a Novel Chemical Method.” Colloids and Surfaces A: Physicochemical and Engineering Aspects 429:44–50. https://doi.org/10.1016/j.colsurfa.2013.03.055.
- Majumdar, S., and B. Adhikari. 2005. “Polyvinyl alcohol-cellulose composite: a taste sensing material.” Bulletin of Materials Science 28:703–712. https://doi.org/10.1007/BF02708541.
- Marinas, I. C., G. Gradisteanu Pircalabioru, E. Oprea, E.-I. Geana, I. Zgura, C. Romanitan, E. Matei, et al. 2023. “Physico-Chemical and Pro-Wound Healing Properties of Microporous Cellulosic Sponge from Gleditsia Triacanthos Pods Functionalized with Phytolacca americana Fruit Extract.” Cellulose 30 (16): 10313–10339. https://doi.org/10.1007/s10570-023-05491-3.
- Martínez, J. 2002. “Microbial Bioburden on Oral Solid Dosage Forms.” Pharmaceutical Technology: 26. https://www.mendeley.com/catalogue/04f49a8f-22f4-376c-87e5-a9d1fde01cd0/?utm_source=desktop&utm_medium=1.19.8&utm_campaign=open_catalog&userDocumentId=%7B25f90e21-0a82-428c-aab8-fc997a19698d%7D.
- Miladi, H., R. Slama, M. D. Ben, S. Zouari, A. Bakhrouf, and E. Ammar. 2013. “Essential Oil of Thymus Vulgaris L. and Rosmarinus Officinalis L.: Gas Chromatography-Mass Spectrometry Analysis, Cytotoxicity and Antioxidant Properties and Antibacterial Activities Against Foodborne Pathogens.” Natural Science 5 (06): 729–739. https://doi.org/10.4236/ns.2013.56090.
- Milovanovic, S., D. Markovic, K. Aksentijevic, D. B. Stojanovic, J. Ivanovic, and I. Zizovic. 2016. “Application of Cellulose Acetate for Controlled Release of Thymol.” Carbohydrate Polymers 147:344–353. https://doi.org/10.1016/j.carbpol.2016.03.093.
- Ngadaonye, J. I., L. M. Geever, J. Killion, and C. L. Higginbotham. 2013. “Development of Novel Chitosan-Poly(n,n-Diethylacrylamide) IPN Films for Potential Wound Dressing and Biomedical Applications.” Journal of Polymer Research 20 (7): 161. https://doi.org/10.1007/s10965-013-0161-1.
- Ozcelik, B., J. H. Lee, and D. B. Min. 2003. “Effects of Light, Oxygen, and pH on the Absorbance of 2,2-Diphenyl-1-Picrylhydrazyl.” Journal of Food Science 68:487–490. https://doi.org/10.1111/j.1365-2621.2003.tb05699.x.
- Pasquini, D., E. de Morais Teixeira, A. A. da Silva Curvelo, M. N. Belgacem, and A. Dufresne. 2008. “Surface Esterification of Cellulose Fibres: Processing and Characterisation of Low-Density Polyethylene/Cellulose Fibres Composites.” Composites Science and Technology 68 (1): 193–201. https://doi.org/10.1016/j.compscitech.2007.05.009.
- Peng, Y., Y. Wu, and Y. Li. 2013. “Development of Tea Extracts and Chitosan Composite Films for Active Packaging Materials.” International Journal of Biological Macromolecules 59:282–289. https://doi.org/10.1016/j.ijbiomac.2013.04.019.
- Popa, M., B. C. Ciobanu, L. Ochiuz, J. Desbrieres, C. S. Stan, and C. A. Peptu. 2018. “Controlling the Release Kinetics of Calcein Loaded Liposomes from Chitosan/Tannic Acid and Chitosan/Poly (Vinyl Alcohol)/Tannic Acid Hydrogels.” 52:353–370. https://www.cellulosechemtechnol.ro/pdf/CCT5-6(2018)/p.353-370.pdf.
- Prior, R. L., X. Wu, and K. Schaich. 2005. “Standardized Methods for the Determination of Antioxidant Capacity and Phenolics in Foods and Dietary Supplements.” Journal of Agricultural and Food Chemistry 53 (10): 4290–4302. https://doi.org/10.1021/jf0502698.
- Realini, C. E., and B. Marcos. 2014. “Active and Intelligent Packaging Systems for a Modern Society.” Meat Science 98 (3): 404–419. https://doi.org/10.1016/j.meatsci.2014.06.031.
- Reichling, J., P. Schnitzler, U. Suschke, and R. Saller. 2009. “Essential Oils of Aromatic Plants with Antibacterial, Antifungal, Antiviral, and Cytotoxic Properties – an Overview.” Complementary Medicine Research 16 (2): 79–90. https://doi.org/10.1159/000207196.
- Sabiha-Hanim, S., M. A. Mohd Noor, and A. Rosma. 2015. “Fractionation of Oil Palm Frond Hemicelluloses by Water or Alkaline Impregnation and Steam Explosion.” Carbohydrate Polymers 115:533–539. https://doi.org/10.1016/j.carbpol.2014.08.087.
- Sajjadi, S. E., Y. Shokoohinia, and N.-S. Moayedi. 2012. “Isolation and Identification of Ferulic Acid from Aerial Parts of Kelussia Odoratissima Mozaff.” Jundishapur Journal of Natural Pharmaceutical Products 7 (4): 159–162. https://doi.org/10.17795/jjnpp-4861.
- Schvartzman, M. S., C. Belessi, F. Butler, P. N. Skandamis, and K. N. Jordan. 2011. “Effect of pH and Water Activity on the Growth Limits of Listeria Monocytogenes in a Cheese Matrix at Two Contamination Levels.” Journal of Food Protection 74 (11): 1805–1813. https://doi.org/10.4315/0362-028X.JFP-11-102.
- Sharma, S., S. Barkauskaite, B. Duffy, A. K. Jaiswal, and S. Jaiswal. 2020. “Characterization and Antimicrobial Activity of Biodegradable Active Packaging Enriched with Clove and Thyme Essential Oil for Food Packaging Application.” Foods 9 (8): 1117. https://doi.org/10.3390/foods9081117.
- Shchipunov, Y. 2012. “Bionanocomposites: Green Sustainable Materials for the Near Future.” Pure and Applied Chemistry 84 (12): 2579–2607. https://doi.org/10.1351/PAC-CON-12-05-04.
- Silva, M. A. D., A. C. K. Bierhalz, and T. G. Kieckbusch. 2009. “Alginate and Pectin Composite Films Crosslinked with Ca2+ Ions: Effect of the Plasticizer Concentration.” Carbohydrate Polymers 77 (4): 736–742. https://doi.org/10.1016/j.carbpol.2009.02.014.
- Sinharay, S., and M. Bousmina. 2005. “Biodegradable Polymers and Their Layered Silicate Nanocomposites: In Greening the 21st Century Materials World.” Progress in Materials Science 50 (8): 962–1079. https://doi.org/10.1016/j.pmatsci.2005.05.002.
- Stan, G. E., T. Tite, A.-C. Popa, I. M. Chirica, C. C. Negrila, C. Besleaga, I. Zgura, et al. 2020. “The Beneficial Mechanical and Biological Outcomes of Thin Copper-Gallium Doped Silica-Rich Bio-Active Glass Implant-Type Coatings.” Coatings 10 (11): 1119. https://doi.org/10.3390/coatings10111119.
- Suganthi, S., S. Vignesh, J. Kalyana Sundar, and V. Raj. 2020. “Fabrication of PVA Polymer Films with Improved Antibacterial Activity by Fine-Tuning via Organic Acids for Food Packaging Applications.” Applied Water Science 10 (4): 100. https://doi.org/10.1007/s13201-020-1162-y.
- Taflick, T., L. A. Schwendler, S. M. L. Rosa, C. I. D. Bica, and S. M. B. Nachtigall. 2017. “Cellulose Nanocrystals from Acacia Bark–Influence of Solvent Extraction.” International Journal of Biological Macromolecules 101:553–561. https://doi.org/10.1016/j.ijbiomac.2017.03.076.
- Taheri, P., R. Jahanmardi, M. Koosha, and S. Abdi. 2020. “Physical, Mechanical and Wound Healing Properties of Chitosan/Gelatin Blend Films Containing Tannic Acid And/Or Bacterial Nanocellulose.” International Journal of Biological Macromolecules 154:421–432. https://doi.org/10.1016/j.ijbiomac.2020.03.114.
- Takahashi, H., M. Kashimura, H. Koiso, T. Kuda, and B. Kimura. 2013. “Use of Ferulic Acid As a Novel Candidate of Growth Inhibiting Agent Against Listeria Monocytogenes in Ready-To-Eat Food.” Food Control 33 (1): 244–248. https://doi.org/10.1016/j.foodcont.2013.03.013.
- Talari, A. C. S., M. A. G. Martinez, Z. Movasaghi, S. Rehman, and I. U. Rehman. 2017. “Advances in Fourier Transform Infrared (FTIR) Spectroscopy of Biological Tissues.” Applied Spectroscopy Reviews 52 (5): 456–506. https://doi.org/10.1080/05704928.2016.1230863.
- Tang, X. Z., P. Kumar, S. Alavi, and K. P. Sandeep. 2012. “Recent Advances in Biopolymers and Biopolymer-Based Nanocomposites for Food Packaging Materials.” Critical Reviews in Food Science and Nutrition 52 (5): 426–442. https://doi.org/10.1080/10408398.2010.500508.
- Tao, R., J. Sedman, and A. Ismail. 2021. “Antimicrobial Activity of Various Essential Oils and Their Application in Active Packaging of Frozen Vegetable Products.” Food Chemistry 360:129956. https://doi.org/10.1016/j.foodchem.2021.129956.
- Thaipong, K., U. Boonprakob, K. Crosby, L. Cisneros-Zevallos, and D. Hawkins Byrne. 2006. “Comparison of ABTS, DPPH, FRAP, and ORAC Assays for Estimating Antioxidant Activity from Guava Fruit Extracts.” Journal of Food Composition and Analysis 19 (6–7): 669–675. https://doi.org/10.1016/j.jfca.2006.01.003.
- Vasconcelos, A., A. Gomes, and A. Cavaco-Paulo. 2012. “Novel Silk Fibroin_elastin Wound Dressings - CORE Reader.” Acta Biomaterialia 8 (8): 3049–3060. https://doi.org/10.1016/j.actbio.2012.04.035.
- Vermeiren, L., F. Devlieghere, M. van Beest, N. de Kruijf, and J. Debevere. 1999. “Developments in the Active Packaging of Foods.” Trends in Food Science & Technology 10 (3): 77–86. https://doi.org/10.1016/S0924-2244(99)00032-1.
- Vítková, M., J. Müllerová, J. Sádlo, J. Pergl, and P. Pyšek. 2017. “Black Locust (Robinia pseudoacacia) Beloved and Despised: A Story of an Invasive Tree in Central Europe.” Forest Ecology and Management 384:287–302. https://doi.org/10.1016/j.foreco.2016.10.057.
- Vogler, E. A. 1998. “Structure and Reactivity of Water at Biomaterial Surfaces.” Advances in Colloid and Interface Science 74 (1–3): 69–117. https://doi.org/10.1016/S0001-8686(97)00040-7.
- Wang, Z., Z. Yao, J. Zhou, M. He, Q. Jiang, A. Li, S. Li, et al. 2019. “Improvement of Polylactic Acid Film Properties Through the Addition of Cellulose Nanocrystals Isolated from Waste Cotton Cloth.” International Journal of Biological Macromolecules 129:878–886. https://doi.org/10.1016/j.ijbiomac.2019.02.021.
- Wing, R. E. 1996. “Starch Citrate: Preparation and Ion Exchange Properties.” Starch - Stärke 48 (7–8): 275–279. https://doi.org/10.1002/star.19960480709.
- Yang, S., Y. Zhang, W. Yue, W. Wang, Y.-Y. Wang, T.-Q. Yuan, R.-C. Sun, et al. 2016. “Valorization of Lignin and Cellulose in Acid-Steam-Exploded Corn Stover by a Moderate Alkaline Ethanol Post-Treatment Based on an Integrated Biorefinery Concept.” Biotechnology for Biofuels 9 (1): 238. https://doi.org/10.1186/s13068-016-0656-1.
- Yao, S., S. Nie, H. Zhu, S. Wang, X. Song, and C. Qin. 2017. “Extraction of Hemicellulose by Hot Water to Reduce Adsorbable Organic Halogen Formation in Chlorine Dioxide Bleaching of Bagasse Pulp.” Industrial Crops and Products 96:178–185. https://doi.org/10.1016/j.indcrop.2016.11.046.
- Yu, H.-Y., D.-Z. Zhang, F.-F. Lu, and J. Yao. 2016. “New Approach for Single-Step Extraction of Carboxylated Cellulose Nanocrystals for Their Use as Adsorbents and Flocculants.” ACS Sustainable Chemistry & Engineering 4 (5): 2632–2643. https://doi.org/10.1021/acssuschemeng.6b00126.
- Zhuo, X., C. Liu, R. Pan, X. Dong, and Y. Li. 2017. “Nanocellulose Mechanically Isolated from Amorpha Fruticosa Linn.” ACS Sustainable Chemistry & Engineering 5 (5): 4414–4420. https://doi.org/10.1021/acssuschemeng.7b00478.
- Zuluaga, R., J.-L. Putaux, A. Restrepo, I. Mondragon, and P. Gañán. 2007. “Cellulose Microfibrils from Banana Farming Residues: Isolation and Characterization.” Cellulose 14 (6): 585–592. https://doi.org/10.1007/s10570-007-9118-z.