
 ?Mathematical formulae have been encoded as MathML and are displayed in this HTML version using MathJax in order to improve their display. Uncheck the box to turn MathJax off. This feature requires Javascript. Click on a formula to zoom.
ABSTRACT
The paper investigates the effect of machine setting on breaking strength, breaking elongation, and pick-up percentage of sized yarn properties. The factors considered are concentration of size solution, squeezing pressure and counts of yarn, the aim to develop a regression model that shows the effect of factors on size pick-up percentage, breaking strength regain, and loss in breaking elongation. The experiment is conducted by using 16 Ne and 21 Ne of cotton yarn, 3 Bar and 5 Bar of squeezing pressure, and 1.9% and 6% of size concentration with maize starch as sizing agent. A factorial design with two factors and 5 replicants has been used to design the experiment and analyze the results. The result showed that a slight change in squeezing pressure and concentration significantly affects the pick-up percentage, breaking strength regain and breaking elongation loss while a change of yarn count would not have a significant effect on the pick-up percentage of sized yarn. Furthermore, for achieving optimum properties of the sized yarn the pressure of squeezing, the count of the yarn and the concentration of the solution should be adjusted, and a regression model is developed to investigate the properties of the sized yarn by considering considered factors.
摘要
研究了棉纱上浆过程中机器设置对浆纱断裂强力、断裂伸长率和上浆纱性能的影响. 本研究考虑的因素是浆料浓度、挤压压力和纱线支数. 本研究旨在建立一个回归模型,显示使用不同支数的纱线、挤压压力、浆料浓度对浆料的上浆率、断裂强力回复率和断裂伸长率损失的影响. 实验在Else Addis Industrial PLC中进行,使用16 Ne和21 Ne的纱线支数,3巴和5巴的挤压压力,以及1.9%和6%的浆料浓度,使用玉米淀粉作为施胶剂. 采用两因素和5个重复因子的因子设计对实验进行设计并对结果进行分析. 分析结果表明,挤压压力和浆料浓度的微小变化对上浆纱的拾取率、断裂强力回复率和断裂伸长率损失有显著影响,而纱线支数的变化对上浆纱线的拾取率没有显著影响. 此外,为了获得上浆纱的最佳性能,应调整挤压压力、纱线数量和溶液浓度,并通过考虑因素建立回归模型来研究上浆纱的性能.
Introduction
The warp sizing process is a critical step to enhance the productivity and quality of sized yarn by increasing the weave ability of warp yarns. To achieve these property optimal selection of size recipes, drying cylinder temperature and density of sized warp yarns have to be considered (Kovačević and Gordoš Citation2009). The cases of warp yarn breakages during weaving process primarily happen due to improper amount of size pick-up, the composition of sizing agents, and the proportion of individual components within the size formulation (Ahmed et al. Citation2021; Hadina and Kovacevic Citation1998).
Through precise sizing practices, warp yarns are protected from the restrictions of the weaving process, thereby optimizing loom efficiency, and achieving the desired fabric quality. Attaining qualitative sizing needs an optimal application of sizing agents onto the yarn to strengthen it and reinforce weak points (Slauson, Miller, and Rebenfeld Citation1984; Walker and Perkins Citation1985).
As fabric is produced, dynamic forces applied during beat-up actions, and the shedding motion may increase the breaking limit of sized yarns if the yarn is improperly sized. To overcome these problems the weak points of the yarn effectively strengthened during the sizing phase (Kovačević and Gordoš Citation2009). Sizing serves to bind fibers in their original positions pre-sizing, concurrently forming a protective surface film on the yarn, thereby enhancing its abrasion resistance.
Several sizing machines setting and parameters, such as machine speed, squeezing roller pressure, size paste concentration, saw box temperature, and stretch control are critical for ensuring the quality of the size yarn. These parameters must be controlled to achieve optimal sized yarn properties (Muhammad Citation2011; Zakaria et al. Citation2015). Optimum-sized yarn should exhibit enhanced tensile strength with minimal loss of elasticity at the same time improving weaving performance (Pleva and Rieger Citation1992). Moreover, the weaver’s beam should be free from missing ends, cross ends, lappers, and taped ends to ensure smooth unwinding on the weaving machine during fabric production process (Hadina and Kovacevic Citation1998; Kovačević and Gordoš Citation2009).
The composition of size liquor primarily consists of sizing agents and auxiliary agents, which enhance adhesiveness and penetration into the yarn’s pore’s part. Lubricants and wax are also used to maintain yarn elasticity and flexibility while forming a protective film around the thread (Cancik et al. Citation2014; Kovačević Citation2000).
Modern sizing machines had automated regulation of size level and temperature in the size box, alongside controlling the depth of immersion and sizing speed (Santhosh and Poorna Citation2014; Sawhney, Price, and Calamari Citation2004).
Squeezing rollers play a vital role in removing excess size paste from the wet warp ends, ensuring the desired size pickup, and facilitating size penetration into the yarn (Bauder Citation2000). The degree of squeeze and penetration depends on squeeze roller hardness, thickness of roller covering, and pressure applied at the squeezing nip (Oljača Citation2006; Turukmane, Gulhane, and Patil Citation2019). Warp stretch is another factor to be considered in the sizing process. Although stretching can affect strength by up to 15–20%, the application of size reduces yarn stretchability, thereby increasing warp breakages during weaving, declining production efficiency, and posing undesirable challenges (Adivarekar et al. Citation2011; Kovačević, Penava, and Oljača Citation2006). As illustrated in and , increasing the size percentage up to an optimal point positively impacts the efficiency and reduces the breakage of warp yarn. However, any further increase beyond this optimal size percentage will negatively affect the efficiency and increase the breakage of the sized yarn.
Figure 1. Effect of size percentage on performance of produced fabric ().
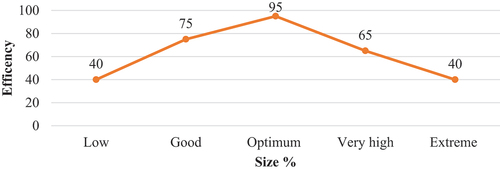
Figure 2. Effect of size percentage on warp yarn breakage rate during weaving (16).
Fiber Fineness and Linear Density
The linear density of yarn is greatly influenced by the fineness of the fibers composing it. Optimal and uniform yarn quality is achieved when fibers are parallelly distributed within the yarn cross-section, resulting in a higher fiber count. In essence, courser fibers contribute to a greater number of fibers per cross-section, yielding a more uniform yarn (Hari, Subramanian, and Aggarwal Citation1987). Linear density is quantified by the mass per unit length of yarn, determined through testing procedures.
Refractometer (concentration of sizing solution)
Viscosity, or the resistance to liquid flow, is a critical parameter in sizing operations. Changes in temperature and concentration of the sizing solution directly impact viscosity, thereby influencing size pick-up percentage and penetration depth (Adivarekar et al. Citation2011; Kovačević, Penava, and Oljača Citation2006). Higher viscosity levels generally lead to increased size pick-up. However, exceeding optimal temperature can result in decreased pick-up rates (Hari, Subramanian, and Aggarwal Citation1987).
Squeezing pressure and nip conditions
The positioning and pressure applied by squeezing rollers are helpful in determining the extent of size paste penetration into the yarn. In addition, they aid in the removal of excess size paste, thereby affecting the overall size pick-up percentage. Proper adjustment of squeezing pressure and nip conditions is essential for optimal sizing outcomes (Heap and Bradford Citation1988; Slauson, Miller, and Rebenfeld Citation1984; Trauter Citation1989).
The practical application and development of linear regression modeling facilitate process optimization, particularly in determining the optimal levels of warp yarn breaking strength, breaking elongation, and pick-up percentage for minimizing warp yarn breakage and to achieve the desired productivity of the fabric (Nurwaha and Wang Citation2012; Seboka Citation2020).
The originality of the paper lies in its comprehensive investigation, development of a regression model, thorough experimental design, and its practical application, which collectively contribute to advancing knowledge in the field of textile cotton yarn sizing.
The research thoroughly investigates various factors affecting the textile cotton yarn sizing process, including concentration of size solution, squeezing pressure, and yarn count. By considering these factors, the study provides a holistic understanding of the sizing process and its impact on yarn properties.
The study aims to develop a regression model to demonstrate the relationship between different variables such as yarn count, squeezing pressure, and size concentration with pick-up percentage, breaking strength regain, and elongation loss. This regression model adds a quantitative dimension to understanding the interpretation of these factors.
Materials and method
Materials
Yarn
16 and 21 Ne count of SCHLAFHORST open-end spun yarn were used to make a sizing process and the optimum yarn breaking strength, pick up and elongation loss of the sized material were investigated as shown in .
Table 1. Sample raw cotton yarn parameters.
Sizing material
Commercially available with affordable price of maize starch used to coating the warp yarn. The maize Starch is manufactured and processed in a local Company and prepared a solution by adding 15 Kg onto 600 Liter of water.
Methodology
Yarn sizing
The warp yarn was sized with maize starch by varying squeezing roller pressure, viscosity of size solution for 16 Ne and 21Ne count of yarn. The sizing process was conducted by using BENNINGER double-sized box sizing machine. To prepare the size material the determined amount of maize starch was added to the mixing tank following with the required amount of water. The temperature rose with steam to 90°C and stirred for 20 minutes to utilize for the sizing application. The parameters of the sizing process are found in .
Table 2. Actual vs new designed parameters of the sizing process.
Every Sizing ingredient has a Solid Content. In Maize Starch there will be moisture content from 10% to 14%. In Acrylic Binders the Solid Content will be 25% to 30% only. PVA may take 100% Solid Content (Seboka Citation2020)
For Size recipe: PVA − 20kgs. Solid − 20
Maize − 15kgs Solid − 15 × 0.9–13.5
Steam Condensation − 15%
So total Volume; Total solution * 1.15
Yarn property testing
The breaking strength, yarn elongation and pick up percentage properties of sized yarn were tested based on standard procedures.
Strength regains and elongation loss
The amount of strength regains due to the application of sizing material and elongation loss due to the applied force on the warp yarn were calculated by using the following formula.
Elongation loss
The elongation loss percentage was measured by using the formula.
Strength regain
The percentage increment in the sized yarn strength is measured by.
Size pick-up
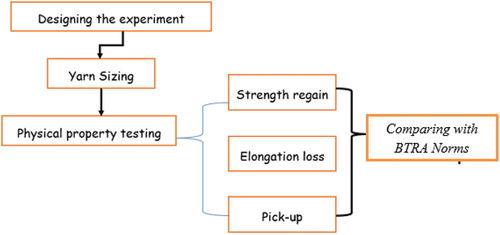
the detail experimental design is found in . The size pick-up, P%, is defined as the percentage of mass of size solution remaining in the yarn after squeezing by rollers to unit mass of oven-dried unsized yarn and can be given as
Figure 3. Experimental procedure of the research.
Experimental design
Design expert 11 software with Factorial design methodology was used to design the experiment and analyze the results of the experiment. To conduct this experiment concentration of size paste, counts of yarn and pressure of squeezing roller each at two levels have been selected (minimum and maximum level) and the responses for this experiment were pick-up percentage, breaking strength regain, and elongation loss percentage. The level of the factors and responses are found in . Moreover, the comparison of the significance level of the sized yarn parameter with BTRA norms is conducted by SPSS software.
Table 3. Experimental design for optimization of pick-up, strength regain and elongation loss by taking different count and viscosity of size solution.
Characterization of yarn property
The samples subjected to standard testing atmosphere of 65% Relative Humidity and 21 ± 2◦C Temperature before testing is conducted.
Strength regains and elongation loss
The amount of breaking strength regains due to the application of sizing material and elongation loss due to the applied force on the warp yarn measured based on ASTM-D2256 standards. The breaking strength and elongation loss of the yarns were examined before and after sizing process using a tensile strength testing machine. The speed and gauge of universal strength tester machine used were 300 mm/min and 500 mm respectively (Maatoug, Ladhari, and Sakli Citation2007b; Rehman et al. Citation2015).
Size pick-up
The size pick-up percentage of sized yarn was conducted by using gravimetric analysis method. The dry weight of size and unsized yarn were measured according to ASTM D377 followed by using ETADRY machine. To determine the dry weight of sized and unsized yarn, as per ASTM D3776 the specified length of yarn is subjected measuring the weight of by electrical balance following with oven-drying process, the process is repeated until constant weight is obtained. Subsequently, the size pick-up percentage of the yarn computed using the formula outlined in EquationEquation (4)(4)
(4) . For each sample five replicate measurements were taken, and the average value utilized for subsequent analysis.
Result and discussion
Yarn strength regain, elongation loss and size pick-up were measured. The results of the experiment were analyzed to understand how much the effect of each parameter. A three factor experiment n = 5 replicates, i.e., 8 runs of experimentation are conducted. The selection of treatment levels is made by design expert software 11 factorial design.
Breaking strength and elongation loss
Determining the adhesive force between the size materials and cotton yarn involved assessing the breaking strength of sized warp using a tensile strength tester machine, following established procedures.
Size pick-up
The size take-up percentage denotes the quantity of size materials deposited onto the surface of the warp yarn. The factors influencing size pick-up, namely, viscosity, squeezing pressure and depth of immersion roller was analyzed through ANOVA and regression analysis is developed and the detailes are found in and .
Table 4. Breaking strength and elongation loss and pick-up percentage of 16Ne maize starch sized yarn at pressure of 3 Bar.
Table 5. Breaking strength and elongation loss and pick-up percentage of 16Ne maize starch sized yarn at pressure of 5 bar.
To determine the pick-up percentage, a predetermined length of yarn is measured for sized and unsized yarn. The pressure applied in the nip of the squeezing rollers plays a decisive role in influencing wet pick-up, thus impacting drying costs. Increased pressure results in higher wet pick-up, enhancing the adhesion of size paste to the yarn surface, thereby ensuring improved protection.
The squeezing pressure is critical in achieving a consistent application of size paste. The positioning and pressure exerted by the squeezing rollers determine the depth of penetration of the size paste into the yard and affects the size pick up percentage. In the case of highly twisted yarn, extending the residence time is necessary to enhance penetration and achieve the optimal pick-up percentage and the details are found in and .
Table 6. Breaking strength, elongation loss and pick-up percentage of 21Ne maize starch sized yarn at squeezing roller pressure of 3 bar.
Table 7. Breaking strength, elongation loss and pick-up percentage of 21Ne maize starch sized yarn at squeezing roller pressure of 5 bar.
As shown in , increasing the concentration of the size solution from 1.9% to 6% correlates with an increase in both pick-up and strength regain percentages, while the percentage of elongation loss is notably impacted by this concentration increment. Similarly, increasing the pressure of the squeezing roller yields a positive effect on the enhancement of strength regain and pick-up percentage of the sized yarn, particularly when dealing with finer yarn counts.
Table 8. Summarized result of strength regains, pick-up and elongation loss at different level of concentration, pressure of squeezing roller and count of yarn.
Effect of squeezing roller pressure on sized yarn properties
The sizing beams for 16 Ne and 21 Ne counts of yarn prepared on the sizing machine, with adjustments made to the squeezing pressure. Pressure bar of 3 for courser and 5 Bar for finer counts were employed. The outcomes are summarized in . Initially, two beams of different counts were prepared to analyze the impact of squeezing pressure at the loom. It observed that beams prepared in Trial 1 and 3, with 3 Bar pressure, exhibited slightly lower pick-up percentages but demonstrated better performance in terms of elongation loss percentage compared to Trial 2 and 4.
Table 9. Summarized result of strength regains, pick-up and elongation loss at different levels of concentration, pressure of squeezing roller and count of yarn.
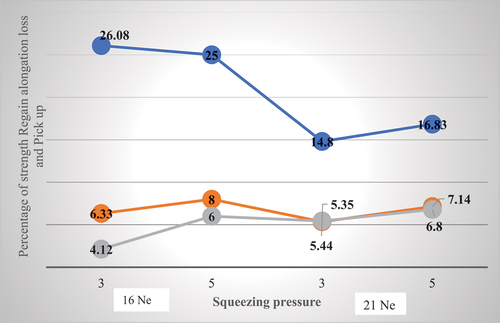
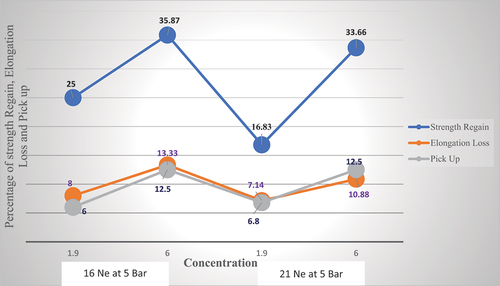
As shown in , that when the pressure of squeezing roller is increased the value of strength regain and pick up percentage is improved since as the pressure is increased, there is a tendency for better penetration of the yarn by the size solution. However, there is a negative effect on the loss of elongation percentage since as the strength regain is increased there is a tendency of more size materials remain on the yarn that makes the yarn stiffer which minimizes the elongation percentage of the yarn.
Figure 4. Shows effect of squeezing roller pressure on strength regain, elongation loss and pick up percentage at 1.9 concentration and 16 and 21 Ne of yarn.
In case of 16 Ne of yarn when the squeezing roller pressure is increased the breaking strength regain starts to decline since 3 Bar is more than enough to attain the maximum penetration for a given count of the yarn which is in agreement with (Ahmed et al. Citation2021; Nayak, Kasetty, and Murthy Citation2002; Rehman et al. Citation2015). Any increment of the pressure of the squeezing roller has a positive implication on the loss of elongation percentage.
The analysis indicates that higher squeeze pressure helps greater penetration of the yarn, resulting in increased breaking strength (Mia et al. Citation2021). The application of squeeze pressure serves to force out excess paste accumulated by the warp sheet. Moreover, it promotes uniform distribution of the paste across the yarn surface, facilitating penetration into the yarn structure. Conversely, higher squeeze pressure leads to a reduction in wet pick-up and add-on percentage (Sun et al. Citation2013).
Research on the impact of high-pressure squeezing during sizing showed that, despite maintaining the same level of size add-on percentage, higher pressure facilitates penetration of the size within the yarn structure (Tanapongpipat et al. Citation2008). Nevertheless, the thickness of the coating on the yarn’s surface decreases under high-pressure conditions. Consequently, this reduction in coating thickness minimizes the likelihood of size drop during weaving (Genene Abay and Ayele Citation2023; Wang, Wang, and Gao Citation2024).
The analysis of variance as shown in indicates that any change of squeezing roller pressure should have a significant effect on the performance of sized yarn which means when there is use of different amount of squeezing roller pressure the strength regains,elongation loss and pick up percentage of the sized yarn are highly influenced (Turukmane, Gulhane, and Patil Citation2019; Walker and Perkins Citation1985).
Table 10. ANOVA table for showing the effect of using different level of squeezing roller on strength regain elongation loss and pick up percentage.
Effect of concentration/refractometer on sized yarn properties
The concentration of the size solution has a positive effect on the breaking strength regain and pick up percentage of the yarn until it reaches to the optimum value. However beyond that any increment of the size pick up will have a negative effect on the performance and quality of the sized yarn (Kovačević and Penava Citation2004; Sanatgar et al. Citation2012). Hence when the loss of elongation percentage is increased there may be an increment of strength regain as found in since when the strength of the yarn is increase after sizing is performed most of the porosity part of the yarn is filled with size material which makes the yarn less extensible and inflexible (Maleki et al. Citation2015).
Figure 5. Shows effect of concentration/refractometer on strength regain, elongation loss and pick up percentage at 5 bar pressure and 16 and 21 Ne of yarn..
As the concentration of the size solution is increased in different counts of the yarn there is positive effect on breaking strength regains and pick up percentage of the yarn. The pick-up percentage is better as the count of the yarn is courser than that of the finer yarn (Behera and Gupta Citation2008; Djordjevic et al. Citation2019). When the elongation loss percentage during sizing process is higher the yarn could have lower performance to with stand the force that are applied on the yarn because of shedding, beating cyclic tension and strain applied (Tanapongpipat et al. Citation2008; Walker and Perkins Citation1985; Xiao and Zhang Citation2009). The detailes are found in and .
Table 11. Effect of concentration of size solution on strength regain, elongation loss and pick up percentage of yarn.
Table 12. Effect of count of yarn on strength regain, elongation loss and pick up percentage of yarn.
Any change of the concentration of the size solution would have a significant effect on the properties of sized yarn which means on the percentage of breaking strength regain, elongation loss and pick up percentage (Walker and Perkins Citation1985; Xiao and Zhang Citation2009). In any type of natural fiber as the concentration of the size solution is increased during sizing process there is an increment in strength regain and pick up percentage while the elongation percentage of the yarn starts to decline which leads to breakage of warp thread during fabric production process (Tanapongpipat et al. Citation2008; Yu Citation2015).
Effect of count of yarn on the properties of sized yarn
The yarn count significantly influences size pick-up, as yarn with lower counts acts as an “opener,” allowing for greater absorption of size compared to yarn with higher counts. Consequently, this difference in absorptive capacity leads to variations in size pick-up, which affects the overall sizing outcome (Djordjevic et al. Citation2014).
As shown on and as the count of the yarn changed by keeping the concentration and the pressure of the squeezing roller maximum, there is reduction of breaking strength regains and pick up percentage since the penetration rate of the size paste onto yarn during sizing process is reduced as the pressure of the squeezing roller is lower (Patil, Turukmane, and Raichurkar Citation2017). However, as the pressure of the squeezing roller is higher there is linear relationship of count of yarn and its strength regain percentage.
Figure 6. Shows effect of count of yarn on strength regain, elongation loss and pick up percentage at 3, 5 bar pressure at concentration of 1.9 and 6%..
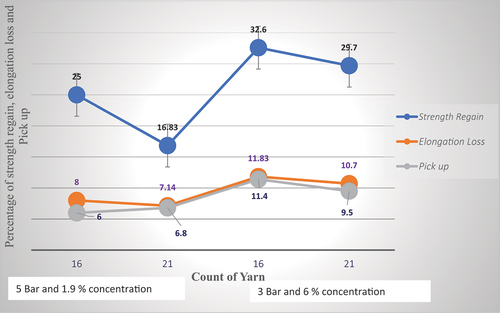
Table 13. ANOVA table for showing the effect of using different count of yarn on strength regain, elongation loss and pick up percentage.
As shown from the graph above any increment of the count of the yarn without changing the pressure of squeezing roller and concentration of the solution, there is reduction of strength regain and pick up percentage. However the elongation loss percentage has to be improved which is in agreement with (Amonova and Shavkievna Citation2022; Hari et al. Citation1989).
Courser yarn possesses a greater capacity to absorb size paste and as diameter of the yarn increases, it can accommodate a larger size paste. In addition, a larger diameter in yarn leads to a higher pick-up of size paste (Devare et al. Citation2016).
Size pick-up does not only depend on sizing conditions, but also the count of the yarn and the pick-up percentage of the sized yarn which determines the end breakages in the weaving process (Maatoug, Ladhari, and Sakli Citation2007a; Turukmane, Gulhane, and Patil Citation2019). As shown in in the ANOVA table the strength regains and elongation loss percentage of the sized yarn are highly influenced by the level of the count of the yarn to be sized. However, the pick-up percentage of the yarn is not highly affected by the count of the yarn being used for size ng process (El-Sheikh Citation2010). The percentage of the pick-up rate is affected numerically but it is not statistically significant.
Table 14. Comparison of significance level of sized yarn with BTRA norms by using SPSS software.
Determination of pick-up percentage
The regression model in EquationEquation (5)(5)
(5) shows that the count of yarn, the interaction of squeezing pressure with count of yarn, the interaction of squeezing roller with concentration and the interaction of count squeezing roller pressure and concentration have a negative correlation with size pick-up% (Devare et al. Citation2016; Sonawane et al. Citation2011). But it has a linear relationship with concentration of the size solution, pressure of squeezing roller and the interaction of count and concentration have a positive correlation with the size pick-up of the sized yarn.
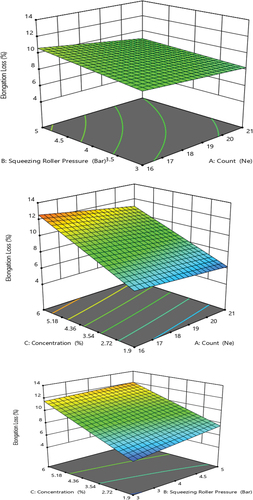
presents a 3D plot showcasing the interaction effects of independent variables on the percentage of size pick-up. Specifically, highlights that the interaction between concentration and count significantly influences the size pick-up percentage compared to other interactions. Additionally, the interaction between squeezing roller pressure and count exhibits a negative correlation. This suggests that to achieve optimal pick-up, one factor should be increased while the other factor decreases.
Figure 7. 3D plot indicating interaction effect B&C (a), A&C (b), A&B (C) size pick-up%.
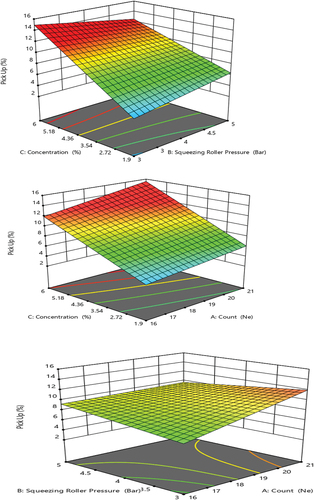
Where, (A) Count of yarn (B) pressure of squeezing roller (C) concentration of size solution
Determination breaking strength regains percentage
The regression model EquationEquation (6)(6)
(6) shows that the count of yarn, squeezing roller pressure, the interaction of squeezing pressure with count of yarn, the interaction of squeezing roller pressure and concentration of yarn and the interaction of three factors have a negative correlation with strength regain% (Devare et al. Citation2016). But it has linear relationship with concentration of the size solution and the interaction of concentration and count of yarn have a positive correlation with the strength regain of the sized yarn.
depicts a 3D plot demonstrating the interaction effects of an independent variable on the percentage of strength regain. Specifically, highlights that the interaction between concentration and count, as well as the interaction between concentration and squeezing roller pressure, result in improved strength regain percentages. Conversely, the interaction between squeezing roller pressure and count exhibits a negative ratio. This suggests that to achieve optimal strength regain, one factor should be increased while the other factor decreases.
Figure 8. 3D plot indicating interaction effect A&C (a), A&B (b), C&B (C) strength regain%.
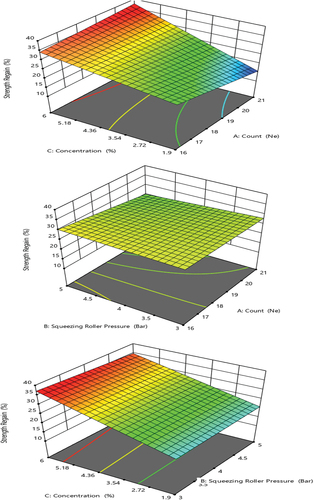
Where, (A) Count of yarn (B) pressure of squeezing roller (C) concentration of size solution.
Determination of breaking elongation loss percentage
The regression model Equation (7) indicates that the yarn count, the interaction between squeezing pressure and yarn count, the interaction between yarn count and concentration of the size solution, and the interaction between squeezing roller pressure and concentration of the size solution are negatively correlated with elongation loss percentage (Santhosh and Poorna Citation2014; Sonawane et al. Citation2011). Conversely, there exists a linear relationship between squeezing roller pressure and concentration of the size solution, both of which positively correlate with the elongation loss percentage of the sized yarn.
Where (A) Count of yarn (B) pressure of squeezing roller and (C) concentration of size solution
presents a 3D plot demonstrating the interaction effects of an independent variable on the percentage of elongation loss as in agreement with (Santhosh and Poorna Citation2014; Sonawane et al. Citation2011). Notably, in , the interactions between concentration and count, as well as between squeezing roller pressure and count, exhibit minimal elongation loss percentages. However, the interaction between squeezing roller pressure and concentration shows a positive ratio, indicating that to achieve optimal elongation loss, one factor should be increased while the other factor decreases.
Figure 9. 3D plot indicating interaction effect A&B (a), A&C (b), C&B (c) elongation loss %.
Conclusion
The research focuses on optimizing sizing parameters to enhance the performance and quality of sized yarn. Critical factors influencing the textile cotton yarn sizing process and the properties of the resultant sized yarn are assessed such as breaking strength, elongation loss, and pick-up percentage. The factors considered were concentration of size solution, squeezing pressure, and yarn count. The study uncovers their significant impact on the sizing process. The result showed that even slight adjustments in squeezing pressure and size solution concentration yield noticeable effects on pick-up percentage, breaking strength, and elongation loss. Interestingly, yarn count variations did not exhibit a significant influence on pick-up percentage, and their role in achieving optimal sized yarn properties cannot be understated. The adjustment of squeezing pressure, yarn count, and size solution concentration are very critical to attain desired yarn properties. Furthermore, the development of a regression model offers a systematic approach to understanding the complex interplay between these factors, providing valuable insights for optimizing the textile cotton yarn sizing process in industrial settings.
Ethos of the research
Comprehensive Yarn Analysis: We conduct an in-depth analysis of yarn counts across various sizes, enabling a comprehensive understanding of the relationship between count variations and other relevant parameters.
Adaptive Performance: Unlike existing models that are limited to specific yarn counts, our approach demonstrates adaptability across a spectrum of sizes, showcasing its versatility and robustness in real-world applications.
Practical Implications: Our study’s findings offer practical insights for industries reliant on yarn sizing, facilitating more efficient production processes and informed decision-making, ultimately contributing to enhanced product quality and cost-effectiveness.
Improved Efficiency in Yarn Production: By enabling the prediction of yarn count after sizing, this model can improve efficiency in yarn production. Manufacturers can quickly assess yarn properties without additional testing steps.
Novel and unique about the study
Tailored Regression Model: Our research introduces a novel regression model specifically designed to accommodate varying counts of sized yarn, setting of squeezing roller gap and depth of immersion roller, offering a tailored approach that adapts to the nuances of different yarn sizes.
Innovative Predictive Accuracy: By incorporating advanced statistical techniques, our model surpasses traditional methods in predicting yarn characteristics, providing enhanced accuracy even with diverse yarn counts.
Predicting Yarn Count Non-destructively: This research introduces a novel method to predict yarn count (a measure of yarn thickness) for sized yarns without needing to destroy the sample. Traditional methods often require cutting the yarn, making this approach highly valuable.
Data-Driven Approach to Yarn Property Assessment: This research emphasizes a data-driven approach to yarn property assessment. The developed model can be used for various yarn types and sizing processes.
Regression Model for Sized Yarns: This study focuses specifically on sized yarns, which are yarns treated with a coating to improve strength and weaving properties. Existing regression models might not be accurate for sized yarns, making this a unique contribution.
Authors’ contribution
Author 1: Derseh Yilie Limeneh: Conceptualization, methodology, software, validation, formal analysis, investigation, data curation, writing – original draft preparation.
Author 2: Million Ayele: Methodology formal analysis, investigation, data curation
Author 3: Mesfin Shiferaw: Methodology formal analysis, investigation, data curation.
Author 4: Addisu Ferede Tessema: visualization, writing – review and editing.
Author 5: Noureddine Abidi: Supervision, document review and editing.
Author 6: Zelalem Adane Alemar: software, validation, formal analysis.
Ethical approval
All content of this research didn’t involve human or animal use.
Disclosure statement
No potential conflict of interest was reported by the author(s).
References
- Adivarekar, R., P. Kandhavadivu, T. Ramachandran, B. G. Manohari, T. Sinha, T. Malik, C. Parvathi, T. Maruthavanan, S. Sivamani, and C. Prakash. 2011 Three-Dimensional measurement of Drape. Journal of the Textile Association 12 : 319 .
- Ahmed, T., R. Mia, G. F. I. Toki, J. Jahan, M. M. Hasan, M. A. S. Tasin, M. S. Farsee, and S. Ahmed. 2021. “Evaluation of Sizing Parameters on Cotton Using the Modified Sizing Agent.” Cleaner Engineering and Technology 5:100320. https://doi.org/10.1016/j.clet.2021.100320.
- Amonova, H. I., and S. S. Shavkievna. 2022. “Physico-Mechanical Characteristics of Sacked Yarn with Synthetic Polymers.” Gospodarka i Innowacje 22: 585–21 2545-0573 .
- Bauder, H. 2000. “Entwicklung eines Harnischs für hohe Drehzahlen.” Melliand Textilberichte 12 (11): 938–946 2000 .
- Behera, B., and R. Gupta. 2008. “Comparative Analysis of Desizability and Retrogradation Behavior of Various Sizing Materials.” Journal of Applied Polymer Science 109 (2): 1076–1082. https://doi.org/10.1002/app.28184.
- Cancik, E., S. De Martino, E. Devecchi, A. Invernizzi, C. Kepinski, and S. Mazzoni. 2014. “Andreas Schachner st John Simpson Roberta Venco Ricciardi Redazione scientifica: Carlo Lippolis Roberta Menegazzi Invisible People and Elite Customers .”
- Devare, M. D., R. Turukmane, S. Gulhane, and L. Patil. 2016. “Effect of Yarn Stretch in Sizing on Loom Performance.” International Journal of Textile Engineering & Processes 2 (4): 19–23.
- Djordjevic, S., S. Kovacevic, D. Djordjevic, and S. Konstantinovic. 2019. “Sizing Process of Cotton Yarn by Size from a Copolymer of Methacrylic Acid and Hydrolyzed Potato Starch.” Textile Research Journal 89 (17): 3457–3465. https://doi.org/10.1177/0040517518813628.
- Djordjevic, S., S. Kovacevic, L. Nikolic, M. Miljkovic, and D. Djordjevic. 2014. “Cotton Yarn Sizing by Acrylamide Grafted Starch Copolymer.” Journal of Natural Fibers 11 (3): 212–224. https://doi.org/10.1080/15440478.2013.874963.
- El-Sheikh, M. A. 2010. “Carboxymethylation of Maize Starch at Mild Conditions.” Carbohydrate Polymers 79 (4): 875–881. https://doi.org/10.1016/j.carbpol.2009.10.013.
- Genene Abay, A., and M. Ayele. 2023. “Multiple Response Optimization of Sizing Machine Settings and Sized Yarn Tensile Properties Using Advanced Method of Experimental Design.” Journal of Engineered Fibers and Fabrics 18:15589250231179621. https://doi.org/10.1177/15589250231179621.
- Hadina, J., and S. Kovacevic. 1998. “Influence of Yarn Twist on the Texture of Fabric.” Tekstil 47 (9): 447–452.
- Hari, P., B. Behera, J. Prakash, and K. Dhawan. 1989. “High Pressure Squeezing in Sizing: Performance of Cotton Yarn.” Textile Research Journal 59 (10): 597–600. https://doi.org/10.1177/004051758905901007.
- Hari, P., T. Subramanian, and S. Aggarwal. 1987. “Weavability–Dependence on Yarn Quality and Sizing.” Textile Asia 18 (2).239 d oi:http://www.autexrj.org/No4-2007/0248
- Heap, V., and B. Bradford. 1988. “The Correlation Between Abrasion Resistance and Weavability of Sizing Warps.” Melliand Textilberichte 69 (1): E, 12.
- Kovačević, S. 2000. Determining Size Coat in Yarn on the Basis of Substance Content. Ph. D. thesis., Faculty of Textile Technology, University of Zagreb.
- Kovačević, S., and D. Gordoš. 2009. “Impact of the Level of Yarn Twist on Sized Yarn Properties.” Work 7:6(77) 11.
- Kovačević, S., and Ž. Penava. 2004. “Impact of Sizing on Physico-Mechanical Properties of Yarn.” Fibres & Textiles in Eastern Europe 48 (4): 32–36.
- Kovačević, S., Ž. Penava, and M. Oljača. 2006. “Optimisation of Production Costs and Fabric Quality.” Fibres & Textiles in Eastern Europe 2 (56): 79–84.
- Maatoug, S., N. Ladhari, and F. Sakli. 2007a. “Evaluation of the Weavability of Sized Cotton Warps.” Autex Research Journal 7 (4): 239–244. https://doi.org/10.1515/aut-2007-070402.
- Maatoug, S., N. Ladhari, and F. Sakli. 2007b. “Fatigue Behavior of Sized Cotton Warps.” Journal of Applied Sciences 7 (18): 2706–2709. https://doi.org/10.3923/jas.2007.2706.2709.
- Maleki, H., A. A. Gharehaghaji, G. Criscenti, L. Moroni, and P. J. Dijkstra. 2015. “The Influence of Process Parameters on the Properties of Electrospun PLLA Yarns Studied by the Response Surface Methodology.” Journal of Applied Polymer Science 132 (5). https://doi.org/10.1002/app.41388.
- Mia, R., M. S. Sk, Z. B. S. Oli, T. Ahmed, S. Kabir, and M. A. Waqar. 2021. “Functionalizing Cotton Fabrics Through Herbally Synthesized Nanosilver.” Cleaner Engineering and Technology 4:100227. https://doi.org/10.1016/j.clet.2021.100227.
- Muhammad, A. 2011. To Study How to Improve the Productivity of Yarn and Fabric Production in a Production Mill. Dunedin, Sweden: University of Borås/Swedish School of Textiles.
- Nayak, B., K. Kasetty, and N. Murthy. 2002. “Alkaline Sizing-A Case Study.” IPPTA 14 (1; SPI): 67–70.
- Nurwaha, D., and X. H. Wang. 2012. “Using Intelligent Control Systems to Predict Textile Yarn Quality.” Fibres & Textiles in Eastern Europe 20 (1): 23–27.
- Oljača, M. 2006. “Optimisation of Production Costs and Fabric Quality.” Fibres & Textiles in Eastern Europe 14 (2): 56.
- Patil, P., R. Turukmane, and P. Raichurkar. 2017. “Comparative Analysis of Sizing Machine Parameters on Weaving Performance.” International Journal on Textile Engineering and Processes 3 (3): 31–35.
- Pleva, R., and W. Rieger. 1992. “Measurement and Optimization of Size Pick-Up.” Textile Praxis International 47 (3): 230–232.
- Rehman, A., Z. A. Raza, R. Masood, M. T. Hussain, and N. Ahmad. 2015. “Multi-Response Optimization in Enzymatic Desizing of Cotton Fabric Under Various Chemo-Physical Conditions Using a Taguchi Approach.” Cellulose 22 (3): 2107–2116. https://doi.org/10.1007/s10570-015-0598-y.
- Sanatgar, R. H., S. Borhani, S. A. H. Ravandi, and A. A. Gharehaghaji. 2012. “The Influence of Solvent Type and Polymer Concentration on the Physical Properties of Solid State Polymerized PA66 Nanofiber Yarn.” Journal of Applied Polymer Science 126 (3): 1112–1120. https://doi.org/10.1002/app.36871.
- Santhosh, V., and K. Poorna. 2014. “A Study on Electricity Problem in Powerloom Units (Special Reference with Coimbatore District).” Paripex-Indian Journal of Research 3 (11): 30–31.
- Sawhney, A., J. Price, and T. Calamari. 2004. “A Successful Weaving Trial with a Size-Free Cotton Warp Indian Textile Research Journal, 29 17–21.”
- Seboka, N. 2020. “Regression Model Development for Showing Relation Between Mechanical Yarn Stretch (%) in Sizing and Warp Yarn Breakage (Cmpx) in Looms Using ANOVA Model.” Ethiopian Journal of Textile and Apparel 1 (2).2
- Slauson, S. D., B. Miller, and L. Rebenfeld. 1984. “Physicochemical Properties of Sized Yams: Part I: Initial Studies.” Textile Research Journal 54 (10): 655–664. https://doi.org/10.1177/004051758405401004.
- Sonawane, M., P. Raichurkar, L. Patil, S. Kulkarni, and T. Patil. 2011. “Sizing-Impact of Process Parameters on Beam Quality and Similarly on Loom Performance.” Fibre to Fashion 92.
- Sun, S., H. Yu, T. Williams, R. F. Hicks, and Y. Qiu. 2013. “Eco-Friendly Sizing Technology of Cotton Yarns with He/O2 Atmospheric Pressure Plasma Treatment and Green Sizing Recipes.” Textile Research Journal 83 (20): 2177–2190. https://doi.org/10.1177/0040517513490061.
- Tanapongpipat, A., C. Khamman, K. Pruksathorm, and M. Hunsom. 2008. “Process Modification in the Scouring Process of Textile Industry.” Journal of Cleaner Production 16 (1): 152–158. https://doi.org/10.1016/j.jclepro.2006.06.016.
- Trauter, J. 1989. “Optimizing the Processing of Yarns with Modified Raw Material Properties.” Melliand Textilberichte 69 (3): 92.
- Turukmane, R., S. Gulhane, and R. B. Patil. 2019. “Impact of Process Parameters on Sizing Machine Performance: A Review.” Melliand International 25 (3): 182–183.
- Walker, R. P., and W. S. Perkins. 1985. “Effect of Sizing Wax on Tensile Properties, Abrasion Resistance, and Weaving Performance of Polyester/Cotton Yarn Sized with Polyvinyl Alcohol.” Textile Research Journal 55 (11): 667–671. https://doi.org/10.1177/004051758505501107.
- Wang, K., J. Wang, and W. Gao. 2024. “Enhancing Warp Sizing Effect and Quality: A Comprehensive Review of the Squeezing Process and Future Research.” Textile Research Journal 00405175241235400. https://doi.org/10.1177/00405175241235400.
- Xiao, H., and W. Zhang. 2009. “Current Situation of Environment Protection Sizing Agent and Paste.” Journal of Sustainable Development 2 (3): 172–175. https://doi.org/10.5539/jsd.v2n3p172.
- Yu, C. 2015. “Natural Textile Fibres: Vegetable Fibres.” In Textiles and Fashion, 29–56. Elsevier.
- Zakaria, M., M. S. Hossain, S. B. R. Hasan, M. Chowdhury, and R. Miah. 2015. “Modification of Weaving Process by Integrated Sizing-Weaving Loom.” IJCS 3 (2): 73–75.