
ABSTRACT
One of the current commercially available and accepted instruments for simultaneous cotton fiber length and maturity measurement is the advanced fiber information system (AFIS), which tests an individualized (single) fiber in lint samples. Extending fiber length and maturity measurement into a seed cotton, the AFIS method is an option, since it requires a minimum 0.5 g sample that could be accessible via a single locule sampling. In this study, AFIS measurement was examined for locule fibers within a naturally variable seed cotton cultivar and for ginned lint of different cultivars. In comparison with averages of AFIS length and maturity from locule samples in a seed cotton, those from lint samples of the same cultivar or diverse cultivars showed less differences in L(w), UQL(w), L5%(n) and maturity ratio (MR). The result suggested the feasibility of estimating L(w), UQL(w), L5%(n), and MR in a lint from AFIS measurements of multiple locule fibers in its seed cotton. Comparison of correlations between locule samples of a seed cotton and lint samples of diverse cultivars indicated statistically significant sampling method X ginning interactions for all AFIS length and maturity properties except for MR and Fineness. The analysis also implied the difficulties of evaluating AFIS length from AFIS maturity directly.
摘要
目前商用和可接受的同时测量棉花纤维长度和成熟度的仪器之一是先进的纤维信息系统(AFIS),该系统测试皮棉样品中的个性化(单一)纤维. 将纤维长度和成熟度测量扩展到籽棉中,AFIS方法是一种选择,因为它需要至少0.5克的样本,可以通过单蝗虫采样获得. 在这项研究中,对一个自然变异籽棉品种内的室纤维和不同品种的皮棉进行了AFIS测量. 与棉花种子室样品的AFIS长度和成熟度的平均值相比,来自同一品种或不同品种的皮棉样品的AFISL(w)、UQL(w),L5%(n)和MR的差异较小. 该结果表明,通过对其籽棉中多室纤维的AFIS测量来估计皮棉中的L(w)、UQL(w),L5%(n)和MR是可行的. 籽棉的室样本和不同品种的皮棉样本之间的相关性比较表明,除MR和细度外,所有AFIS长度和成熟度特性的取样方法X轧棉相互作用具有统计学意义. 该分析还暗示了直接从AFIS成熟度评估AFIS长度的困难.
Introduction
Cotton crop is one of the most important agricultural commodities which is mainly used for its naturally produced textile fiber (Robertson and Roberts Citation2010). Cotton fiber quality plays a vital role in cotton production and sustainability, as well as in the growers’ and processors’ profitability (Bradow and Davidonis Citation2000). To adapt to an increasing cotton fiber harvesting from mechanical harvesters, chemical boll openers and leaf defoliants are applied to increase cotton boll opening and reduce plant vegetative growth (Brecke, Banks, and Cothren Citation2001). The fiber-to-fiber quality variation within a sample is apparent, as fiber quality naturally varies within locules in a cotton boll, from the bottom to the top boll position in a plant and from different areas in a grown field (Ayele, Kelly, and Hequet Citation2018; Bauer et al. Citation2009; Feng et al. Citation2011; Liu and Delhom Citation2023; Turner et al. Citation2015). Fiber length and closely associated properties such as short fiber content (SFC), fiber length uniformity and distribution are critical fiber quality attributes, since they impact on fiber processing performance and on finished yarn and fabric quality substantially (Backe Citation1986; Cai et al. Citation2011, Citation2013; Cui, Calamari, and Suh Citation1998; Parsi et al. Citation2016; Zeidman and Sawhney Citation2002; Zurek et al. Citation1999) and also greatly influence the value and price of the lint (Bragg and Shofner Citation1993; Delhom et al. Citation2020). Meanwhile, fiber maturity is a key yield index and also an essential fiber quality attribute, which is directly linked to fiber breakage and entanglement (neps) during mechanical processing, dye uptake in yarn and fabric products, as well as yarn processing and textile performance (Anthony, Meredith, and Williford Citation1988; Gordon Citation2007; Kelly et al. Citation2015; Kim et al. Citation2019; Long, Delhom, and Bange Citation2021).
The current commercially available and accepted instruments for simultaneous fiber maturity and length measurements are high volume instrument (HVI) and advanced fiber information system (AFIS). HVI reports the fiber micronaire (MIC, commonly used as a substitute to fiber maturity), upper-half mean length (UHML), length uniformity index (UI), strength, elongation, color (color grade, Rd, +b), SFC, trash, and maturity properties from testing a bundle of fibers, while AFIS provides 20 fiber quality parameters, including fiber length and distribution, trash content, nep content, fineness and maturity from testing the individualized (or single) fibers (Delhom, Kelly, and Martin Citation2018; Delhom et al. Citation2020; Kelly, Hequet, and Dever Citation2012; Liu and Chang Citation2024). The difference in the principle of measurements between HVI and AFIS leads to a report of average quality parameters by HVI in a sample, in contrast to a report of both average quality properties and their distributions by AFIS. Extending fiber quality measurement into seed cotton (~2.0 g fiber/boll), the AFIS method is an important option considering such factors as a 0.5 g sample from a single locule sampling in a cotton boll for AFIS measurement but a 10.0 g sample combined from multiple cotton bolls for HVI MIC measurement. However, the differences between locule fiber sampling in a seed cotton and ginned lint fiber sampling are unknown and may cause inconsistencies between research and industry results for measured AFIS fiber quality.
As a principal instrument to measure fiber length and distribution, AFIS was developed in the late 1980s (Bragg and Shofner Citation1993). It provides the average length of individual fibers and also the length distribution by weight (L(w), L(w) CV, UQL(w)) and by number (L(n), L(n) CV, L5%(n)) as well as SFC by weight (SFC(w)) and by number (SFC(n)) as described in Appendix I. The AFIS length and the maturity module also provide maturity information on the aspects of fineness, immature fiber content (IFC), and maturity ratio (MR). Although the AFIS instrument necessitates the operator in preparing the fiber sliver in advance and has the slower testing speed compared with the HVI, AFIS has become more popular for acquiring fiber length distribution and further for process and quality control, since it requires a small amount of sample (0.5 g per measurement) and is considered to be the reference method for SFC (Hinds, Kelly and Hequet Citation2020, Citation2018; Krifa Citation2006; Smith, Braden, and Hequet Citation2010; van der Sluijs, Delhom, and Martin Citation2021). In addition, AFIS manufacturer has reported the statistics of AFIS properties that form a basis for trading cottons and allowing the mills to establish standards for yarn manufacturing process (Kretzschmar and Furter Citation2008).
Information of fiber length distribution is an important consideration for the cotton industry and cotton research. Measurements derived from using AFIS need to be examined further in order to expand its implications in seed cottons, in which cotton fibers are still attached to cotton seeds (or seed cotton). Routinely, the seed cottons are ginned at the gin facilities or laboratories before the fiber samples are shipped to fiber-testing laboratory for routine AFIS, HVI, and other analyses. The direct AFIS measurement in a cotton boll is not feasible, because it requires a 30 -cm-long sliver to be prepared. Therefore, the cotton seeds must be removed from one of the several locules in a seed cotton boll, manually or by hand ginning. It may not be known how much differences in AFIS response to fiber type states (i.e., regular ginned fiber samples vs. fiber sample in cotton bolls). Since hand ginning could be very laborious and time-consuming, laboratory saw gin or roller gin equipment was commonly used to gin seed cotton bolls. By analyzing seed cottons at single locule fiber level, it is possible to achieve accurate AFIS quality variation or distribution within a seed cotton sample. The main objective of this study was to compare AFIS length and maturity variation between locule fibers and ginned fibers. The comparison of locule fiber with the ginned fiber helped to reveal the degree to which variation in commercial cotton can be controlled by the sampling approaches, and further, to validate the usefulness and the effectiveness of AFIS technique in monitoring the fiber length and maturity variation within one seed cotton sample or between seed cotton samples at a locule level for optimizing fiber quality improvement for cotton fiber researchers and growers. The novelty of this study lies in the potential of estimating L(w), UQL(w), L5%(n), and MR quality in an unginned sample from the AFIS measurements of multiple locule fibers in its seed cotton.
Experimental details
Locule fiber samples and AFIS quality measurement
A total of 36 single locule fiber samples were picked randomly from a commercial seed cotton cultivar (DP1646), grown and harvested mechanically in one U.S. state (Mississippi) in 2020. Following the removal of visible trash portions from the surface of individual locule and also the removal of cotton seed from each locule manually, the lint samples (>0.5 g each) were tested to obtain AFIS qualities by an AFIS Pro 2 (USTER Technologies Inc., Knoxville, TN, USA) after they were conditioned at 21 ± 1°C temperature and 65 ± 2% relative humidity for 48 h.
Seed cotton samples, ginning, and fiber AFIS quality measurement
The seed cotton samples consist of 25 commercial upland samples that were harvested by cotton mechanical harvesters. These 25 samples were from five crop years (2016, 2018, 2020, 2021, and 2022), grown in two U.S. states (Mississippi and New Mexico) and from 21 cotton cultivars known as Americot, Dow AgroSciences, Monsanto and Bayer (Stoneville, FiberMax) brands. They were stored at laboratory condition for at least 2 days before ginning.
After removing apparent non-lint materials (such as large sticks and burrs), 250.0 g of seed cotton was ginned using a 10-saw Dennis laboratory saw gin (saw diameter = 12.7 cm, teeth per saw = 137, and saw speed = 497 revolutions per minute (RPM)) and feeding the sample within 3 min, approximately at a saw loading of 0.5 kg/saw/h. The lint collected from each seed cotton sample was bagged for AFIS test, following the same procedure as locule fibers. All the measurements were routinely performed at the Southern Regional Research Center of USDA’s Agricultural Research Service (USDA-ARS-SRRC).
Data analysis
The statistical analyses were performed on the data using analysis of variance (ANOVA) function under Data Analysis in Microsoft® Excel® for Office 365 with a 95% confidence level and also using analysis of covariance (ANCOVA) available from http://www.biostathandbook.com/ancova.html (accessed October 4, 2023).
Regression analyses on AFIS quality pair were calculated using Microsoft® Excel® for Office 365.
Results and discussion
AFIS length and maturity variability within locule samples of a cotton cultivar and the relation to its lint sample
shows a list of the descriptive statistics of AFIS length and maturity from a routine experimental report for 36 locule fiber samples within a DP1646 cultivar. Some properties are more sensitive to fluctuations within different locule samples than other properties, as shown by either a larger standard deviation (SD) or the coefficient of variation (CV%). For example, CV% varies greatly from the least of 4.21 for UQL(w) to the greatest of 52.65 for SFC(w). As a comparison, these properties of the ginned lint sample were inserted in . It indicates that unlike mean MR, L(n), L(w), UQL(w), L5%(n), and Fineness decreasing, SFC(w), IFC, SFC(n), L(w) CV, and L(n) CV increase from the locule samples to its lint sample. In other words, average MR, L(n), L(w), UQL(w), L5%(n), and Fineness are higher in locule samples than in lint sample, while SFC(w), IFC, SFC(n), L(w) CV, and L(n) CV are lower in locule samples than in lint sample. This is expected, since hand ginning of locule samples in a seed cotton was not as aggressive as saw ginning of a bulky seed cotton sample, leading to less fiber damage in locule samples. On the other hand, saw ginning could bring in some blending effect on the lint, align and orient the fiber in a common longitudinal direction, and also smooth the fiber surface. This results in the alteration of the fiber’s twisted status and surface appearance and further in changing the fiber packing/openness. Comparatively, less aggressive hand ginning would have more twisted fibers than saw ginning, and the presence of more twisted fibers might increase the possibility of fibers not being individualized efficiently by the AFIS fiber individualizer. Under this scenario, the AFIS measurement could underestimate the IFC and hence provide a high MR for locule fibers, as a evidence of lower IFC for locule fibers (6.36) than for ginned lint sample (7.93) in . However, the difference of the mean MR between locule fibers and lint sample is small and might be acceptable as discussed below.
Table 1. AFIS length and maturity statistics of locule or lint sample in a DP1646 cultivar.
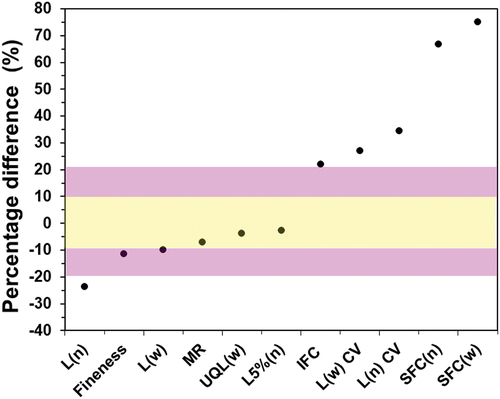
The percentage difference in , calculated as the ratio of mean quality difference between lint sample and locule sample of the same kind to their average expressed in the form of percentage, reveals a distinctive variation from −23.7% to 75.0%. L(n), Fineness, L(w), MR, UQL(w), and L5%(n) are observed to have negative differences of −23.7%, −11.4%, −9.8%, −7.0%, −3.6%, and −2.6%, respectively, while IFC, L(w) CV, L(n) CV, SFC(n), and SFC(w) are observed to possess positive differences of 22.0%, 27.0%, 34.4%, 66.8%, and 75.0%. Hence, the ginning process impacted L(n), IFC, L(w) CV, L(n) CV, SFC(n), and SFC(w) greatly as evidenced by the absolute percentage difference (׀percentage difference׀) of >20.0%, followed by Fineness moderately with ׀percentage difference׀ of from 10.0% to 20% and by L(w), MR, UQL(w), and L5%(n) minimally with ׀percentage difference׀ of <10.0%. Therefore, the ginning process did not impact L(w), MR, UQL(w), and L5%(n) measurements much, as opposed to relatively L(n) and Fineness reduction and also IFC, L(w) CV, L(n) CV, SFC(n), and SFC(w) increase. This reveals a feasibility of estimating L(w), UQL(w), L5%(n), and MR quality in an unginned sample from AFIS measurements of multiple locule fibers in its seed cotton sample.
Figure 1. Percentage difference (%) of mean AFIS length and maturity between lint sample and locule sample in a DP1646 cultivar sorted by the increasing percentage difference.
AFIS length and maturity variability between locule samples of a cotton cultivar and lint samples of diverse cultivars
summarizes the statistics of AFIS length and maturity from 25 lint samples, representing 21 cotton cultivars grown in five crop years and two U.S. states. In general, minimum and maximum for lint samples in are less than respective value for locule samples in , and the tendency of CV% in resembles that in . This suggests that within a cultivar, variability of selected AFIS properties in could represent the variations of targeted fiber quality in commercial cottons and cotton breeding programs.
Table 2. AFIS length and maturity statistics of lint samples in commercial upland cotton cultivars.
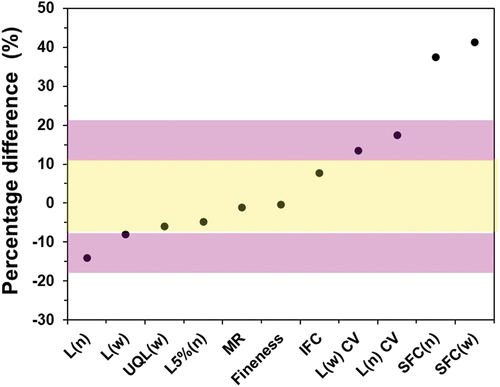
The percentage differences in reveal a great difference in SFC(n) and SFC(w) with ׀percentage difference׀ of >20.0%, followed by L(n), L(w) CV and L(n) CV moderately with ׀percentage difference׀) of from 10.0% to 20.0% and by L(w), UQL(w), L5%(n), MR, Fineness, and IFC minimally with ׀percentage difference׀ of < 10.0%. This observation indicates that a combination of ginning and cultivars did not influence L(w), UQL(w), L5%(n), MR, Fineness, and IFC as much as a reduced L(n) or increased L(w) CV, L(n) CV, SFC(n), and SFC(w). The pattern in might suggest less differences in averages of L(w), UQL(w), L5%(n), MR, Fineness, and IFC between the locule samples (or within-locule fibers) and the lint samples (or within-cultivar fibers). This means that a combination of cultivar, environment, and agricultural practices might have a less effect on fiber L(w), UQL(w), L5%(n), MR, Fineness, and IFC when examining the averaged quality indices from many samples, and vice versa, have a great impact on fiber L(n), L(w) CV, L(n) CV, SFC(n), and SFC(w) properties.
Figure 2. Percentage difference (%, lint sample – locule sample) of mean AFIS length and maturity between locule sample in a DP1646 cultivar and lint sample from different cultivars sorted by the increasing percentage difference.
Overall, both indicate that L(w), UQL(w), L5%(n) and MR are less influenced than AFIS length and maturity qualities by taking the average of multiple locule samples in a seed cotton or several sub-samples in a lint sample.
AFIS length and maturity measurement between locule sampling and lint sampling
The impact of locule fiber sampling vs. lint fiber sampling methods on AFIS measurements is tabulated in . There were statistically significant differences (ANOVA p-value <.05) between locule samples and lint samples in L(w), L(n), L(w) CV, L(n) CV, UQL(w), L5%(n), SFC(w), and SFC(n), except for MR, Fineness, and IFC (ANOVA p-value >.05). This indicates that AFIS length properties (L(w), L(n), L(w) CV, L(n) CV, SFC(w), and SFC(n)) are susceptible to sampling methods and also are with a significant sample (or cultivar) X ginning interaction. Meanwhile, AFIS maturity properties (MR, Fineness, and IFC) were not significantly impacted by sampling methods, suggesting that a combination of cultivar, environment, and agricultural practices as well as ginning might have a least effect on fiber maturity properties.
Table 3. AFIS length and maturity measurement between locule samples of a cotton cultivar and lint samples of diverse cultivars.
When relating one AFIS quality against equivalent of the same kind (i.e., L(w) vs. L(n), L(w) CV vs. L(n) CV, UQL(w) vs. L5%(n), or SFC(w) vs. SFC(n)) for either locule samples or lint samples, the regression lines indicated the variations in slope, adjusted intercept (as intercept/average), and R2 (). Notably, the pairs of L(w) vs. L(n), L(w) CV vs. L(n) CV, UQL(w) vs. L5%(n), and SFC(w) vs. SFC(n) showed a positive slope and a high R2 (0.89 to 0.98) for locule samples and for lint samples, except the pair of L(n) vs. L(w) for lint samples (0.67). Similarly, MR is positively correlated with Fineness greatly (R2 = 0.79 to 0.84), and both MR and Fineness are negatively correlated with IFC strongly (R2 >0.80).
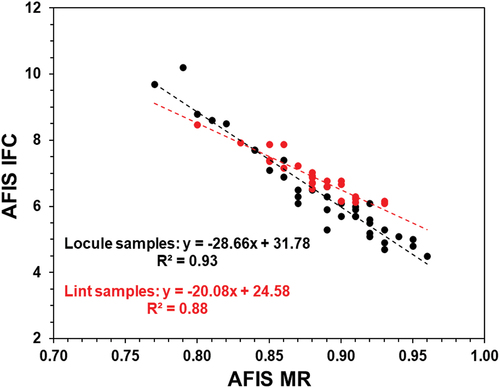
On the basis of two correlation lines between locule samples of a cultivar and lint samples of diverse cultivars, the analysis of covariance (ANCOVA) highlighted the statistically insignificant differences (p-value >.05) in both slope and intercept for the pairs of L(w) vs. L(n) and MR vs. Fineness, insignificant differences in slope but significant differences (p-value <.05) in intercept for the pairs of L(w) CV vs. L(n) CV, UQL(w) vs. L5%(n), and SFC(n) vs. SFC(w), and significant differences in both slope and intercept for the pairs of MR vs. IFC or Fineness vs. IFC. This observation implied statistically significant sampling method X ginning interactions for all AFIS length and maturity properties but MR and Fineness. example the relationships for the pairs of L(w) vs. L(n), SFC(n) vs. SFC(w), and MR vs. IFC between locule samples and lint samples, respectively. Contrary to two correlation lines in resembling each other without statistical ANCOVA significance (p-value >.05), two correlation lines in or differ in either the slope or the intercept statistical significantly (p-value < .05).
Figure 3. Comparison of L(w) and L(n) measurement between locule samples within a DP1646 cultivar and lint samples from different cultivars.
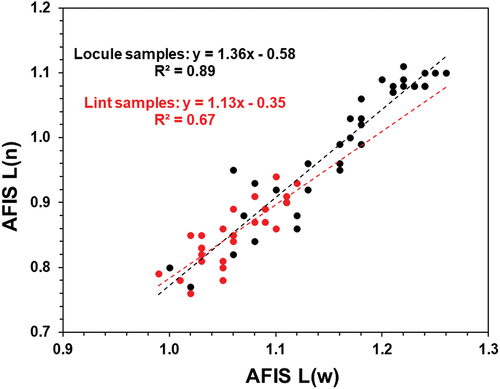
Figure 4. Comparison of SFC(w) and SFC(n) measurement between locule samples in a DP1646 cultivar and lint samples from different cultivars.
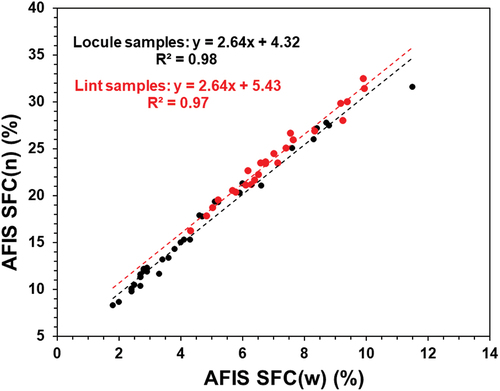
Figure 5. Comparison of MR and IFC measurement between locule samples in a DP1646 cultivar and lint samples from different cultivars.
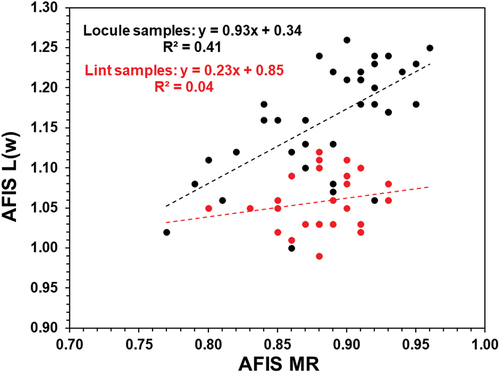
Linking MR to L(w) in indicates a statistically insignificant difference in MR (ANOVA p-value = .59) but a significant difference in L(w) (ANOVA p-value <.0001) between locule samples and lint samples and also reveals an insignificant difference in the slope (p-value = .06) but a significant difference in the intercept (p-value <.0001) between two correlation lines from locule samples and lint samples. Apparently, L(w) significantly increases with MR (p-value <.0001) within locule samples in a DP1646 cultivar, but it is independent of MR (p-value = .36) among lint samples from different cotton cultivars. The different patterns in might hint the barrier of estimating L(w) from fiber MR property directly.
Figure 6. Comparison of MR and L(w) measurement between locule samples in a DP1646 cultivar and lint samples from different cultivars.
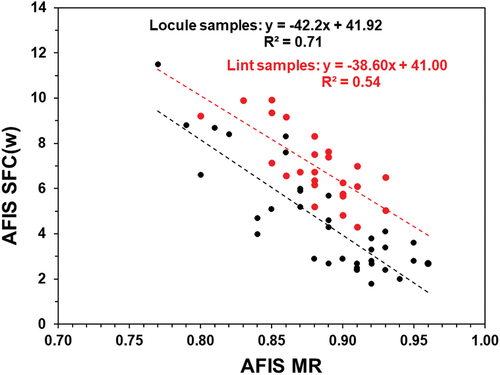
The response of SFC(w) to MR in is similar in the slope (p-value = .70) but differs significantly in the intercept (p-value <.0001) between two correlation lines from locule samples and lint samples. SFC(w) decreases with MR increasing significantly (p-value <.00001) within either locule samples or lint samples. Together with the result in , it might imply the difficulty of assessing L(w) and SFC(w) or similar length properties from fiber maturity properties on samples with limited information (i.e., agricultural and ginning practice).
Figure 7. Comparison of MR and SFC(w) measurement between locule samples in a DP1646 cultivar and lint samples from different cultivars.
Conclusion
As the current commercially available and accepted instrumentation for measuring fiber length and maturity distribution properties, the AFIS results were obtained from 36 locule samples of a cotton cultivar and 25 lint samples of diverse cultivars. While the result represented 36 cotton bolls in a total seed cotton sample, it reflected an analysis of 36 sub-samples in naturally variable seed cottons. The locule samples of a cotton cultivar showed wider ranges of several AFIS properties than lint samples of diverse cultivars. In contrast to the averages of AFIS length and maturity from locule samples, those from lint samples of the same cotton cultivar or of diverse cultivars showed a less difference of L(w), UQL(w), L5%(n) and MR, implying a potential of predicting L(w), UQL(w), L5%(n), and MR quality from AFIS measurements of multiple locule fibers in a seed cotton cultivar. The comparison of two correlation lines between locule samples of a cultivar and lint samples of diverse cultivars indicated statistically significant sampling method X ginning interactions for all AFIS length and maturity properties except for MR and Fineness. Further analyses implied the challenges of evaluating AFIS length properties from fiber maturity information on samples with limited information. This, in turn, highlighted the sensitivities of the AFIS measurement at single fiber level, and further studies will be needed to search for a reliable, low-cost, and rapid AFIS method that is beneficial to the industry, research, and breeding communities.
Highlights
Differences between locule fiber sampling in seed cotton and lint fiber sampling in ginned lint may lead to inconsistencies between research and industry results for fiber AFIS qualities.
It might reveal a feasibility of predicting L(w), UQL(w), L5%(n), and MR quality in an unginned sample from AFIS measurements of multiple locule fibers in its seed cotton sample.
There were statistically significant sampling method X ginning interactions for all AFIS length and maturity properties except for MR and Fineness.
It might be difficult to evaluate fiber AFIS length properties from fiber AFIS maturity information among diverse samples.
Acknowledgments
The author wishes to acknowledge two ARS Cotton Ginning laboratories in providing partial seed cotton samples, Ms M Dunn in cotton ginning as well as Dr Delhom and Ms H King in coordinating fiber AFIS measurement. Mention of a product or specific equipment does not constitute a guarantee or warranty by the U.S. Department of Agriculture and does not imply its approval to the exclusion of other products that may also be suitable.
Disclosure statement
No potential conflict of interest was reported by the author(s).
Data availability statement
All data presented in this study are available upon request.
References
- Anthony, W. S., W. R. Meredith, and J. R. Williford. 1988. “Neps in Ginned Lint: The Effects of Cultivars, Harvesting, and Ginning Practices.” Textile Research Journal 58 (11): 633–12. https://doi.org/10.1177/004051758805801103.
- Ayele, A. G., B. R. Kelly, and E. F. Hequet. 2018. “Evaluating Within-Plant Variability of Cotton Fiber Length and Maturity.” Agronomy Journal 110 (1): 47–55. https://doi.org/10.2134/agronj2017.06.0359.
- Backe, E. E. 1986. “Effect of Short Fiber Content in Cotton on Plant Performance and Quality.” Textile Research Journal 56 (2): 112–115. https://doi.org/10.1177/004051758605600207.
- Bauer, P. J., J. A. Foulk, G. R. Gamble, and E. J. Sadler. 2009. “A Comparison of Two Cotton Cultivars Differing in Maturity for Within-Canopy Fiber Property Variation.” Crop Science 49 (2): 651–657. https://doi.org/10.2135/cropsci2008.06.0350.
- Bradow, J. M., and G. H. Davidonis. 2000. “Quantitation of Fiber Quality and the Cotton Production-Processing Interface: A physiologist’s Perspective.” Journal of Cotton Science 4 (1): 34–64.
- Bragg, C. K., and F. M. Shofner. 1993. “A Rapid, Direct Measurement of Short Fiber Content.” Textile Research Journal 63 (3): 171–176. https://doi.org/10.1177/004051759306300307.
- Brecke, B. J., J. C. Banks, and J. T. Cothren. 2001. “Harvest-Aid Treatments: Products and Application Timing.” In Cotton Harvest Management: Use and Influence of Harvest Aids, edited by J. R. Supak and C. E. Snipes, 119–142. Memphis, TN, USA: The Cotton Foundation.
- Cai, Y., X. Cui, J. Rodgers, D. P. Thibodeaux, V. B. Martin, M. Watson, and S. S. Pang. 2011. “An Investigation on Different Parameters Used for Characterizing Short Cotton Fibers.” Textile Research Journal 81 (3): 239–246. https://doi.org/10.1177/0040517510380105.
- Cai, Y., X. Cui, J. Rodgers, D. P. Thibodeaux, V. B. Martin, M. D. Watson, and S. Pang. 2013. “A Comparative Study of the Effects of Cotton Fiber Length Parameters on Modeling Yarn Properties.” Textile Research Journal 83 (9): 961–970. https://doi.org/10.1177/0040517512468821.
- Cui, X., T. A. Calamari, and M. W. Suh. 1998. “Theoretical and Practical Aspects of Fiber Length Comparisons of Various Cottons.” Textile Research Journal 68 (7): 467–472. https://doi.org/10.1177/004051759806800701.
- Delhom, C. D., B. Kelly, and V. Martin. 2018. “Physical Properties of Cotton Fiber and Their Measurement.” In Cotton Fiber: Physics, Chemistry and Biology, edited by D. D. Fang, 41–73. Cham, Switzerland: Springer.
- Delhom, C. D., J. Knowlton, V. B. Martin, and C. Blake. 2020. “Cotton Ginners Handbook: The Classification of Cotton.” Journal of Cotton Science 24 (4): 189–196. https://doi.org/10.56454/EEEG9440.
- Feng, L., V. B. Bufon, C. I. Mills, E. Hequet, J. P. Bordovsky, W. Keeling, R. Boman, and C. W. Bednarz. 2011. “Effects of Irrigation, Cultivar, and Plant Density on Cotton Within-Boll Fiber Quality.” Agronomy Journal 103 (2): 297–303. https://doi.org/10.2134/agronj2010.0185.
- Gordon, S. 2007. “Cotton Fiber Quality.” In Cotton: Science and Technology, edited by S. Gordon and Y.-L. Hsieh, 68–100. Cambridge, UK: Woodhead Publishing Limited.
- Hinds, Z., B. R. Kelly, and E. F. Hequet. 2020. “Stability, Variation, and Application of AFIS Fiber Length Distributions.” Journal of Cotton Research 3 (1): 1–11. https://doi.org/10.1186/s42397-020-00053-5.
- Kelly, B., N. Abidi, D. Ethridge, and E. F. Hequet. 2015. “Fiber to Fabric.” In Cotton, D. D. Fang and R. G. Percy, edited by 665–744. 2nd ed. Madison, WI, USA: American Society of Agronomy, Crop Science Society of America, and Soil Science Society of America.
- Kelly, B. R., and E. F. Hequet. 2018. “Variation in the Advanced Fiber Information System Cotton Fiber Length-By- Number Distribution Captured by High Volume Instrument Fiber Length Parameters.” Textile Research Journal 88 (7): 754–765. https://doi.org/10.1177/0040517516688628.
- Kelly, C. M., E. F. Hequet, and J. K. Dever. 2012. “Interpretation of AFIS and HVI Fiber Property Measurements in Breeding for Cotton Fiber Quality Improvement.” Journal of Cotton Science 16 (1): 1–16.
- Kim, H. J., C. D. Delhom, J. E. Rodgers, and D. C. Jones. 2019. “Effect of Fiber Maturity on Bundle and Single-Fiber Strength of Upland Cotton.” Crop Science 59 (1): 115–124. https://doi.org/10.2135/cropsci2018.05.0324.
- Kretzschmar, S. D., and R. Furter. 2008. “USTER® AFIS PRO 2, Application Report: A New Single Fiber Testing System for the Process Control in Spinning Mills.” Switzerland: Uster Technologies AG.
- Krifa, M. 2006. “Fiber Length Distribution in Cotton Processing: Dominant Features and Interaction Effects.” Textile Research Journal 76 (5): 426–435. https://doi.org/10.1177/0040517506062616.
- Liu, Y., and S. Chang. 2024. “Comprehensive Analysis of Cotton Fiber Infrared Maturity Distribution and its Relation to Fiber HVI and AFIS Properties.” Fibers and Polymers 25 (3): 1127–1136. In press. https://doi.org/10.1007/s12221-023-00448-6.
- Liu, Y., and C. D. Delhom. 2023. “Investigation of Fiber Maturity and Crystallinity Information in Upland Seed Cottons by Fourier Transform Infrared Spectroscopy.” Textile Research Journal 93 (11–12): 2507–2519. https://doi.org/10.1177/00405175221137096.
- Long, R. L., C. D. Delhom, and M. P. Bange. 2021. “Effects of Cotton Genotype, Defoliation Timing and Season on Fiber Cross-Sectional Properties and Yarn Performance.” Textile Research Journal 91 (17–18): 1943–1956. https://doi.org/10.1177/0040517521992769.
- Parsi, R. D., W. V. Kakde, K. Pawar, and R. S. P. Patil. 2016. “Influence of Fibre Length on Ring Yarn Quality.” International Journal of Research & Scientific Innovation 3 (7): 2321–2705.
- Robertson, W. C., and B. A. Roberts. 2010. “Integrated Crop Management for Cotton Production in the 21st Century.” In Cotton: Technology for the 21st Century, edited by P. J. Wakelyn and M. R. Chaudhry, 63–97. Washington DC, USA: International Cotton Advisory Committee.
- Smith, C. W., C. A. Braden, and E. F. Hequet. 2010. “Genetic Analysis of Fiber Length Uniformity in Upland Cotton.” Crop Science 50 (2): 567–573. https://doi.org/10.2135/cropsci2009.04.0202.
- Turner, C., H. Sari-Sarraf, E. Hequet, and S. Vitha. 2015. “Variation in Maturity Observed Along Individual Cotton Fibers Using Confocal Microscopy and Image Analysis.” Textile Research Journal 85 (8): 867–883. https://doi.org/10.1177/0040517514551466.
- van der Sluijs, M. H. J., C. D. Delhom, and V. B. Martin. 2021. “Assessment of Cotton Fibre Length Measurement Methods.” The Journal of the Textile Institute 112 (9): 1377–1389. https://doi.org/10.1080/00405000.2020.1816684.
- Zeidman, M. I., and P. S. Sawhney. 2002. “Influence of Fiber Length Distribution on Strength Efficiency of Fibers in Yarn.” Textile Research Journal 72 (3): 216–220. https://doi.org/10.1177/004051750207200306.
- Zurek, W., M. Greszta, I. Frydrych, and G. Balcar. 1999. “Cotton Fiber Length Changes in the Spinning Process on the Basis of AFIS Measurements.” Textile Research Journal 69 (11): 804–810. https://doi.org/10.1177/004051759906901102.