
 ?Mathematical formulae have been encoded as MathML and are displayed in this HTML version using MathJax in order to improve their display. Uncheck the box to turn MathJax off. This feature requires Javascript. Click on a formula to zoom.
ABSTRACT
Mulberry silkworms have provided many valuable byproducts to humans for 5,000 years. However, numerous possibilities for their utilization still exist owing to the countless varieties of silkworms. Here, we report the application of Yeonnokjam silk (pistachio silk, PS), one of the characteristic silk varieties in Korea, as a smart fabric environmental sensor. Unlike the previously reported extrinsically modified silk varieties, this new silk textile emits fluorescence under external stimuli. PS cocoons were exposed to different concentrations of HCl vapors. Due to the large surface-to-volume ratio of the cocoon textile, a very low concentration (5 ppm) of HCl vapor can be detected by reading the decrease in the fluorescence intensity. At a lethal concentration (3000 ppm), an instantaneous fluorescence response is obtained. Additionally, the fluorescent pigment in PS can respond to temperature and can be extracted using ethanol, indicating that PS exhibits temperature and ethanol-sensing capabilities. The findings of this study prove that natural PS can be used in bio-optical applications.
摘要
5000年来,桑蚕为人类提供了许多有价值的副产品. 然而,由于蚕的种类繁多,利用它们的可能性仍然很多. 在这里,我们报道了韩国特色丝绸品种之一的Yeonnojam丝绸(开心果丝绸,PS)作为智能织物环境传感器的应用. 与之前报道的外改性丝绸品种不同,这种新型丝绸纺织品在外部刺激下会发出荧光. PS茧暴露于不同浓度的HCl蒸汽中. 由于茧织物的大的表面与体积比,可以通过读取荧光强度的降低来检测非常低浓度(5ppm)的HCl蒸汽. 在致死浓度(3000ppm)下,获得瞬时荧光响应. 此外,PS中的荧光颜料可以对温度做出反应,并且可以使用乙醇提取,这表明PS具有温度和乙醇传感能力. 本研究结果证明天然PS可用于生物光学应用.
Introduction
Smart textiles are attractive for environmental and biological applications owing to their fascinating functions. Such textile platforms are sensitive to external stimuli, such as pH, pressure, mechanical stress, temperature, light, and electrical signals (Chen et al. Citation2020; Libanori et al. Citation2022; Stuart et al. Citation2010). Porous structures with large surface-to-volume ratios, present in smart textiles, enhance the interaction between the textile and external stimuli as well as increase the flexibility and permeability of the textile material (Guan, Gong, and Xu Citation2020; Hong et al. Citation2021). In addition, incorporating light manipulation functions into a textile platform facilitates wireless, fast, and sensitive sensing operations (Shin et al. Citation2023; Zhang et al. Citation2023). Especially, fluorescent textiles can transform their color and exhibit light-illuminating patterns and pictures upon exposure to light. Therefore, fluorescence-emitting smart textiles provide protection and are suitable for developing flexible displays, sensory systems, and security barcodes (Han et al. Citation2022; Lin et al. Citation2023). However, most pigments and dyes used to manufacture fluorescent textiles are highly toxic and environmentally persistent and are thus hazardous to humans and ecosystems (Jia and Zhang Citation2023; Subaihi et al. Citation2022; Tang et al. Citation2019). Although nanomaterials, such as quantum dots and nanowires, have been used in previous studies, the potential risk is still an ongoing issue (Alas et al. Citation2020; Du et al. Citation2021; Y. Han et al. Citation2022). Additionally, natural textile materials are viable for biocompatible and eco-friendly smart textile applications (Tat et al. Citation2022; Vivekananthan et al. Citation2018).
The mulberry silkworm, called Bombyx mori, has been providing numerous byproducts to humans for almost five millennia (Omenetto and Kaplan Citation2008, Citation2010). High-quality natural fabrics obtained from silkworm cocoons are well-known products (Wang et al. Citation2023). Its pupae have been used as a source of proteins and oils, and silkworms have been used in medicines in East Asian countries because of their health-promoting constituents (Pan et al. Citation2022). Recent research has demonstrated that the silk protein derived from Bombyx mori cocoons possesses numerous properties including biocompatibility, biodegradability, and optical transparency (Chung et al. Citation2022; Kim et al. Citation2012; Umar, Min, and Kim Citation2018). Furthermore, silk protein is enriched with all the capabilities to act as a functional material in the fabrication schemes involving micro and nano processes (Kim et al. Citation2014). Owing to such advantageous properties, mulberry silkworms have been used to develop various optical and electrical devices for biomedical and environmental applications and have thus opened new possibilities in biomedicine and biology (Gogurla et al. Citation2019; Gogurla, Wahab, and Kim Citation2023; Min, Kim, and Kim Citation2017). However, the diversity of silkworm species remains hitherto unexplored (Hu et al. Citation2023; Prakash et al. Citation2021). Notably, there are over 340 pure breeds of silkworms in the National Academy of Agriculture Sciences (NAAS), Korea alone (Kwak et al. Citation2019). For the last two decades, the NAAS has developed several new colored cocoon silkworm strains due to farmhouse demands. To tackle the small size and weak larvae of the strains producing yellow cocoons, a new strain of green silk was bred through crossbreeding, with improved traits, which is called Yeonnokjam (Kang et al. Citation2011). Nevertheless, only selected varieties have been studied thus far, indicating that the potential of silk materials remains largely untapped to date.
Fabrication of fluorescent silk textiles can be accomplished through several means. For example, a dye can be added to a silk solution, which can then be electrospun to form nanofibers (Gogurla and Kim Citation2021; Joshi et al. Citation2022; Min et al. Citation2017). Else ways, inorganic nanoparticles (quantum dots) when embedded in silk fibers can facilitate colored silk materials (Lin et al. Citation2016). Feeding methods involving dye-containing diets and generic modifications can be applied to silkworms to achieve inherent modifications (Tansil, Koh, and Han Citation2012). Although all these methods can be successfully applied to obtain fluorescent silk materials, each method exhibits certain disadvantages. The feeding method does not ensure dye addition into silk (Das and David Citation2022; Zheng et al. Citation2018). Transgenic methods exhibit low efficiencies and are expensive as well as complex (Chambre et al. Citation2020; Y. Wang et al. Citation2022). Post-processing methods involving additional chemical and physical processes are also expensive, and avoiding the use of toxic materials like quantum dots remains a challenge (He et al. Citation2022). Further, although mulberry leaves can be used to develop fluorescent textiles because of the autofluorescence (natural fluorescence) displayed by its constituent nutrients, the fluorescence intensity is extremely weak for practical applications (Lee et al. Citation2020).
Bombyx mori silkworm cocoons display a wide range of colors and can be sorted into three categories based on the presence and type of pigments they contain: 1) Yellow-red cocoons, such as Golden silk (GS), deriving their coloration from carotenoids, exhibit various shades like golden, flesh, pink, or rust-colored. 2) Green cocoons, such as Pistachio silk (PS), colored by flavonoids, span a spectrum from light to deep green hues. 3) White cocoons, such as White Jade (WJ), lack significant pigment content (Daimon et al. Citation2010; Lu et al. Citation2023; Sakudoh et al. Citation2007). Exploring the genetic mechanisms governing the color variations in cocoons from wild to domestic silkworms offers valuable insights into the molecular foundation of animal pigmentation and enhances comprehension of the processes shaping phenotypic diversity. In silkworms producing pigmented cocoons, carotenoids and flavonoids sourced from mulberry leaves are initially absorbed in the midgut and then conveyed into the hemolymph. Subsequently, these pigments are assimilated by the silk glands and bind to the silk protein. Finally, mature caterpillars utilize these pigmented silk proteins to construct colored cocoons, a process that may entail chemical modifications of the pigments.
In this study, we observed a strong fluorescence from the PS variety and assessed its applicability in textile-based environmental sensing. PS silkworms naturally generate fluorescent pigments, such as flavonoids, which are rich in the sericin cladding layer of the silk fiber. PS cocoon mats exhibit clear green fluorescence under ultraviolet (UV) excitation, and the fluorescence intensity is comparable to those of conventional biological dye-doped silk layers. Since the functionality of flavonoids changes under stimuli, we investigated the feasibility of using a fluorescent PS cocoon fiber as an environmental sensor. The PS cocoon mats were exposed to different environments, including HCl vapors, rising temperatures, and ethanol (EtOH) in water. Under all these conditions, the fluorescence intensity decayed, and the decay rate was proportional to the exposure time and concentration of the analytes. In addition, the analytes were detected with high sensitivity because of the large surface-of-volume ratios of the fiber mats, indicating the feasibility of using natural cocoon fibers, which produce natural pigments, as a sensing platform.
Materials and methods
Collection of silkworm cocoons
All the silkworm cocoons used in this study were collected from the National Academy of Agriculture Sciences, Korea. The WJ is the F1 hybrid of Jam 123 and Jam 124 PBs (relatively large white cocoons). The GS is the F1 hybrid of Jam 311 and Jam 312 PBs (yellow cocoons). The PS, our target variety, is also the F1 hybrid of Jam 315 and Jam 316 PBs (light-green cocoons).
Preparation of silkworm cocoon samples
Pristine cocoon fibers were prepared by drying and cleaning the cocoons with an N2-gun. These fibers were then cut into 1 cm x 1 cm pieces and flattened. Degummed fibers were prepared by boiling the dried cocoons for 30 min in an aqueous solution of 0.02 M Na2CO3, which removed globular sericin proteins. Then, the extracted silk fibroin fibers were rinsed three times with deionized water for 20 min, stored in 1 cm x 1 cm molds, and dried for 24 h. These dried degummed fibers were then flattened.
An aqueous silk fibroin solution was prepared by dissolving the degummed fibers in a 9.3 M LiBr solution and incubating them in a vacuum oven at 60°C for 4 h. These solutions were dialyzed against deionized water using dialysis cassettes (Cellu-Sep T1, Membrane Filtration Products, MWCO 3.5K) at room temperature for 48 h. The obtained solutions were then twice centrifuged for 20 min at − 1°C and 9000 rpm to remove impurities, and finally, aqueous silk fibroin solutions with an approximate concentration of 6 wt% were obtained.
Silk fibroin films were prepared by drop-casting the aqueous silk solution on arbitrary 3 cm x 3 cm substrates. These coated substrates were then dried at normal room temperature inside a fume hood for 24 hours. The dried silk fibroin films were peeled off, and the resulting free-standing films were used in the experiments.
Preparation of HCl vapor environment
To establish the HCl vapor environment on ppm scales (Jeon et al. Citation2012), we used a micropipette to introduce liquid HCl into a beaker, as illustrated in . Subsequently, the beaker was sealed, and we allowed 2 h at room temperature for the complete vaporization of the liquid HCl droplet. For a concentration of 1 ppm (v/v), we adjusted the ratio of HCl vapor volume to the beaker volume to 1 μL/L. This concentration was achieved by evaporating 1.63 μg of liquid HCl, calculated based on the molar mass to molar volume ratio at room temperature. In chemosensing experiments conducted at concentrations of 5, 10, 50, 100, 300, 1300, and 3000 ppm of HCl vapor, we evaporated 8.15, 16.3, 81.5, 163, 489, 2119, and 4890 μg of liquid HCl, respectively, in each 1 L beaker.
Optical measurements and characterizations
The fluorescence spectra of the PS pristine fibers were measured using a visible/near-infrared spectrometer (USB-2000+VIS-NIR-ES, Ocean Optics, USA, spectral resolution: 1.2 nm). The samples were optically illuminated by a 365-nm continuous-wave LED (M365LP1 UV Mounted LED, Thorlabs Inc., USA). To excite a large area on the samples, the illuminating spot of the LED was expanded using a plano-convex optical lens (f = 10 cm). High-quality PS pristine fibers were prepared with spatial homogeneities in diameter and fluorescence emissions. The exact distance between the spectrometer detector tip and the sample was adjusted, the focused beam size was maintained, and the detection angle was fixed by placing the detector tip normally to the sample. To observe the microscale luminescence properties of the PS cocoon mats, an optical microscope (Olympus, BX53M) with dedicated software was utilized, which was used in collaboration with a 365-nm continuous-wave LED and a long pass filter (FGL515-Ø25 mm OG515 colored glass filter, Thorlabs Inc., USA). This microscope was equipped with objective lenses with magnifications of 5, 10, 20, 50, and 100×, and the measurements were performed in the bright-field mode. Field-emission SEM (Apreo S Hivac, Thermo Fischer Scientific Inc.) was used to examine the morphological and structural characteristics of the cocoon samples.
Time-Resolved Photoluminescence (TRPL) measurement
A Fluorometer (Fluorolog-QM, Horiba) was utilized to analyze the emission fluorescence spectra for determining the lifetime of the PS cocoon mat. The device captured excitation and emission spectra, measuring the intensities of the incident and emitted light energies across different wavelengths via integration. Lifetime measurements were performed using time-correlated single photon counting, employing a 375 nm laser for excitation. The lifetimes were determined by fitting decay profiles with a mono-exponential model.
Pigment extraction and separation from PS, AY, and GS cocoons
The pigments in the PS, AY, and GS cocoons were separated by paper chromatography. The PS, AY, and GS cocoons were cut into small pieces and separately extracted using EtOH via heating at 75°C for 2 h (at 1400 rpm) with a cocoon-to-solvent ratio of 1:10 w/v. The EtOH extracts of the PS, AY, and GS co-coons were further heated at 80°C for 2 h (at 1400 rpm) to obtain their concentrated solutions, which were poured into different vials. Next, filter papers were immersed in these vials to absorb the pigment solutions, and therefore the pigment molecules, via the capillary force. These immersed filter papers were then exposed to UV light to observe the sky-blue, strong green, and weak fluorescence intensities emitted by the GS (due to the presence of carotenoids), PS (due to the flavonoid quercetin 5-O-glucoside), and AY pigments, respectively.
Results and discussion
Three varieties of silkworm cocoons, WJ (known as Baegokjam in Korea), GS, and PS (known as Yeonnokjam in Korea), were provided by the National Academy of Agricultural Sciences in Korea. represent the daylight images of the WJ, GS, and PS cocoons, respectively, where the respective colors of WJ, GS, and PS cocoons are white, yellow, and light green. Because of the nutrients absorbed by the mulberry leaves, the silk fibers of all the varieties display fluorescence under UV excitation where as well as , and represent the daylight and UV-excited images of WJ, GS, and PS cocoon threads, respectively (Liu et al. Citation2011). The WJ silk thread shows a weak blue fluorescence, whereas the fluorescence intensities of the colored silkworm cocoons increase; notably, the PS cocoons exhibit a strong green fluorescence (upper right of ). A microscopy image of a single PS-cocoon thread, captured under UV light, confirms the emission of a strong and uniform green fluorescence from the fiber surface, indicating the existence of fluorescent materials in sericin (3). Scanning electron microscopy (SEM) images show that the surface of a PS cocoon is smooth and contains microfibers (diameter: ~16 µm), resulting in a large surface-to-volume ratio, which increases the sensitivity of the PS cocoon (). Fourier-transform infrared (FTIR) spectroscopy was used to examine the molecular conformation and crystallinity of the PS cocoon and Figure. S1 shows the FTIR spectra of raw silk (outside of the cocoon) where it can be seen that the absorption peak of the PS cocoons at 1,627.2 cm−1 is protein amide I band absorption peak; peak at 1,518.7 cm−1 is amide II-α-helix structure, whereas peak at 1,404.9 cm−1 are the curved vibrations of the C-H bond, peak at 1,236.2 cm−1 is amide III-β-sheet structure, and there is characteristic absorption peak at 1,058.8 cm−1 (amide Ⅴ-β-sheet structure).
Figure 1. Response of the various forms of Bombyx mori silk under 365-nm UV LED excitation.
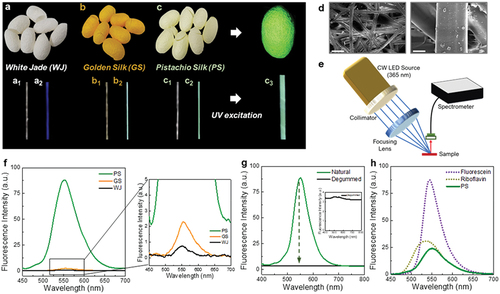
To investigate the fluorescence quantitatively, we constructed a spectrometer set-up as shown in . The UV light emitted by a 365-nm light-emitting diode (LED), mounted on the spectrometer set-up, was collimated, and focused on the silkworm cocoon samples. The emitted fluorescent light was collected by an optical fiber and sent to the spectrometer to record fluorescent spectra. shows the fluorescent spectra of the WJ, GS, and PS cocoon mats. Interestingly, the PS mat exhibits a strong green fluorescence with a central wavelength of 552 nm and full width at half maximum of 65 nm, whereas the fluorescence intensities of the WJ and GS cocoon mats are negligible (magnified plot in the right panel of ). Because silk fiber is composed of two proteins (fibroin in the core and sericin in the sheath), identifying the location of the fluorescent pigment is essential. The PS fiber mat was fully degummed to remove the outer sericin layer and excited by the UV LED. As shown in , the fluorescence disappears after the degumming, indicating that the pigment molecules are mainly present inside the sericin layer (Ma et al. Citation2016). The reflectance spectra of the GS and PS cocoons indicate the existence of color pigments in both samples (Fig. S2). However, the colors expressed by the GS and PS cocoons can be attributed to absorption and fluorescence, respectively. In addition, the PS fluorescence was compared to those of the commercial fluorescent dyes, i.e., riboflavin and sodium fluorescein, which are widely used in biological and medical applications, and their gains are sufficient to induce lasing. We prepared separate silk fibroin films containing 1% riboflavin and sodium fluorescein and demonstrated the strong optical gain of the dye-containing silk fibroin film for lasing. The fluorescence emitted from the PS cocoon mat was relatively weaker than that emitted by sodium fluorescein, but comparable to that of riboflavin (). Notably, qualitative analysis revealed that the quantum yield of the fluorescent pigment in the PS sericin was comparable to that of a commercial dye, where the quantum yield of a fluorescent pigment can be estimated by measuring the fluorescence intensities under the same excitation conditions (Figure. S3). We can observe the emission spectra emitted from the PS cocoon and riboflavin solution with a similar concentration to the fluorochrome in the PS.
The PS is the progeny of Japanese-originated green silk (Jam 315) and Chinese-originated white silk (Jam 316) cross-species and can therefore simultaneously carry two genes Ga and Gb, which complement each other to produce a light green color. Dietary quercetins are glucosylated by a quercetin 5-O-glucosyltransferase (Q5GT) encoded by Gb in the midgut and are likely transported via the glucose transporter encoded by Ga into the silk glands. Therefore, Ga controls the permeation of flavonoids from the blood to the silk gland and Gb is involved in the process of releasing flavonoids produced in the gastrointestinal tract from the gastrointestinal tract into the blood. Another independently inherited Gc gene, which is dominant in white cocoons, produces green cocoons with a stronger color. Silkworms produce two main pigments, viz. flavonoids, which impart green color to the cocoons, and carotenoids, which control the yellow and pinkish colors of cocoons (such as the GS) (Daimon et al. Citation2010; Sakudoh et al. Citation2007). A green silkworm species (Antheraea yamamai, AY) was prepared and its fluorescent spectra were measured for comparison (Fig. S4). The green silkworm cocoon exhibited a sky-blue fluorescence due to the existence of biliverdin (Leem et al. Citation2018), but the intensity was much weaker than that emitted by the PS cocoon (Fig. S5). The pigments in the PS, AY, and GS cocoons were extracted using EtOH, and the resulting pigment solutions were absorbed on filter papers. The capillary force drove the upward movement of the pigment molecules and EtOH (Fig. S6). Under UV light, the GS pigment showed a sky-blue fluorescence due to the presence of carotenoids (Sakudoh et al. Citation2007). The fluorescence intensity emitted by the AY pigment was extremely weak and could not be observed with our naked eyes (Leem et al. Citation2018). The PS pigment exhibited a strong green fluorescence, confirming the existence of quercetin 5-O-glucosides, which are the major constituents of cocoon flavonoids (Daimon et al. Citation2010).
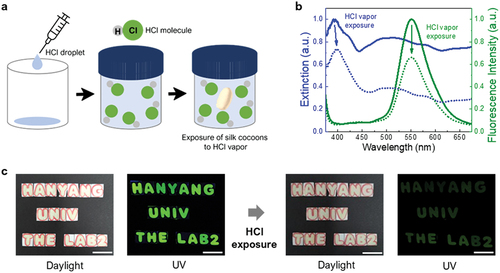
PS cocoons can be utilized as large fluorescent gas sensors because of their large surface-to-volume ratios. HCl vapor was adopted as an analyte because it is widely used to produce organic compounds but is corrosive and harmful to humans. The lowest concentrations (LCLo) of HCl vapors, lethal for an individual human, are 1300 and 3000 ppm for 30-min and 5-min exposures, respectively (Lestari et al. Citation2005). The RD50 (i.e., exposure concentration that decreases the respiratory rate by 50%) test is another standard method used as an indicator of the hazards of vapors. The 10-min RD50 value for mice has been reported to be 309 ppm (Barrow et al. Citation1977). Moreover, the permissible HCl-vapor exposure limit for an 8-h time-weighted average (TWA-PEL) in working spaces is 5 ppm (Baron, Narayanaswamy, and Thorpe Citation1996). Safety limits are very low compared to lethal concentrations because they are set by considering a long-time exposure over many hours. To examine the gas-sensing response of the fluorescent PS, the PS cocoons were placed in a beaker containing HCl vapors (), whose concentration was controlled by modulating the evaporated content of an HCl droplet. shows the absorption and emission spectra of the PS cocoons before (solid) and after (dotted) exposure to HCl vapors. Due to the exposure to a strong acid (300 ppm for 2 min), the absorbance and fluorescence intensities simultaneously deteriorate, and this feature can be used for fluorescent chemosensing. The effect of the HCl vapor exposure could be recognized with the naked eye. As shown in , the PS mats that were cut to express letters revealed a bright green fluorescence under UV light. After the HCl vapor exposure, the daylight color and fluorescence gradually faded as evident from Fig. S7. Here, we also compared the fluorescence properties of the digital images of the PS cocoon mats by evaluating RGB values and compared their intensity for different quenching images. The decrement in the Green (G) pixels from the sets of RGB for the PS cocoon mats exposed under HCl vapor ranging from 0 s to 60 s signified that the intensity can be affected (decreased) by the analytes, in this case, HCl, over an extended period of exposure. Similarly, the GS mats showed a similar fading upon HCl-vapor exposure (Fig. S8); however, the rates at which the fluorescence intensity and absorbance decreased were relatively lower than those of the PS mats, and a weak fluorescence was detected.
Figure 2. Natural PS cocoon as an HCl sensor. (a) Schematic of the preparation of HCl vapor environment. (b) Absorption and fluorescence spectra of HCl-exposed and non-exposed PS pristine fibers. (c) Character expression using PS cocoons and a shadow mask, representing HANYANG UNIV the LAB2, under daylight and UV-excitation, before and after HCl vapor exposure. Scale bars represent 2 cm.
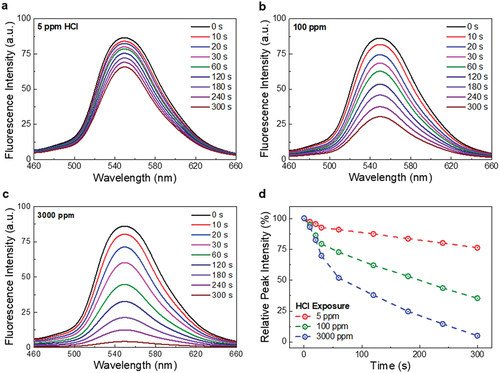
For quantitative analysis, the PS cocoon mats were exposed to different concentrations of HCl vapors (from 5 to 3000 ppm). A distinct fluorescence decay (fading) is evident even at a concentration of 5 ppm (TWA-PEL limit) as shown in . The fluorescence intensity decreases by 25% for a 5-min exposure, and this intensity decay can be easily detected by a simple photodetector. These results indicate the feasibility of using PS cocoon mats as cost-effective and compact sensing systems. Further, the fluorescence decay rate increases with the increasing HCl vapor concentration. For a 5-min exposure, the fluorescence ratios decrease to 65% and 79% at 100 and 300 ppm, respectively ( and Figure. S9c), and at a concentration of > 1000 ppm, the fluorescence completely vanishes/fades after 5 min ( and Figure. S9d). shows that the fading rate, determined by the ratio of the relative peak intensity change and exposure time, is high in the as-exposed stage and becomes constant. At 5 ppm, the fading rate is 15.0%p/min for 30 s and 3.6%p/min afterward, whereas the rates are 40.8%p/min and 10.0%p/min at 100 ppm. Notably, the fluorescence decays linearly and vanishes completely at all the HCl vapor concentrations, although the fading rate depends on the HCl concentrations. A calibration plot of fluorescence quenching efficiency versus the HCl concentration was deduced, from where the limit of detection (LoD) was calculated using the equation:
Figure 3. Quantitative illustration of HCl-imposed variations in the fluorescence of PS cocoon. (a–c) Time-dependent fluorescence spectra of PS cocoons at HCl concentrations of 5 ppm (low), 100 ppm (high), and 3000 ppm (lethal), respectively. (d) Change in relative fluorescence peak intensities for different HCl exposure durations.
where SD is the standard error of the calibrated curve and S is the slope. Using the equation, we obtained the LoD value of 0.62 ppm, indicating very high sensitivity of our sensor platform (Fig. S10) (Goswami and Sarma Citation2023; Goswami, Boruah, and Sarma Citation2023; Goswami, Sultana, and Sarma Citation2023). Fig. S11 shows the fluorescence decay of the PS cocoon mat under single-pulse excitation, where we numerically fitted the experimental decay profiles with a mono-exponential function e−t/τ and τs was obtained as 4.30 and 4.43 ns for the PS cocoon mat in pristine and HCl vapor exposed cases, respectively. Significantly, a pristine PS cocoon mat endured a lifetime like that of the cocoon mat exposed to a lethal concentration of HCl vapor analyte.
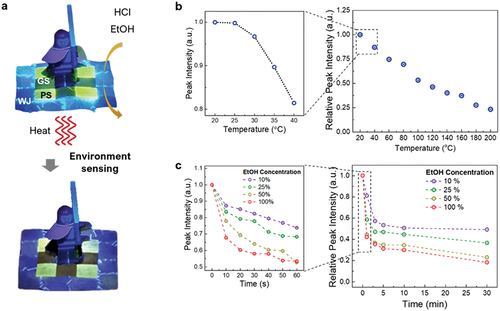
To investigate the versatility of fluorescence sensing, the PS cocoon mats were exposed to different environments, and temperature and EtOH content, which play a crucial role in biological and environmental research, were analyzed as the sensing parameters. The sensing performance of a material is determined by its ability to detect the decay in fluorescence under external stimuli (). Especially, the fluorescent pigment found in PS cocoons is a kind of flavonoid, and thus, these cocoons can efficiently respond to temperature changes and EtOH in water. Similar to the response of the cocoons under HCl exposure, the fluorescence of the cocoons diminished with a linear decay rate with the increasing heating time and/or immersion time in the EtOH solution at different concentrations of EtOH in water. shows the thermally induced changes in fluorescence exhibited by the PS cocoons upon heating where the temperature was increased slowly from 20 to 40°C. We observed that the transition to the fluorescence decay started at ~ 35°C, and above 40°C, the fluorescence decay followed a linear pattern up to 200°C; the total fluorescence decay was ~ 75% at 200°C ( and Fig. S12). Moreover, the fluorescence peak intensity of the PS cocoon sensor was measured at humidity levels of 30%, 40%, 50%, and 60%. There was less than 3% fluorescence enhancement for humidity levels ranging from 30% to 60%. It is well known that the ideal relative humidity level for maximum comfort and health is between 40% and 50%, and anything below 30% is considered too dry. Therefore, our PS cocoon sensor is stable under an ideal relative humidity level of 40–50% (Fig. S13). To investigate the EtOH sensing response, the PS cocoon mats were immersed in an EtOH-water solution with different EtOH concentrations at room temperature. Here, it is obvious that when the cocoons were immersed in EtOH at room temperature, the dissolution of dye to EtOH was not possible because the protocol that we used allows the dissolution of dye to EtOH only at 75°C and above. The fluorescence intensity of the PS cocoon mats rapidly faded during the first 60 s, and the highest decay rate was observed at an EtOH concentration of 100%. However, as the cocoon immersion time in EtOH increased, the fluorescence decayed linearly; a decay of ~ 80% was observed in the pure EtOH case after 30 min of immersion (, Figure. S14 and Figure. S15).
Figure 4. Versatility of PS cocoons as fluorescent materials. (a) Cocoon mat comprising WJ, GS, and PS cocoons with an arbitrary Lego character placed on it. The mat was exposed to heat and EtOH to demonstrate the fluorescence-sensing nature of the cocoons. (b) Temperature sensing characteristics of the PS cocoon to express the fading out of the fluorescence in the cocoon when the temperature is increased from 20°C to 200 ℃. (c) EtOH sensing characteristics of the PS cocoon to express the fading of the fluorescence in the cocoon when the cocoon-immersion time in EtOH is increased up to 30 min, for four different concentrations of EtOH.
Understanding the sensor selectivity is crucial for accurate measurements, detecting only target analytes to enhance precision and prevent errors. High selectivity ensures reliable results, boosting confidence across applications, while also saving resources by reducing sample preparation needs. In this work, the selectivity of the PS cocoon sensor was investigated among the three analytes HCl vapor, Heat, and EtOH solution, where three separate PS cocoon mats were utilized, one exposed to HCl vapor with a concentration of 3000 ppm for 5 min, another heated at 200°C for 5 min, and the last immersed in EtOH solution for 5 min. We observed that the fluorescence quenching obtained from HCl, heat, and EtOH analytes were ~ 95%, ~77%, and ~ 69%, respectively. This result confirmed that the PS cocoon sensor has the highest selectivity toward HCl vapor (Fig. S16). Furthermore, to validate our selectivity results, we investigated the luminescence properties of the PS cocoon mats and their quenching effects under the fluorescence microscope. We observed from the fluorescent images that the EtOH-immersed cocoon mat showed the slowest decay in fluorescence, the heated cocoon mat showed substantially higher fluorescence quenching than the EtOH-immersed cocoon mat, and the HCl vapor-exposed cocoon mat showed the highest quenching where the fluorescence almost died at 3000 ppm HCl vapors after 5 min exposure. The fluorescence of the PS cocoon mats also verified the microscopy results via RGB pixels where the green fluorescence decayed substantially from the control cocoon mats (RGB: 205, 220, 18) to EtOH-immersed (RGB: 192, 200, 38), Heated (RGB: 156, 138, 35), and HCl-exposed (RGB: 98, 83, 35) cocoon mats (Fig. S17).
To verify the effectiveness of an ideal sensor, it’s essential to assess how various factors such as different acid vapors and laboratory reagents might impede the sensor’s ability to efficiently quench fluorescence during the detection of HCl vapor and EtOH sensing. We investigated the interference of various acid vapors, including sulfuric acid (H2SO4), nitric acid (HNO3), and phosphoric acid (H3PO4) on the PS cocoon sensor to detect HCl vapor. Following a 5-minute exposure of PS cocoon mats to H2SO4, HNO3, and H3PO4 at a concentration of 3000 ppm, we observed fluorescence quenching rates of approximately 53%, 36%, and 30%, respectively. Consequently, H2SO4, HNO3, and H3PO4 do not significantly interfere with the PS cocoon sensor’s ability to detect HCl vapor (Fig. S18). Similarly, we examined the interference caused by different laboratory reagents, including methanol (MeOH), isopropanol (IPA), and acetone, on the fluorescence intensity of PS cocoons serving as an ethanol (EtOH) sensor, where we immersed the cocoon mats in fixed concentrations (v/v) of EtOH, MeOH, IPA, and acetone, respectively. Interestingly, there was no change in the fluorescence intensity of the PS cocoon mat in acetone. However, the quenching was observed as 28.7%, 37.4%, and 69% for the cocoon mats in IPA, MeOH, and EtOH, respectively. As a result, MeOH, IPA, and acetone do not notably impede the PS cocoon sensor’s ability as an EtOH sensor (Fig. S19).
Based on the existing research findings, we conducted a comparative analysis (referenced in Table S1) to assess the strengths and effectiveness of our proposed PS cocoon sensor system in detecting HCl vapors. Our PS cocoon sensor stood out for its heightened selectivity compared to alternative methods owing to its unique characteristics and emission behavior when exposed to the sensing analytes. Especially, the LoD that our sensor possesses to the HCl vapor analyte is the smallest among the listed findings in Table S1. Additionally, the features such as biocompatibility and biodegradability of the PS cocoon sensor offer the advantage of a straightforward and speedy sensing platform for on-site analyte detection with superior selectivity. These results collectively suggest that because of the presence of the fluorescent pigment in PS, PS cocoons can be used as sensors under various biological and environmental stimuli. These sensing abilities of PS can be attributed to the changes in the flavonoid activity induced by various agents.
Conclusions
In summary, we demonstrated the feasibility of using light-green PS cocoons as fluorescent environmental sensors. The PS cocoon mats exhibited a strong green fluorescence, whose intensity was comparable to those emitted by commercial fluorescent dyes. We found out that the fluorescent pigment molecules were a kind of flavonoid and existed in the outer sericin cladding layer. Especially, the PS cocoon mat was instantly responsive and highly sensitive to HCl vapors. A low concentration (a few ppm) of HCl vapors was sufficient to induce a detectable change in the fluorescence intensity, and at a lethal concentration (3000 ppm), an instantaneous decrease in the fluorescence intensity was observed. In addition to chemosensing, the fluorescence from the PS cocoons responded to temperature and EtOH concentration in water. The decrease in the fluorescence intensity was strongly correlated to the changes in temperature and EtOH concentrations. Although further studies are required to understand the intrinsic light-emitting properties of the flavonoid-based pigment in PS cocoons, fabrics and health-promoting dietary supplements incorporated with the natural fluorescent pigment can act as biocompatible and environmentally friendly optical sensing materials.
Highlights
Temperatures and ethanol can be analytes for the natural cocoon sensor.
A naturally bred silkworm cocoon exhibits strong green fluorescence.
Green fluorescence responds to external stimuli.
Cocoon textile itself can be a highly sensitive chemosensor to detect HCl vapor.
Author contributions
S.K. designed the research; R.K.J. conducted the experiments, measured the optical properties, and generated the figures, S.W.K. provided the resources; R.K.J. and S.K. analyzed the data and wrote the manuscript. All authors reviewed the manuscript.
Supplemental Material
Download MS Word (2.8 MB)Disclosure statement
No potential conflict of interest was reported by the author(s).
Data availability statement
The data are available from the corresponding author upon reasonable request.
Supplementary material
Supplemental data for this article can be accessed online at https://doi.org/10.1080/15440478.2024.2357239
Additional information
Funding
References
- Alas, M. O., F. B. Alkas, A. A. Sukuroglu, R. G. Alturk, and D. Battal. 2020. “Fluorescent Carbon Dots Are the New Quantum Dots: An Overview of Their Potential in Emerging Technologies and Nanosafety.” Journal of Materials Science 55 (31): 15074–14. https://doi.org/10.1007/s10853-020-05054-y.
- Baron, M. G., R. Narayanaswamy, and S. C. Thorpe. 1996. “Hydrophobic Membrane Sensors for the Optical Determination of Hydrogen Chloride Gas.” Sensors and Actuators B, Chemical 34 (1–3): 511–515. https://doi.org/10.1016/S0925-4005(96)01942-9.
- Barrow, C. S., Y. Alarie, J. C. Warrick, and M. A. F. Stock. 1977. “Comparison of the Sensory Irritation Response in Mice to Chlorine and Hydrogen Chloride.” Archives of Environmental Health 32 (2): 68. https://doi.org/10.1080/00039896.1977.10667258.
- Chambre, L., Z. Martín-Moldes, R. N. Parker, and D. L. Kaplan. 2020. “Bioengineered Elastin- and Silk-Biomaterials for Drug and Gene Delivery.” Advanced Drug Delivery Reviews 160:186–198. https://doi.org/10.1016/j.addr.2020.10.008.
- Chen, G., Y. Li, M. Bick, and J. Chen. 2020. “Smart Textiles for Electricity Generation.” Chemical Reviews 120 (8): 3668–3720. https://doi.org/10.1021/acs.chemrev.9b00821.
- Chung, S. C., J. S. Park, R. K. Jha, J. Kim, J. Kim, M. Kim, J. Choi, et al. 2022. “Engineering Silk Protein to Modulate Polymorphic Transitions for Green Lithography Resists.” ACS Applied Materials and Interfaces 14 (51): 56623–56634. https://doi.org/10.1021/acsami.2c17843.
- Daimon, T., C. Hirayama, M. Kanai, Y. Ruike, Y. Meng, E. Kosegawa, M. Nakamura, G. Tsujimoto, S. Katsuma, and T. Shimada. 2010. “The Silkworm Green B Locus Encodes a Quercetin 5- O -Glucosyltransferase That Produces Green Cocoons with UV-Shielding Properties.” Proceedings of the National Academy of Sciences 107 (25): 11471–11476. https://doi.org/10.1073/pnas.1000479107.
- Das, S., and J. David. 2022. “Colored and Luminescent Silk.” Journal of Natural Fibers 19 (14): 9420–9433. https://doi.org/10.1080/15440478.2021.1982831.
- Du, H., X. Wang, Q. Yang, and W. Wu. 2021. “Quantum Dot: Lightning Invisible Foodborne Pathogens.” Trends in Food Science & Technology 110:1–12. https://doi.org/10.1016/j.tifs.2021.01.065.
- Gogurla, N., and S. Kim. 2021. “Self-Powered and Imperceptible Electronic Tattoos Based on Silk Protein Nanofiber and Carbon Nanotubes for Human–Machine Interfaces.” Advanced Energy Materials 11 (29): 2100801. https://doi.org/10.1002/aenm.202100801.
- Gogurla, N., B. Roy, J. Y. Park, and S. Kim. 2019. “Skin-Contact Actuated Single-Electrode Protein Triboelectric Nanogenerator and Strain Sensor for Biomechanical Energy Harvesting and Motion Sensing.” Nano Energy 62:674–681. https://doi.org/10.1016/j.nanoen.2019.05.082.
- Gogurla, N., A. Wahab, and S. Kim. 2023. “A Biomaterial-Silicon Junction for Photodetection.” Materials Today Bio 20:100642. https://doi.org/10.1016/j.mtbio.2023.100642.
- Goswami, K. J., A. Boruah, and N. S. Sarma. 2023. “Smart-Phone-Assisted Optical Biosensors Based on Silk-Fibroin-Decorated Reduced Graphene Oxide Quantum Dots for Fluorescent Turn-On Recognition of L-Dopa.” ACS Applied Nano Materials 6 (12): 10191–10201. https://doi.org/10.1021/acsanm.3c01088.
- Goswami, K. J., and N. S. Sarma. 2023. ““Click” Reaction-Mediated Silk Fibroin-Functionalized Thiol-Branched Graphene Oxide Quantum Dots for Smart Sensing of Tetracycline.” American Chemical Society Omega 8 (24): 21914–21928. https://doi.org/10.1021/acsomega.3c01753.
- Goswami, K. J., N. Sultana, and N. S. Sarma. 2023. “Duel Phase Selective Inner Filter Effect-Based Luminescent Sensing for the Detection of Para-Nitrophenol and Picric Acid.” Sensors and Actuators B, Chemical 374:132778. https://doi.org/10.1016/j.snb.2022.132778.
- Guan, X., J. Gong, and B. Xu. 2020. “Three-Dimensional Conformal Porous Microstructural Engineering of Textile Substrates with Customized Functions of Brick Materials and Inherent Advantages of Textiles.” ACS Applied Materials and Interfaces 12 (15): 17967–17978. https://doi.org/10.1021/acsami.0c01557.
- Han, F., T. Wang, G. Liu, H. Liu, X. Xie, Z. Wei, J. Li, C. Jiang, Y. He, and F. Xu. 2022. “Materials with Tunable Optical Properties for Wearable Epidermal Sensing in Health Monitoring.” Advanced Materials 34 (26): 2109055. https://doi.org/10.1002/adma.202109055.
- Han, Y., W. Yang, X. Luo, X. He, H. Zhao, W. Tang, T. Yue, and Z. Li. 2022. “Carbon Dots Based Ratiometric Fluorescent Sensing Platform for Food Safety.” Critical Reviews in Food Science and Nutrition 62 (1): 244–260. https://doi.org/10.1080/10408398.2020.1814197.
- He, C., P. Xu, X. Zhang, and W. Long. 2022. “The Synthetic Strategies, Photoluminescence Mechanisms and Promising Applications of Carbon Dots: Current State and Future Perspective.” Carbon 186:91–127. https://doi.org/10.1016/j.carbon.2021.10.002.
- Hong, Y., B. Wang, Z. Long, Z. Zhang, Q. Pan, S. Liu, X. Luo, and Z. Yang. 2021. “Hierarchically Interconnected Piezoceramic Textile with a Balanced Performance in Piezoelectricity, Flexibility, Toughness, and Air Permeability.” Advanced Functional Materials 31 (42): 2104737. https://doi.org/10.1002/adfm.202104737.
- Hu, Y., F. Tan, S. Wang, L. A. Berglund, Y. Fan, and Q. Zhou. 2023. “Composites of Silk Nanofibrils and Metal–Organic Framework Nanosheets for Fluorescence-Based Sensing and UV Shielding.” ACS Applied Nano Materials 6 (7): 6046–6055. https://doi.org/10.1021/acsanm.3c00386.
- Jeon, H., J. Lee, M. H. Kim, and J. Yoon. 2012. “Polydiacetylene-Based Electrospun Fibers for Detection of HCl Gas.” Macromolecular Rapid Communications 33 (11): 972–976. https://doi.org/10.1002/marc.201100882.
- Jia, L. W., and X. Zhang. 2023. “Versatile Red-Emissive Carbon Dots for Smart Textiles and Fluorescence Sensing.” ACS Applied Nano Materials 6 (2): 1379–1385. https://doi.org/10.1021/acsanm.2c05012.
- Joshi, S. R., A. Pratap, N. Gogurla, and S. Kim. 2022. “Ultrathin, Breathable, Permeable, and Skin‐Adhesive Charge Storage Electronic Tattoos Based on Biopolymer Nanofibers and Carbon Nanotubes.” Advanced Electronic Materials 9 (9): 2201095.
- Kang, P. D., G. B. Sung, K. Y. Kim, H. S. Lee, M. J. Kim, S. D. Ji, I. P. Hong, et al. 2011. “Breeding of New Silkworm Strain Yeonnokjam.” International Journal of Industrial Entomology 23 (1): 175–178. https://doi.org/10.7852/ijie.2011.23.1.175.
- Kim, S., B. Marelli, M. A. Brenckle, A. N. Mitropoulos, E. S. Gil, K. Tsioris, H. Tao, D. L. Kaplan, and F. G. Omenetto. 2014. “All-Water-Based Electron-Beam Lithography Using Silk As a Resist.” Nature Nanotechnology 9 (4): 306–310. https://doi.org/10.1038/nnano.2014.47.
- Kim, S., A. N. Mitropoulos, J. D. Spitzberg, H. Tao, D. L. Kaplan, and F. G. Omenetto. 2012. “Silk Inverse Opals.” Nature Photonics 6 (12): 818–823. https://doi.org/10.1038/nphoton.2012.264.
- Kwak, H. W., J. Eom, S. Y. Cho, M. E. Lee, and H. J. Jin. 2019. “High-Toughness Natural Polymer Nonwoven Preforms Inspired by Silkworm Cocoon Structure.” International Journal of Biological Macromolecules 127:146–152. https://doi.org/10.1016/j.ijbiomac.2019.01.005.
- Leem, J. W., A. E. L. Allcca, J. Chen, S. W. Kim, K. Y. Kim, K. H. Choi, Y. P. Chen, S. R. Kim, and Y. L. Kim. 2018. “Visible Light Biophotosensors Using Biliverdin from Antheraea Yamamai.” Optics Express 26 (24): 31817–31828. https://doi.org/10.1364/OE.26.031817.
- Lee, O. J., M. T. Sultan, H. Hong, Y. J. Lee, J. S. Lee, H. Lee, S. H. Kim, and C. H. Park. 2020. “Recent Advances in Fluorescent Silk Fibroin.” Frontiers in Materials 7:50. https://doi.org/10.3389/fmats.2020.00050.
- Lestari, F., A. J. Hayes, A. R. Green, and B. Markovic. 2005. “In vitro Cytotoxicity of Selected Chemicals Commonly Produced During Fire Combustion Using Human Cell Lines.” Toxicology in Vitro 19 (5): 653–663. https://doi.org/10.1016/j.tiv.2005.03.002.
- Libanori, A., G. Chen, X. Zhao, Y. Zhou, and J. Chen. 2022. “Smart Textiles for Personalized Healthcare.” Nature Electronics 5 (3): 142–156. https://doi.org/10.1038/s41928-022-00723-z.
- Lin, N., L. Cao, Q. Huang, C. Wang, Y. Wang, J. Zhou, and X. Y. Liu. 2016. “Functionalization of Silk Fibroin Materials at Mesoscale.” Advanced Functional Materials 26 (48): 8885–8902. https://doi.org/10.1002/adfm.201603826.
- Lin, Q., Y. Zhu, Y. Wang, D. Li, Y. Zhao, Y. Liu, F. Li, and W. Huang. 2023. “Flexible Quantum Dot Light‐Emitting Device for Emerging Multifunctional and Smart Applications.” Advanced Materials (Deerfield Beach, Fla) 35 (32): 2210385.
- Liu, X. H., Y. F. Li, J. Xu, J. Zhou, and X. P. Lu. 2011. “The Fluorescent Pigment of Mulberry Transferred in the Body of Silkworm, Bombyx Mori.” Advances in Materials Research 175:3–7. https://doi.org/10.4028/www.scientific.net/amr.175-176.3.
- Lu, Y., J. Luo, E. An, B. Lu, Y. Wei, X. Chen, K. Lu, et al. 2023. “Deciphering the Genetic Basis of Silkworm Cocoon Colors Provides New Insights into Biological Coloration and Phenotypic Diversification.” Molecular Biology and Evolution 40 (2): msad017. https://doi.org/10.1093/molbev/msad017.
- Ma, M., M. Hussain, S. Dong, and W. Zhou. 2016. “Characterization of the Pigment in Naturally Yellow-Colored Domestic Silk.” Dyes and Pigments 124:6–11. https://doi.org/10.1016/j.dyepig.2015.08.003.
- Min, K., S. Kim, and S. Kim. 2017. “Deformable and conformal silk hydrogel inverse opal.” Proceedings of the National Academy of Sciences 114 (24): 6185–6190. https://doi.org/10.1073/pnas.1701092114.
- Min, K., S. Kim, C. G. Kim, and S. Kim. 2017. “Ror2 Signaling Regulates Golgi Structure and Transport Through IFT20 for Tumor Invasiveness.” Scientific Reports 7 (1): 1–8. https://doi.org/10.1038/s41598-016-0028-x.
- Omenetto, F. G., and D. L. Kaplan. 2008. “A New Route for Silk.” Nature Photonics 2 (11): 641–643. https://doi.org/10.1038/nphoton.2008.207.
- Omenetto, F. G., and D. L. Kaplan. 2010. “New Opportunities for an Ancient Material.” Science 329 (5991): 528–531. https://doi.org/10.1126/science.1188936.
- Pan, J., H. Xu, Y. Cheng, B. K. Mintah, M. Dabbour, F. Yang, W. Chen, et al. 2022. “Recent Insight on Edible Insect Protein: Extraction, Functional Properties, Allergenicity, Bioactivity, and Applications.” Foods 11 (19): 2931. https://doi.org/10.3390/foods11192931.
- Prakash, N. J., P. P. Mane, S. M. George, and B. Kandasubramanian. 2021. “Silk Fibroin as an Immobilization Matrix for Sensing Applications.” ACS Biomaterials Science & Engineering 7 (6): 2015–2042. https://doi.org/10.1021/acsbiomaterials.1c00080.
- Sakudoh, T., H. Sezutsu, T. Nakashima, I. Kobayashi, H. Fujimoto, K. Uchino, Y. Banno, et al. 2007. “Carotenoid Silk Coloration Is Controlled by a Carotenoid-Binding Protein, a Product of the Yellow Blood Gene.” Proceedings of the National Academy of Sciences 104 (21): 8941–8946. https://doi.org/10.1073/pnas.0702860104.
- Shin, J., H. Wang, K. Kwon, D. Ostojich, Z. Christiansen, J. Berkovich, Y. Park, et al. 2023. “Wireless, Soft Sensors of Skin Hydration with Designs Optimized for Rapid, Accurate Diagnostics of Dermatological Health.” Advanced Healthcare Materials 12 (4): 2202021. https://doi.org/10.1002/adhm.202202021.
- Stuart, M. A. C., W. T. S. Huck, J. Genzer, M. Müller, C. Ober, M. Stamm, G. B. Sukhorukov, et al. 2010. “Emerging Applications of Stimuli-Responsive Polymer Materials.” Nature Materials 9 (2): 101–113. https://doi.org/10.1038/nmat2614.
- Subaihi, A., S. D. Al-Qahtani, R. M. S. Attar, K. Alkhamis, H. K. Alzahrani, M. Alhasani, and N. M. El-Metwaly. 2022. “Preparation of Fluorescent Cotton Fibers with Antimicrobial Activity Using Lanthanide-Doped Pigments.” Cellulose 29 (11): 6393–6404. https://doi.org/10.1007/s10570-022-04665-9.
- Tang, S., C. Zhao, G. Chen, and G. Sun. 2019. “A Study on Computerized Selection of Fluorescent Dyes for Environmentally Friendly Textile Applications.” Dyes and Pigments: An International Journal 165:256–263. https://doi.org/10.1016/j.dyepig.2019.02.021.
- Tansil, N. C., L. D. Koh, and M. Y. Han. 2012. “Functional Silk: Colored and Luminescent.” Advanced Materials (Deerfield Beach, Florida) 24 (11): 1388–1397. https://doi.org/10.1002/adma.201104118.
- Tat, T., G. Chen, X. Zhao, Y. Zhou, J. Xu, and J. Chen. 2022. “Smart Textiles for Healthcare and Sustainability.” Agricultural Science & Technology Nano 16 (9): 13301–13313. https://doi.org/10.1021/acsnano.2c06287.
- Umar, M., K. Min, and S. Kim. 2018. “A Physically Transient and Eco-Friendly Distributed Feedback Laser Chemosensor for Detecting Acid Vapor.” Sensors and Actuators B, Chemical 255:3207–3215. https://doi.org/10.1016/j.snb.2017.09.147.
- Vivekananthan, V., N. R. Alluri, Y. Purusothaman, A. Chandrasekhar, S. Selvarajan, and S. J. Kim. 2018. “Biocompatible Collagen Nanofibrils: An Approach for Sustainable Energy Harvesting and Battery-Free Humidity Sensor Applications.” ACS Applied Materials and Interfaces 10 (22): 18650–18656. https://doi.org/10.1021/acsami.8b02915.
- Wang, K., R. S. Hazra, Q. Ma, M. R. H. Khan, A. Al Hoque, L. Jiang, M. Quadir, Y. Zhang, S. Wang, and G. Han. 2023. “Robust Biocompatible Bacterial Cellulose/Silk Nonwoven Fabric/Silk Sericin Sandwich Membrane with Strong UV-Blocking and Antioxidant Properties.” Cellulose 30 (6): 3973–3993. https://doi.org/10.1007/s10570-023-05102-1.
- Wang, Y., F. Wang, R. Wang, C. Tian, X. Hua, P. Zhao, and Q. Xia. 2022. “Human-Derived Cytokine Functionalized Sericin/Agarose Composite Gel Material with Cell Proliferation-Promoting Activity Fabricated Using Genetically Engineered Silk for Medical Application.” Materials & Design 224:111362. https://doi.org/10.1016/j.matdes.2022.111362.
- Zhang, Y., X. Xia, K. Ma, G. Xia, M. Wu, Y. H. Cheung, H. Yu, et al. 2023. “Functional Textiles with Smart Properties: Their Fabrications and Sustainable Applications.” Advanced Functional Materials 33 (33): 2301607.
- Zheng, X., M. Zhao, H. Zhang, S. Fan, H. Shao, X. Hu, and Y. Zhang. 2018. “Intrinsically Fluorescent Silks from Silkworms Fed with Rare-Earth Upconverting Phosphors.” ACS Biomaterials Science & Engineering 4 (12): 4021–4027. https://doi.org/10.1021/acsbiomaterials.8b00986.