
 ?Mathematical formulae have been encoded as MathML and are displayed in this HTML version using MathJax in order to improve their display. Uncheck the box to turn MathJax off. This feature requires Javascript. Click on a formula to zoom.
ABSTRACT
Fiber density can be used to estimate composite weight and to evaluate fiber content for property predictions in fiber-reinforced composites. Yet, natural fibers don’t have fixed density value given on datasheet and their density measurement is affected by various factors. This study compares various standard natural fiber’s density mearusing methods and identifies determinant factors to, then, estimate the density of Enset fibers by using the optimal combination. The advantages and disadvantages of five standard methods were compared considering the characteristics of natural fibers’ and methods’ effectiveness where Helium gas Pycnometry is selected afterward. Standard calibration sphere and synthetic fiber with known density is measured for validation. The study analyzed the impact of variables on result’s precision and accuracy. Then, Density of Enset fiber have been measured with varied factors including uniformity and duration purging, volume cell type and amount of fiber in a cell, and fiber size. The result showed that fluctuation is minimized, and accuracy and precision is enhanced for the larger volume cell, larger mass of fiber in a cell, smaller size fiber and longer uniform purging. Finally, measured density of Enset using the best combination of factors is 1.38 ± 0.01 g/cm3.
摘要
纤维密度可用于估计复合材料的重量和评估纤维含量,用于纤维增强复合材料的性能预测. 然而,天然纤维并没有在数据表上给出固定的密度值,它们的密度测量受到各种因素的影响. 本研究试图比较用于测量天然纤维密度的各种标准方法,并确定影响测量结果的因素,然后通过使用这些因素的最佳组合来估计Enset纤维的密度. 考虑到天然纤维的特性和随后选择氦气比重计的方法的有效性,比较了五种标准方法的优缺点. 测量了标准校准球和已知密度的合成纤维,以进行验证和参数的初步效果描述. 分析包括研究特定变量对结果精度和准确性的影响. 此外,还考虑了各种增强方案. 然后,以Enset纤维为例,用不同的因素测量了其密度,包括均匀性和吹扫时间、体积细胞类型和细胞中纤维的数量以及纤维尺寸. 结果表明,体积越大、池中纤维质量越大、纤维尺寸越小、吹扫时间越长,波动越小,精度和精度越高. 最后,使用最佳因素组合测得的Enset密度为1.38 ± 0.01 g/cm3.
KEYWORDS:
Introduction
Fiber density is an essential property which can be used to estimate composite weight (Eren Citation2017; Genovese et al. Citation2009; Herrmannsdörfer and Klapötke Citation2021; Saadati et al. Citation2019). It is, also, used to evaluate fiber content for property predictions in fiber-reinforced polymer matrix composites (Le Gall et al. Citation2018; Saadati et al. Citation2019). Synthetic fibers’ unique density values are known for a specific fiber grade from datasheets and provide reliable fiber content estimations and composite property predictions (AGY Citation2022; Fiber Citation2020; Le Gall et al. Citation2018). But, density of natural fibers is not given in such a way and there are various factors affecting their values due to their nature (Karimah et al. Citation2021; Saadati et al. Citation2019). Fiber type, lignocellulose structure, location, agro-ecology, and plant age can be some of the factors affecting the fibers’ density (Karimah et al. Citation2021).
Besides variation in the density between diverse fibers, different literature reports varying density value for the same fiber (Saadati et al. Citation2019). Some literature fails to mention the specific method used to calculate the density, which could potentially explain the discrepancies observed. Residual moisture, drying and desiccation, and fiber size can also be among factors causing the variation, and underestimation or overestimation of natural fibers’ density (Genovese et al. Citation2009; Herrmannsdörfer and Klapötke Citation2021; Le Gall et al. Citation2018). Besides, fiber size and conditioning, structure of the lignocellulose and density measurement method employed plays key role in resulting variation in measured density values (Abdela, Versteyhe, and Taddese Citation2020; Karimah et al. Citation2021; Rude, Strait, and Ruhala Citation2000).
Lignocellulose structure of natural fibers
The lignocellulose structure substantially affects the characteristic of natural fibers (Kiflie Citation2019). Enset is characterized by high amount of cellulose above 69.5% and low lignin content of about 5.7% compared to other wood and many non-wood fiber sources (Kiflie Citation2019; Teli and Terega Citation2017). There is a slight variation in the cellulose and lignin content found in Enset fibers extracted from different ecological zones and plants of varying ages (Borrell et al. Citation2019, Citation2020; Tamire Citation2015). Equally, the fiber length, width and internal holes are vital during density measurement and subsequent result interpretation. Enset fibers have an average length of about 1.66 m, width of 28.5 µm, and have wider lumen (25.9 µm) and thinner cell wall (2.9 µm) (Adusumalli et al. Citation2019; Kiflie Citation2019). The estimation outcome of density is influenced by the lumen, which is dependent on the length of the fiber considered during measurement (Arias-Castro, Mason, and Pelletier Citation2016; Rude, Strait, and Ruhala Citation2000). So, considering different size of fiber to portray the resulting density would be crucial. Also, need for enough purging time to penetrate every internal hole is expected during density estimation when gas Pycnometry used (Le Gall et al. Citation2018; Saadati et al. Citation2019).
Natural fibers’ density estimation methods: advantages and disadvantages
Measurement method used is one of the main factors that affect density value (Saadati et al. Citation2019). Archimedes, diametric/linear density, gradient column, liquid Pycnometry, and gas Pycnometry are some of standard methods utilized to measure fiber density, of course, with advantages and disadvantages (Borrell et al. Citation2019; Tamire Citation2015).
Archimedes by weight is the most common method of determining fiber density because special equipment is not needed (Agrawal Citation2021; Le Gall et al. Citation2018; Saadati et al. Citation2019). The specimen is weighed dry in air, and then weighed again while submerged in a degassed liquid of known density; the difference between the two weights is the buoyancy force. Dividing the buoyancy force by the density of the liquid converts the buoyancy force to specimen volume. Lastly, the specimen weight in air, divided by its volume, yields the sample density (Saadati et al. Citation2019). This method has drawback since weighing dry of the specimen in air is difficult due to hydrophilicity; natural fiber may contain up to 12% moisture (Abdela et al. Citation2023; Ebanda and Boris Citation2019). Hence, proper drying and desiccation is needed to get cooling without absorbing moisture to in turn get fibers’ net weight. Again, submerging the specimen in a degassed liquid of known density is challenging due to hydrophilicity of natural fibers.
Diametric and linear density of a fiber is another possible option where density can be measured by many methods; the simplest one is to measure a length of material and weigh it (Altaş and Kadoǧlu Citation2006). Yet, this requires a large sample and masks the variability of linear density along the length, and is difficult to apply if the fibers are crimped or otherwise cannot lay flat relaxed. The major restraint of this method for natural fibers is fibers’ shape irregularities across the length and comprising of lumen as well as other porosities (Abdela, Buffel, and Desplentere Citation2021; Adusumalli et al. Citation2019). This method, thus, should incorporate number of assumption that may result in underestimating or overestimating the density.
Gradient column is the other method where the density of the specimen is matched to the density of a liquid media (Peters and Katz Citation1962; Preview Citation2019). This method has advantage since no direct measurements of weight or volume are needed. The location of the specimen’s closest calibrated glass float determines the density of the specimen (Peters and Katz Citation1962). Yet, this method requires an unrecoverable sample, have a limited density range (≤3 g/cc), have difficulty with removal of air bubbles from the sample, and are prone to contamination of the column (Preview Citation2019). The other key limitation of the method is that it incorporates submerging of the hydrophilic fibers into liquid media; this is again a challenge (Borrell et al. Citation2019; Saadati et al. Citation2019).
The fourth option is liquid Pycnometry. It is similar to the Archimedes, but specimen’s volume is directly measured (3 Density Determination by Pycnometer Theory Citation2023) (Sander and Sniegoski Citation2017). The specimen is placed in a liquid Pycnometry and the amount of liquid displaced is recorded as the specimen’s volume. The specimen’s weight in air is divided by its volume, to compute its density. Yet, liquid Pycnometry is only useful for materials of higher density than the liquid being used (Sander and Sniegoski Citation2017). The other drawback of the method for natural fiber is the lignocellulose structure and intrinsic hydrophilicity (Abdela, Versteyhe, and Taddese Citation2020; Adusumalli et al. Citation2019). Hence, some of the liquid covering the fiber could be absorbed unevenly. And, there is a probability of having enduring vacancy.
The fifth method is helium gas Pycnometry where volume is measured by displacement where gaseous medium is used instead of a liquid (Herrmannsdörfer and Klapötke Citation2021). Dry, ultra-pure helium (<10 ppm) is used as the medium as its small atomic dimensions assure diffusion into pores as small as one Angstrom (Saadati et al. Citation2019). The volume of a solid is determined by measuring the pressure difference when a known quantity of pressurized helium is allowed to flow from a precisely known reference volume into a sample cell, also of precisely known volume, which contains the solid (Le Gall et al. Citation2018; Rude, Strait, and Ruhala Citation2000). The selector valve is then slowly opened, allowing helium to diffuse into the sample cell. The gas pressure equilibrates and the volume of the specimen is calculated from the decrease in system pressure. The specimen density is determined by dividing the specimen’s mass by its volume.
Various research findings suggest that helium Pycnometry can be considered a dependable technique for estimating the density of synthetic fibers (Herrmannsdörfer and Klapötke Citation2021; Rude, Strait, and Ruhala Citation2000; Saadati et al. Citation2019). The use of helium Pycnometry presents the possibility of achieving accurate measurements of fiber (Rude, Strait, and Ruhala Citation2000). The density of E-glass, S2-glass, and carbon fibers was determined using helium Pycnometry in this research, with a comparison made to results obtained from alternative fiber density measurement techniques. The helium Pycnometry method exhibited a notably higher level of result accuracy and precision. The density of E-glass was determined to be 2.6173 g/cc. S2-glass was found to have a density of 2.4858 g/cc. Measured carbon fiber densities were 1.7635 g/cc for Toray T300, and 1.7758 g/cc for Hercules IM7. This finding aligns with the values presented in the datasheet and is consistent with other research studies (Rude, Strait, and Ruhala Citation2000; Sanborn and Weerasooriya Citation2015). The inherent characteristics of natural fibers necessitate further exploration of the potential applications of the helium Pycnometry method.
The key advantage of this method, for natural fibers, is possibility to avoid liquid in the process and utilization of pure Helium gas with the potential to be diffused into tiny pores in the fiber (Abdela, Buffel, and Desplentere Citation2021; Abdela, Versteyhe, and Taddese Citation2020). Hence, the challenge linked to the fiber hydrophilicity can be better addressed while lumen/porosities are also better filled with the same gas (Le Gall et al. Citation2018). Still, the accuracy and precision of the density measurement may vary based on parameters and/or factors variations in the process (Abdela, Buffel, and Desplentere Citation2021). The fiber length, purging duration and uniformity, weight of the fiber and the volume cell type used are among the major factors (Abdela, Buffel, and Desplentere Citation2021; Abdela, Versteyhe, and Taddese Citation2020).
Considering various factors mentioned above, density of Enset fiber is measured using optimum combination of the aforesaid parameters using helium gas Pycnometry. During the course of this investigation, the researchers examined Enset fiber derived from Enset plants of varying ages. The fiber was then chopped into different sizes and subjected to different purging uniform times. Additionally, the fiber chopped into different size is loaded into cells of varying volumes and different amounts of material were taken into account. The obtained results were compared, allowing for an analysis of the individual effects of each factor as well as the combined effects of multiple factors. Ultimately, the density of the representative Enset fiber was measured.
Material and method
Material
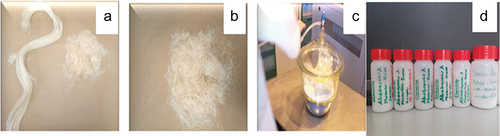
A. Enset Fiber/False banana: Enset fibers () were sourced from Ethiopian indigenous Enset plant (Ensete Ventricosumn) from Kokosa, Oromia, Ethiopia, found at 2627 m altitude with min and max annual average temperature of 12°C and 18°C respectively (Abdela et al. Citation2023; Abdela, Buffel, and Desplentere Citation2021; Gelgelu et al. Citation2023). Fibers obtained from the Enset plant were manually extracted using in-house developed technique. These fibers were obtained from three distinct stages of the plant’s growth, specifically 1, 2, and 3 years after the pulp underwent the initial extraction process. The ages of the plants were approximately 5, 6, and 7 years, respectively, (Abdela, Versteyhe, and Taddese Citation2020).
Figure 1. (a) Enset fiber (b) Chopped enset fiber (c) Desiccation and (d) Samples.
Methods
Fiber Preparation
For direct density estimation using diameter, the fibers were cut to a length of 10 cm, dried for 24 hrs at 60°C and later cooled using desiccator without absorbing moisture. In the latter state, the mass of the fibers was measured using analytical balance with accuracy to 10−5g; Mettler AT 261 Delta Range. Fiber diameter is, then, measured using laser microscope (Keyence) on 25 spot across the 10 cm length. This is needed to estimate the lower possible density; since external diameter is considered during measurement and porosity/lumens are not taken into account. And, fibers are cut to different length (powder, 1 mm, 3 mm, 5 mm and 10 mm) to measure the density using gas Pycnometry. The machine used to make fiber powder is Resch RS200 milling machine; each sample is ground for two minutes. The particle sizes of the powder were not measured due to the varying size of fiber emanated from the lignocellulose structure and light-weight dusts thereof. Again, the fibers were dried for 24 hrs at 60°C and then cooled using desiccator for 24 hrs (Abdela, Versteyhe, and Taddese Citation2020), (Abdela et al. Citation2023). To determine density, each fiber samples are weighed using balance with accuracy to 10−5 g. This measured mass value of the fiber is recorded on the machine using the data input interface. Then, the samples are put in to manual Quanta-chrome Helium Gas Pycnometer being in the selected volume cell. Equipment preparation is described here below.
Equipment Preparation and Valuation
Fibers’ density was determined using a Pycnometry, Beckman model 930, in which helium gas at a pressure of 0.5 bar was used as the displacement medium. The system is calibrated using the two standard spheres with known volume of 56.5592 cm3 and 2.145 cm3. In this process and subsequent fiber density measurement, all the three available volume cells are considered; their volume of 147.3974 cm3, 27.216 cm3 and 11.4285 cm3 for the large, small and micro, respectively. Besides, the known volume calibration sphere, glass fiber of know density is used to, preliminarily; check the trends of factors effect on density results. Also, effects of the uniformity of purging duration has been checked by altering the three purging duration (5, 10 and 15 min).
Factors
the effect of using non-uniform purging duration across the runs of a given test has been examined; due to results accuracy and fluctuation, uniform purging across the runs of each test is selected. The principle followed by helium gas Pycnometry, ideal gas law, is also taken into account during this selection. Standard deviation across results of runs of each test and the estimated lower as well as upper limit of density using diameter measurement mentioned in section 2.2(A) above, the following factors have been deployed to scrutinize their effect on density measurement result. Purging duration (5, 10 and 15 min), the volume cell (large, small & micro) has been considered while materials amount in each cells are randomly varied into three levels (Large, medium & small). Different sizes of fibers are considered as shown in section 2.2(A) above.
Result and discussion
Diameter of glass fiber is measured using laser microscope as shown on below; to check the exactitude of diameter and density measurement.
Figure 2. Microscopic image of diameter dimension (a) glass fiber and (b) enset fiber.
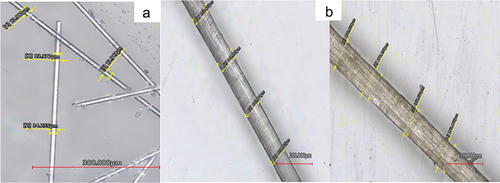
The measured diameter of fiber glass is almost consistent with the datasheet value (14 µm). This state is subsequently used for Enset fiber diameter measurement and in turn derived density estimation. Based on the diameter, cross-sectional area of the assumed cylindrical geometry fiber is calculated; and the measured length and mass values are used to calculate the density of the fiber using equation 1 below; and the result has been compared with data sheet of the glass fiber.
where m, ῤ and l are mass, density and length, respectively.
Then, density of the same material has also been measured using helium gas Pycnometry and compared with the calculated value. And, the trends of factors’ effect on result fluctuation have been portrayed to entail what affects density measurement using gas Pycnometry and reinforces the interpretation of results thereof. Due to results fluctuation and accuracy, uniform purging across the runs of each test is selected while all other factors are considered throughout. Based on this, the same has been done for Enset fiber as shown in part 3.1.
Enset density estimation using fiber diameter
Based on precise diameter measurements, it was recently been possible to describe characteristics of natural fibers; physical and mechanical properties can preliminarily be estimated (Andersons Citation2024; Nishumi Citation1972). Insight into the material density can be obtained preliminarily by conducting diameter measurement, followed by length and weight quantification. The above shows some of single fiber diameter dimensions image measured using Laser Microscope.
The Enset fiber specimen’s diameter is measured at a length of 10 cm to determine the cross-sectional area of the fiber. This calculation is based on specific assumptions: a circular cross-section of the fiber and a cylindrical geometry along its length, with no internal vacancy or lumen. Hence, the smallest diameter measured using laser microscope is 50.1 µm while the average and large fiber diameter are 163.7 µm and 298 µm, respectively. In order to conduct a thorough investigation, 40 fiber samples were carefully selected and subjected to examination. Each of these samples underwent scrutiny of 25 spots, resulting in a total of 1000 spots being measured. Yet, 97.8% of the fibers fall in the range between 70 µm and 240 µm; while 85% of fibers diameter falls between 90 µm − 210 µm. Part of the samples diameter measurement result shown on is tabulated on .
Table 1. Density estimation measured diameter.
The external diameter of the fiber is typically measured without considering the inherent lumen or porosity, leading to an overestimation of the effective cross-section. The shape irregularities also plays a role in the slight over-estimation observed, even though the diameters of the 10 cm long fiber have been carefully measured at 25 specific spot along its length. This ample measurement approach, carried out at intervals of 3 mm, is intended to enhance the precision of the final outcome.
The overestimation of the diameter leads to a subsequent increase in the calculated volume, consequently resulting in an underestimation of the density value. Therefore, the findings derived from this technique can be viewed as the minimum density value expected when conducting measurements with gas Pycnometry. The density, using the above assumptions and Equationequation 1(1)
(1) , is computed and charted on .
Table 2. Density estimation measured diameter.
The expected variation in results is a consequence of the underestimation of density resulting from the overestimated diameter and irregular shape observed in both the cross-section and along the length. This underestimation is a consequence of the inverse and square relationship between density and diameter (Abdela, Buffel, and Desplentere Citation2021). The variation of the density value on the above table above is mainly resulted from internal holes and/or lumen (Abdela, Buffel, and Desplentere Citation2021; Adusumalli et al. Citation2019). For instance, considering lumen/porosity that equates 10% of the total external diameter results in increased density by 23% (new density = 1.23*old density); using the Equationequation 1(1)
(1) . Therefore, it is necessary to employ an alternative method that takes into account the irregular shape and lumen, even though the minimum expected density can still be approximated using this particular approach.
The density value provided on the above table can be regarded as the lowest expected density when employing helium gas Pycnometry and analyzing the effect of variables throughout the experiment. Previous research indicates that the average lumen size in the diameter orientation of Enset fiber is approximately 25.9 µm (Adusumalli et al. Citation2019; Kiflie Citation2019). If we assume that the lumen maintains uniformity throughout its length, a significant reduction in diameter becomes apparent. The Enset’s lumen size, measuring 25.9 µm, accounts for approximately 15% of the average measured diameter of 163.7 µm. Thus, a reduction of the effective diameter by 15% as a result of considering the lumen leads to a 38% increase in density. Typically, the diameter of the lumen varies along its length. However, a considerable amount of the lumen’s space can be occupied by ultra-high purity Helium during the purging stage of the testing process. When none of the lumens contain helium, the worst-case scenario arises, resulting in the highest possible density. Considering the impact of the maximum lumen size on the density of Enset fiber, it is expected that the density will range from 1.203 g/cm3 to 1.66 g/cm3, exhibiting a significant rise of 38%. It is crucial to observe and offer a rationale for any value that deviates significantly from the lower and upper boundaries while conducting the test.
Density estimation using helium gas pycnometry
By comparing the result fluctuation using standard deviation test and taking into consideration the range of expected density values outlined in section 3.1, a uniform purging duration is selected for each test run. Uniform purging durations, fiber length, fiber mass and volume cell size were considered to find fiber density measurement finest factors combination.
Uniform purging duration across the run
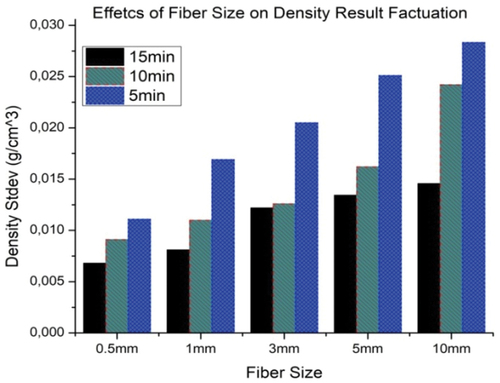
To ensure the infiltration of ultra-high pure Helium gas into the vacancies within the natural fiber (Enset fiber), it is advisable to provide an ample amount of time for gas purging. The diffusion of purged gas within the vacancies of a natural fiber is influenced by the specific characteristics of the fiber, including its nature, the size of porosities, and their orientation. The fluctuation of results considering the density boundary established in section 3.1 has been monitored using three different purging times (5 minutes, 10 minutes, and 15 minutes). The standard deviations of the density measurement results are depicted in below.
Figure 3. Purging duration effect on the fluctuation of density measurement results.
The findings from suggest that extending the purging time to 15 minutes results in a higher level of stability in density measurements, demonstrated by the minimal standard deviation across multiple runs. However, it remains challenging to ascertain whether reducing variation ultimately leads to the desired level of accuracy in the results. This is due to the fact that factors such as the types of volume cells chosen, the quantity of material contained within them, and the size of the fibers also play a significant role in influencing the density outcome. The density range portrayed above is used to filter some of the values that are far away from the range (between 1.203 g/cm3 and 1.66 g/cm3). Test runs with results falling far outside the margin are used in judging the scenarios.
Longer purging duration is thought to be responsible for the reduction in result variation, as it has the ability to fill each porosity/lumen depending on the size of the fiber under test (Abdela, Buffel, and Desplentere Citation2021; Herrmannsdörfer and Klapötke Citation2021; Saadati et al. Citation2019). This can also show the accuracy of the result where the Helium gas with known density value fills almost every vacant space in the fiber and the remaining volume become only of the materials’ (fibers’) (Herrmannsdörfer and Klapötke Citation2021; Saadati et al. Citation2019). This volume exactitude depicts accuracy of density estimation result since the other factor, materials mass, are measured before the test and recorded on the machine. Yet, purging duration isn’t the only factor that affects the result; other factors have to be considered.
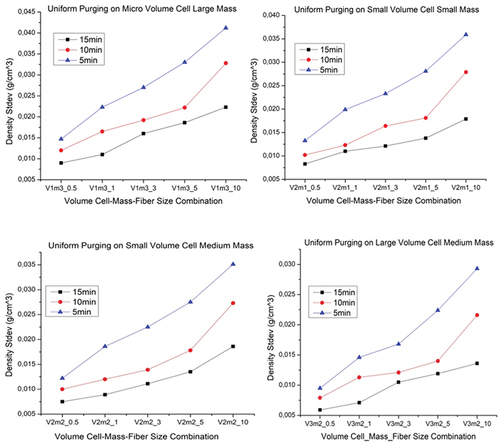
Volume cell and materials’ amount in the cell
The variations in characteristics among identical Enset fibers require the consideration of an adequate quantity of material. So, the accuracy and precision of the outcomes depend not only on the purging duration but also on selecting a volume cell capable of accommodating the diverse properties and quantities of material within the cell.
In , the x-coordinate represents the volume (V) and mass (m). The subscripts 1, 2, and 3 after V and M indicate the volume cell type and the amount of material in each selected cell, respectively. The variations between results decrease for larger standard volume cell; the larger the volume cell the smaller is the variation. The incorporation of a substantial amount of material enables the accommodation of variations among the fibers of the same material, thereby opening up numerous possibilities.
Figure 4. Effects of size of volume cell and amount of material in it.
Due to their inherent characteristics, individual natural fibers properties variation; the consideration of a large number of samples to obtain an illustrative representation of their attribute is required (Abdela, Versteyhe, and Taddese Citation2020; Alves Fidelis et al. Citation2013).
The fluctuation and accuracy of results are influenced by the varying amounts of material filled in the selected cell. Increasing the material in the selected cell enhances the notion of accommodating a diverse range of fibers. It is, also, crucial to conduct rapid weighing after desiccation so as to prevent moisture absorption during the measurement process; this approach ensures that the weighing is completed before noteworthy any moisture absorption occurs, thereby yielding an accurate net weight of the fiber material. And, arbitrary three level mass for each cell are considered and the fluctuation of the result is shown above on . The amount of material in a cell makes the result more stable. This adds to the minimization of result fluctuation achieved by larger uniform purging time.
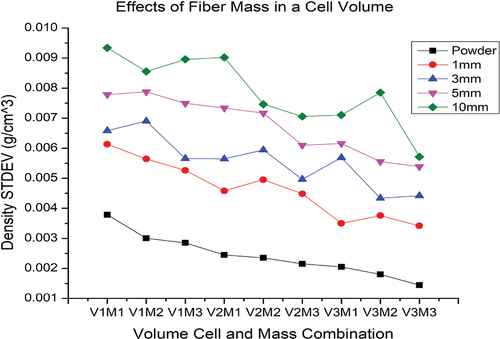
Fiber size
Longer fiber sizes increases the possibilities of concealed lumen in the fiber (Adusumalli et al. Citation2019; Nguyen et al. Citation2019). Hence, unfilled vacancy in the fiber is expected during purging, venting and subsequent density estimation process using helium gas Pycnometry. indicates the relationship between fiber size and resulting density result constancy.
Figure 5. Effects of fiber length on result fluctuation.
The comparison depicted in pertains to a small volume cell containing a substantial amount of material. This particular combination has been identified as one of the most favorable options due to its minimal result fluctuation and the majority of density values falling within the pre-estimated range discussed in section 3.1. Similar findings have been observed for a cell with a larger volume. However, the larger cell requires a relatively greater quantity of material due to its size, despite exhibiting comparable fluctuations in results to the smaller cell, which contains a larger amount of material.
Fluctuations in the results are amplified as the fiber size increases, particularly when the purging time is shorter. This is due to the fact that shorter fibers have their lumen or porosity compromised, making them more susceptible to exposure to the purging gas. Instead, longer purging times enable the porosity to be filled more effectively, resulting in lower fluctuations. The larger size of the fiber may contribute to increased result fluctuation due to the reduction in material mass within the volume cell. Thus, this compromises the ability to accommodate a sufficient amount of materials which affects the result fluctuation and in turn accuracy. Lumen size that is difficult to predict and which varies from fiber to fiber, and among different fibers of the same material type also affects the result (Abdela, Buffel, and Desplentere Citation2021; Adusumalli et al. Citation2019). Hence, the shorter the fibers size the higher in the accuracy of the fiber density result. Based on specific application and nature of the practical uses, different size of material can be considered during density measurement using gas Pycnometry.
Miscellaneous considerations
The results and subsequent discussion indicate that a longer purging time, which allows for ample penetration of the substance into the fiber’s porous structure, coupled with the presence of small and large cells capable of accommodating a significant amount of material, as well as a smaller fiber size that aids in gas penetration by breaking the lumen, are key factors in ensuring a reduced fluctuation in the density result. And, this guarantees estimation of the accurate volume occupied by the material which in turn enhances the accuracy of density result. Besides the fluctuations, the values are checked using the range established above on the in section 3.1.
While considering all factors above, the operating principle of helium gas Pycnometer and fibers’ nature should be considered during density estimation and result interpretation. First, Quanta-chrome Helium Gas Pycnometer follows the principle of ideal gas law, Pa (Vc-Vs) = naRTa. Driving this equation yields the principle of identifying the correct specimen volume shown on Equationequation (2)(2)
(2) below.
Besides controlling the purging duration, volume cell type, amount of material and fiber size, P1 and P2 has to be kept nearly similar during measurement since the volume of the sample is derived from the pressure drop during measurement. This helps to get the correct estimated sample volume, difference between reference and cell volume. Since fibers’ weight is manually measured and recorded on the user interface of system, accurate volume yields accurate density value.
Likewise, the lignocellulose structure of the fiber can aid density estimation result accuracy and interpretation. Enset is characterized by high amount of cellulose (69.5%) and low lignin (5.7%) content (Kiflie Citation2019; Teli and Terega Citation2017). Henceforth, density of the entire fiber material is mainly affected by the cellulose for it incorporates about 70% of the material; the cellulose portion can be even higher. The result for treated fiber is almost showed comparable result with the raw Enset fiber, however, further studies are required for different fiber treatment types. In the case of higher percentage of lignin, density value can be shadowed by other non-cellulose structure in it.
The Quanta-Chrome Gas Pycnometer machine offers a feature that enables the removal of density readings on the machine monitor that fall outside the anticipated range. Afterwards, the machine performs the average of the remaining runs in order to determine the density value. The fluctuation in results can be reduced by considering a combination of factors that primarily address the nature of natural fiber, including shape irregularity, internal hole, and variation between fibers. By taking these factors into account before calculating the individual and mean density along with the standard deviation, the impact of fluctuations can be minimized. It, also, good to calculate the density to find the lower and upper limit to avoid some of the strange results even on the machine using the procedure mentioned in section 3.1.
Enset fiber density
Using the optimum factors combination and miscellaneous considerations the density of Enset fiber is measured using helium gas Pycnometry. The result for the three sizes of fiber measured using small volume cell and large amount of material is shown on .
Figure 6. Enset density measured using gas pycnometry.
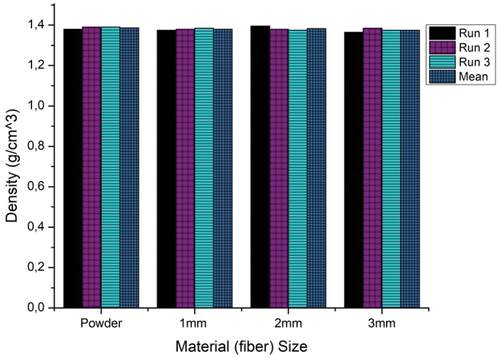
illustrates that the density of Enset fiber is estimated to be 1.38 ± 0.01 g/cm3. The employed optimum combination of factors results in a minimized variation between different runs of the same experiment.
Particularly, the fiber size below 3 mm gives constant result. The results obtained are also within the expected range. This measurement is vital for calculating the cross-sectional area of fibers to characterize the tensile properties of single fibers. These properties are, in turn, essential for conducting diverse micromechanical analyses and mechanical modeling of the materials and their composites (Abdela, Versteyhe, and Taddese Citation2020). It can also be used to estimate composite weight and to evaluate fiber content for property predictions in fiber reinforced composites (Abdela Citation2019; Abdela et al. Citation2023; Abdela, Buffel, and Desplentere Citation2021; Gelgelu et al. Citation2023).
Conclusions
From all the aforementioned results, the following conclusion can be drawn. Based on direct density measurement the minimum and maximum density expected during the gas Pycnometry test are expected to fall between 1.203 g/cm3 and 1.66 g/cm3. By prolonging the Purging duration, the fluctuation in results is diminished, thereby augmenting both precision and accuracy. This improvement can be attributed to the ability of pure helium gas to infiltrate the lumen and porosity of the fiber, enhancing measurement exactitude. Again, larger volume cell and larger mass of fiber in each volume cell increases the precision and accuracy of the results due to accommodation of variety of the same material for the test. The small size volume cell with maximum possible amount of material gives better result that can be comparable with larger volume; the small size volume cell is also suggested due to the relatively smaller amount of material it requires. The need to consider the principle followed by the machine and the lignocellulose structure of the fiber to interpret the test result is also important. Furthermore, this measurement can be utilized to retroactively calculate the cross-sectional area of fibers, thereby enabling the characterization of the tensile properties of individual fibers. These properties play a vital role in conducting diverse micromechanical analyses and mechanical modeling of the materials and their composites. Subsequent research endeavors could potentially focus on investigating the influence of treated fiber and comprehensively depicting the effects of the lignocellulosic structure.
Consent
All the Authors and coauthors agreed to submit this article to this Journal.
Research hightlights
Core finding
Fiber density can be used to estimate the weight of composites and to evaluate the fiber content for predicting properties in fiber (Synthetic or Natural) reinforced composites. It is also helps during micromechanical analysis and mechanical modeling of material and their composites. Yet, natural fibers don’t have fixed density value given on datasheet and their density measurement is affected by various factors including their lignocellulose structure. In this study, comparison of five standard density estimation method have been made and Helium gas Pycnometry is selected mainly because of the natural fibers’ attributes (hydrophilicity, lignocellulose structure the fiber, lumen and related internal cavity). Upon choosing a method based on previous findings, the accuracy and precision of the selected method are validated by utilizing a synthetic fiber with a known density value from the manufacturer’s datasheet. Proving that the estimated density on the synthetic fiber is nearly consistent with the value on datasheet; factors affecting the fluctuation of the result have been studied. Different combination of these factors (volume cell, mass of sample fiber, fiber size, purging duration; purging uniformity) in collaboration with related natural fiber characteristics is used to finds major factors affecting the estimation accuracy and precision. The examination of Enset fiber density has been carried out by utilizing the optimal combination of factors that were identified. A number of fundamental findings from this study can be summarized as follows.
Result discrepancy and fluctuation are reduced, leading to improved accuracy and precision, when using a larger volume cell, a greater mass of fiber in a cell, and smaller-sized fibers. Additionally, the results obtained from the smaller volume cell exhibited a similar outcome to that of the larger volume cell, though with a slightly higher level of fluctuation.
The density of natural fiber, determined through fiber diameter measurement using a microscope in conjunction with measured mass and length, was observed to be lower than the density obtained through Helium gas Pycnometry. This discrepancy can be attributed to the fact that the microscope-based diameter measurement only accounts for the external diameter. The calculated density derived from the microscope method was 1.203 g/cm3, whereas the density estimated through Pycnometry was 1.38 g/cm3.
The fluctuation, accuracy, and precision of the results are greatly influenced by the duration of purging and the size of the fibers. By increasing the purging duration, the fluctuation of the results is reduced, and the precision and accuracy are enhanced. This is because the extended duration allows the pure helium gas to infiltrate the lumen and porosity of the fiber, creating a more consistent environment.
Using smaller fibers further improves the accuracy of the results. This is because the smaller fibers break the lumen, allowing the gas with a known density to occupy any empty spaces. However, it is important to consider the practical application for which the density is required when determining the appropriate fiber size.
Natural fibers exhibit variations in their lignocellulose structure and internal cavity. Consequently, it is crucial to take into account both the principle adhered to by the machine, namely the ideal gas law, and the lignocellulose structure of the fiber in order to accurately interpret the test results.
Finally, measured density of Enset using optimum combination of parameters the best combination of factors is 1.38 ± 0.01 g/cm3.
Novelty
Enset fiber was predominantly examined in this study, utilizing the optimal combination of factors investigated within the same research; it’s density with such a consideration in novel this material. Lists of the novel contribution in the research can be summarized as follows.
Often, the density values obtained through the utilization of Helium Gas Pycnometry during the measurement of natural substances can exhibit significant extremes, either being very high or very low, owing to diverse factors. These extreme values, when encountered, have an impact on the overall estimated density value. This study established a methodology for determining the uppermost and lowermost possible density values. This enables researchers to make informed decisions regarding which value to adopt, as well as prompting them to reassess the measurement process and procedure whenever a majority of the values deviate from the expected range.
This study examined the optimal combination of variables influencing fiber density measurement and their respective impacts, as well as the most effective combination of variables for measuring the density of natural fibers through helium gas Pycnometry, which may be applicable to other natural fibers with similar context.
The research has additionally identified a potential method for integrating the fiber lumen notion in density estimation to enhance result accuracy and precision. Conversely, this approach can also be applied to retroactively determine the initial lumen size of a newly studied natural fiber by utilizing the optimal combination of Pycnometry factors discussed earlier.
By incorporating supplementary methodology, including the measurement of diameter, weight, and length, followed by a subsequent analysis, the possibility to reinforce density estimation result has been stated.
The impact of the lignocellulose structure has been taken into account in order to optimize the measurement process using the Pycnometer technique for natural fibers that possess lumen and exhibit hydrophilic properties.
The examination of fiber size effects, taking into account the lumen issue, has been conducted. This aspect holds immense significance when it comes to the practical implementation of the outcomes in real-world scenarios involving natural fibers and their composites.
An investigation has been conducted to examine the impact of purging pressure, time, and consistency level. And, the effects of employing all three available cells for volume measurement have been thoroughly examined, and the resulting effects have been duly characterized.
Disclosure statement
No potential conflict of interest was reported by the author(s).
Additional information
Funding
References
- 3 Density Determination by Pycnometer Theory. 2023. V. 1–5.
- Abdela, A. 2019. “Flexural Properties of Unidirectional Enset Fiber Reinforced Epoxy Composite for Automotive Interior Application.” Chemistry of Materials Research 11 (8): 7–15. https://doi.org/10.7176/cmr/11-8-02.
- Abdela, A., B. Buffel, and F. Desplentere. 2021. “Determinants of Single Natural Fiber Stiffness Estimation Accuracy and Enhancement Possibilities.” In Proceedings of the International Conference on Industrial Engineering and Operations Management 1495–1502. https://ieomsociety.org/proceedings/2021rome/541.pdf.
- Abdela, A., M. Vandaele, S. Haenen, B. Buffel, B. Sirahbizu, and F. Desplentere. 2023. “Moisture Absorption Characteristics and Subsequent Mechanical Property Loss of Enset – PLA Composites.” Journal of Composites Science 7 (9): 1–12. https://doi.org/10.3390/jcs7090382.
- Abdela, A., M. Versteyhe, and F. Taddese. 2020. “Characterization of Single Enset Fiber Tensile Properties Using Optimal Experimental Design and Digital Image Correlation Technique.” International Journal of Mechanical Engineering and Applications 8 (1): 8. https://doi.org/10.11648/j.ijmea.20200801.12.
- Adusumalli, R. B., K. C. Venkateshan, C. Kunchi, and S. R. Vadlamani. 2019. “Tensile Testing of Single Fibres.” Procedia Structural Integrity 14 (2018): 150–157. https://doi.org/10.1016/j.prostr.2019.05.020.
- Agrawal, S. A. 2021. “Simplified Measurement of Density of Irregular Shaped Composites Material Using Archimedes Principle by Mixing Two Fluids Having Different Densities.” International Journal of Engineering Research & Technology 8 (3): 1005–1009 [Online]. www.irjet.net.
- AGY. 2022. “S-2 Glass High Performance Fiber.” https://www.agy.com/wp-content/uploads/2022/03/AGY_AdvMatBro_r8.pdf.
- Altaş, S., and H. Kadoǧlu. 2006. “Determining Fibre Properties and Linear Density Effect on Cotton Yarn Hairiness in Ring Spinning.” Fibers & Textiles in Eastern Europe 14 (3): 48–57.
- Alves Fidelis, M. E., T. V. C. Pereira, O. D. F. M. Gomes, F. De Andrade Silva, and R. D. Toledo Filho. 2013. “The Effect of Fiber Morphology on the Tensile Strength of Natural Fibers.” Journal of Materials Research and Technology 2 (2): 149–157. https://doi.org/10.1016/j.jmrt.2013.02.003.
- Andersons, J. 2024. “Tensile Strength of Single Fibers: Test Methods and Data Analysis.” 2:1.
- Arias-Castro, E., D. Mason, and B. Pelletier. 2016. “On the Estimation of the Gradient Lines of a Density and the Consistency of the Mean-Shift Algorithm.” Journal of Machine Learning Research 17:1–28. https://jmlr.org/papers/volume17/ariascastro16a/ariascastro16a.pdf.
- Borrell, J. S., M. K. Biswas, M. Goodwin, G. Blomme, T. Schwarzacher, J. S. Heslop-Harrison, A. M. Wendawek, et al. 2019. “Enset in Ethiopia: A Poorly Characterized but Resilient Starch Staple.” Annals of Botany 123 (5): 747–766. https://doi.org/10.1093/aob/mcy214.
- Borrell, J. S., M. Goodwin, G. Blomme, K. Jacobsen, A. M. Wendawek, D. Gashu, E. Lulekal, et al. 2020. “Enset-Based Agricultural Systems in Ethiopia: A Systematic Review of Production Trends, Agronomy, Processing and the Wider Food Security Applications of a Neglected Banana Relative.” Plants People Planet 2 (3): 212–228. https://doi.org/10.1002/ppp3.10084.
- Ebanda, F. B., and N. Boris. 2019. “Review Article a Literature Review on Natural Fibers, its Properties and Influence of Water Absorption on Mechanical a Literature Review on Natural Fibers, its Properties and Influence of Water Absorption on Mechanical Properties of Composites.” International Journal of Recent Advances in Multidisciplinary Research 6 (4): 4790–4797. https://ijramr.com/issue/literature-review-natural-fibers-its-properties-and-influence-water-absorption-mechanical.
- Eren, H. 2017. “Density Measurement.” Measurement, Instrumentation, and Sensors Handbook: Spatial, Mechanical, Thermal, and Radiation Measurement, Second Edition: 45–1–45–18. https://doi.org/10.1201/b15474.
- Fiber, M. 2020. “Sika ® Fibermesh ® -650.” 2–4. https://usa.sika.com/dam/dms/us01/o/sika_fibermesh_-650.pdf.
- Gelgelu, A. A., Vandaele M., Haenen S., Buffel B., Desplentere F., and Sirahbizu B. 2023. Moisture Absorption Characteristics and Subsequent Mechanical Properties Loss of Enset-PLA Composites. https://doi.org/10.20944/preprints202308.0494.v1.
- Genovese, C. R., M. Perone-Pacifico, I. Verdinelli, and L. Wasserman. 2009. “On the Path Density of a Gradient Field.” Annals of Statistics 37 (6A): 3236–3271. https://doi.org/10.1214/08-AOS671.
- Herrmannsdörfer, D., and T. M. Klapötke. 2021. “High-Precision Density Measurements of Energetic Materials for Quality Assessment.” Propellants, Explosives, Pyrotechnics 46 (3): 413–427. https://doi.org/10.1002/prep.202000272.
- Karimah, A., M. R. Ridho, S. S. Munawar, D. S. Adi, R. Damayanti, B. Subiyanto, et al. 2021. “A Review on Natural Fibers for Development of Eco-Friendly Bio-Composite: Characteristics, and Utilizations.” Journal of Materials Research and Technology 13:2442–2458. https://doi.org/10.1016/j.jmrt.2021.06.014.
- Kiflie, Z. 2019. “Lignocellulose Chemical and Morphological Analysis of Enset (Ensete).” Lignocellulose 5 (2): 139–151. [Online]. https://www.researchgate.net/publication/334284412.
- Le Gall, M., P. Davies, N. Martin, and C. Baley. 2018. “Recommended Flax Fibre Density Values for Composite Property Predictions.” Industrial Crops and Products 114 (April): 52–58. https://doi.org/10.1016/j.indcrop.2018.01.065.
- Nguyen, H. G. T., J. C. Horn, M. Bleakney, D. W. Siderius, and L. Espinal. 2019. “Understanding Material Characteristics Through Signature Traits from Helium Pycnometry.” Langmuir 35 (6): 2115–2122. https://doi.org/10.1021/acs.langmuir.8b03731.
- Nishumi, S. 1972. “Properties of Fibers and Fabrics from Them.” Sen-Ito Kogyo 5 (5): 271–276. https://doi.org/10.2115/fiber1968.5.271.
- Peters, W. R., and R. Katz. 1962. “Using a Density Gradient Column to Determine Wheat Density.” Cereal Chemistry 39 (6): 487–494.
- Preview, T. S. 2019. “International standard the Density of Non-Cellular Plastics — Density Gradient Column Method iteh standard iteh standard preview.” 2019.
- Rude, T. J., L. H. Strait, and L. A. Ruhala. 2000. “Measurement of Fiber Density by Helium Pycnometry.” Journal of Composite Materials 34 (22): 1948–1958. https://doi.org/10.1106/NUYP-PARA-RA5R-7NUE.
- Saadati, Y., J. F. Chatelain, G. Lebrun, and Y. Beauchamp. 2019. “Comparison of Density Measurement Methods for Unidirectional Flax-Epoxy Polymer Composites.” European Conference On Multifunctional Structures: 1–6. https://doi.org/10.23967/emus.2019.014.
- Sanborn, B., and T. Weerasooriya. 2015. “Tensile Properties of Dyneema SK76 Single Fibers at Multiple Loading Rates Using a Direct Gripping Method.” Conference Proceedings of the Society for Experimental Mechanics Series 65 (Volume 1): 1–4. https://doi.org/10.1007/978-3-319-06995-1_1.
- Sander, L. C., and L. T. Sniegoski. 2017. “Determination of Liquid Density.” Journal of Research of the National Institute of Standards and Technology 122 (8): 6028. https://doi.org/10.6028/jres.122.008.
- Tamire, C. 2015. “Role of Enset (Ensete Ventricosum (Welw.) Cheesman) in Soil Rehabilitation in Different Agro-Ecological Zones of Hadiya, Southern Ethiopia.” American Journal of Environmental Protection 4 (6): 285. https://doi.org/10.11648/j.ajep.20150406.14.
- Teli, M. D., and J. M. Terega. 2017. “Chemical, Physical and Thermal Characterization of Ensete Ventricosum Plant Fibre.” International Journal of Engineering Research & Technology 4 (12): 67–75.