
 ?Mathematical formulae have been encoded as MathML and are displayed in this HTML version using MathJax in order to improve their display. Uncheck the box to turn MathJax off. This feature requires Javascript. Click on a formula to zoom.
ABSTRACT
Natural fiber insulation materials can offer a sustainable alternative to mineral and petrochemical-based insulation materials when suitable raw materials and appropriate production processes are considered. Within the scope of our research, natural fibers like cotton, flax, hemp, wool, and coir, as well as regenerated cellulose fiber, were processed into insulation materials and examined concerning their thermal conductivity. We demonstrate that simple test methods for fiber fineness measurement with air-flow methods such as Airflow and Shirley can facilitate incoming inspection and process monitoring for insulation manufacturers. Based on these measurements, a simple model was developed to estimate the thermal conductivity based on the fineness measurements of the raw materials. The model developed on the natural fibers for lower densities was tested on a glass fiber insulation material to check its suitability. The slight deviations achieved between the experiment and the calculation verify the practicability of the concept.
摘要
当考虑到合适的原材料和适当的生产工艺时,天然纤维绝缘材料可以为矿物和石化绝缘材料提供可持续的替代品. 在我们的研究范围内,棉花、亚麻、大麻、羊毛和椰子等天然纤维以及再生纤维素纤维被加工成隔热材料,并对其导热性进行了检测. 我们证明,用气流法(如Airflow和Shirley)测量纤维细度的简单测试方法可以方便绝缘制造商的进货检查和过程监控. 在这些测量的基础上,开发了一个简单的模型,根据原材料的细度测量来估计热导率。在玻璃纤维绝缘材料上测试了在天然纤维上开发的低密度模型,以检查其适用性. 实验与计算之间的微小偏差验证了该概念的实用性.
Introduction
Insulation materials made from renewable raw materials have arrived on the market after years of intensive research (see, among others, Tye et al. (Citation1974); Day and Wiles (Citation1978); Symons et al. (Citation1995); Murphy, Behring, and Wieland (Citation1997, Citation1999); Ye et al. (Citation2006); Kymäläinen and Sjöberg (Citation2008); Zach et al. (Citation2013); Vaitkus et al. (Citation2014); Hurtado et al. (Citation2016); Kosiński et al. (Citation2018); Tsapko et al. (Citation2020)). Hung Anh and Pásztory (Citation2021) identify key factors affecting thermal conductivity, highlighting moisture content, temperature gradient, and insulation density, and also consider the impact of air-flow velocity, thickness, pressure, and aging. Ghosh et al. (Citation2016) emphasize the role of natural fiber insulation materials in mitigating building overheating during warmer summers due to their high specific heat storage capacity. Amtmann et al. (Citation2014) emphasize insulation’s role in energy-efficient construction in Austria, which is crucial for new buildings and renovations. They note that proper insulation and modernizing windows in older buildings can reduce heating costs by up to 80%. Renewable raw material superstructures offer significant environmental benefits over traditional insulation materials. On average, the resource demand for variants with insulation products made from renewable raw materials is lower than those with conventional insulation materials (Amtmann et al. Citation2014). A comprehensive overview of insulation materials made from renewable resources is shown in the study (FNR Citation2019). A 2020 survey by the FNR on the German insulation market revealed an average 9% share for renewable raw materials, up by 2% since 2011. Both manufacturers and traders anticipate a continuing positive sales trend (FNR Citation2021). Reinhardt et al. (Citation2019) highlighted the environmental advantages of recycling insulation materials, particularly synthetic and mineral types, over conventional disposal methods in their study. Their findings suggest recycling, especially of renewable materials like wood fiber, hemp, and jute, significantly reduces environmental impact, particularly when these materials are reused in cement production as a sustainable alternative to hard coal.
Research in insulating materials made of natural fibers also deals with questions of modeling the properties and manufacturing. El-Sawalhi et al. (Citation2016) discovered that the thermal efficiency of hemp fiber insulation is significantly affected by the fibers’ arrangement and the manufacturing process. Factors like material density, fiber orientation, and network structure also play crucial roles. Andrä et al. (Citation2023) reveal significant links between the thermal conductivities of wood fiber-based insulation products and their microstructural characteristics, identified through quantitative image analysis and numerical simulations. Domínguez-Muñoz et al. (Citation2010) devised a method to estimate the thermal conductivity of insulation materials without direct measurements, primarily using the materials’ density. This approach allows the prediction of various thermal conductivities for different raw materials. In a case study, the thermal conductivity for the insulation group “Natural insulation” (wool, cotton, cellulose) is given as follows: Min = 0.0307 and Max = 0.0463 W/(mk).
Our research aims to develop an alternative to the complex method of measuring the thermal conductivity of natural fiber insulation materials. This method will be based on measuring the fineness of fibers as simply as possible. We plan to predict thermal conductivity using simple measurements like Airflow and Shirley and examine the effect of product density on this property. The goal is to create models that easily predict thermal conductivity, suggesting that fiber fineness could be crucial for improving insulation efficiency. In this context of our research, the following questions arose:
Is it possible to use appropriate models to predict the thermal conductivity of natural fiber insulation materials based on simple test methods for measuring the fiber fineness using an air stream through a fiber assembly?
Can a simple method be developed that allows manufacturers of insulation materials to conduct an incoming goods inspection to quickly predict the end product’s thermal conductivity of fibers of different finenesses?
Materials & method
Materials used
The thermal insulation samples (see ) were processed with a roller carding device (Anton Guillot, Aachen, DE; working width: 30 cm; flexible card clothing). A broad selection of natural fibers and one regenerated cellulose fiber were used to derive the most general possible model for the thermal conductivity of natural fiber insulation materials. The finest fiber was cotton, and the coarsest fiber bundle was coir. Furthermore, flax and hemp fiber bundles, wool as an animal natural fiber, and Lyocell as a regenerated cellulose fiber were integrated into the test series. The hemp samples (disordered hemp: 2c, 3c, 4c, V4, and V5) from total fiber line extraction (see Müssig et al. Citation2020) differ only in retting time and, consequently, in fiber bundle fineness. The flax samples (type G, type E, and IP) represent flax tow from the traditional processing line and differ in retting time and fineness of the fiber bundles (see ).
Figure 1. Process for manufacturing of insulation materials with a carding machine. The fibers in the upper part of the picture, from cotton to hemp, could all be processed with the carding machine, but the coir fiber bundles could not be processed with the carding machine. SEM images illustrate the diameter and surfaces of the fibers and fiber bundles.
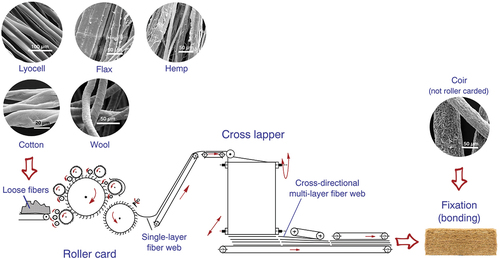
A mixture of water, boron salt (borax; sodium tetraborate decahydrate (Na2B4O7 ∙ 10 H2O), and starch (potato starch in powder form) was used. The starch serves as a binder for the fibers, while the boron salt has a fungicidal and fire-retardant function.
Moisture content & theoretical density
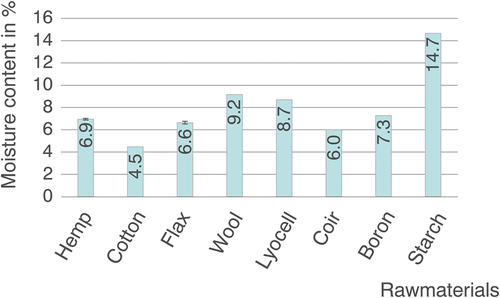
The moisture content of the fibers, boron salt, and starch was determined and used to calculate the necessary raw material mass. The moisture content of the samples was determined after kiln drying at 105°C for 3 hours (forced air oven, Memmert, Schwabach, DE). The results are shown in . Due to slight deviations, all hemp variants were presented as a mean value; the same applies to the flax variant.
Figure 2. The moisture content of the raw materials (fibers after carding) after kiln drying. All hemp and flax samples are presented as a mean value with standard deviation as error bars.
Manufacturing the insulation products
The carding process (see ) involves orienting and cleaning the fibers and fiber bundles. The process also refines and shortens fiber bundles. The goal was to achieve approximately 500 g per insulating material, including additives, requiring around 400 g of carded fibers. Important was to identify the optimal mixture of water, boron salt (borax; sodium tetraborate decahydrate (Na2B4O7 ∙ 10 H2O); as fire protection and against insects; see (Day and Wiles Citation1978), and starch (potato starch in powder form). After testing different ratios of water, boron salt, and starch, a mixture of 100 mL water, 12 g boron salt, and 10 g starch per 100 g of fibers was optimal. Sample manufacturing involved creating six layers of fibers using roller carding, cutting the webs into 25 cm x 50 cm sections, and assembling them with interlayer adhesion via solution spraying in a wooden box measuring 50.5 cm x 50.5 cm. The samples were then compressed to a thickness of 6 cm using a cardboard box covered with plastic foil. Each sample was left to dry in the lab environment for one day. This procedure has proven highly effective, as it has been possible to produce samples with more minor deviations in the final mass; differences in mass between the samples were around 3%.
Fibers – physical testing
Airflow
Coarse fibers have a small surface area and, consequently, high permeability compared to fine fibers with the same sample mass; the values measured in the air-flow are high. The opposite is true for fine fibers with a large surface area and low permeability. The samples were conditioned at 20 °C and 65% relative humidity for 24 hours; 3 specimens with a mass of 2.5 g were weighed (Laboratory scale; accuracy 0.01 g). The Airflow devices for wool work with a differential pressure of approximately 18 mbar and a flow rate of 4 to 24 l/min. The Airflow device (WIRA Fiber Fineness Meter instrument, Wira Instrumentation Ltd, Bradford, UK) measures the flow rate at constant negative pressure and was calibrated with IWTO wool fiber standards at a pressure of 180 mm water column and a sample mass of 2.5 g (Müssig Citation2001). After calibration, the fiber samples were measured at a pressure of 120 mm water column and a sample mass of 2.5 g; each specimen was measured twice. The mean, coefficient of variation, and standard deviation were calculated. The fibers and fiber bundles were measured before and after carding.
Shirley
For the Shirley measurement of fibers and fiber bundles, the device IIC Fineness & Maturity Tester (FMT), Shirley Developments, Ltd., Stockport, UK, was used. The FMT device measures the pressure drop at a constant flow rate. In the sample compression stage PL (Low Pressure), a flow rate of 4 l/min is used. In the higher sample compression stage PH (High Pressure), a flow rate of 1 l/min is set. The instrument is calibrated by adjusting the flow rate while measuring two cotton samples (internal calibration samples) (Müssig Citation2001). The research on bast fibers has shown that the FMT (Fiber Morphology Test) is very well suited for investigating the fineness of hemp fiber bundles (Musio, Müssig, and Amaducci Citation2018; Müssig Citation2001). Any remaining trash, dust, and other non-fibrous components were removed. The specimens were conditioned at 20 °C and 65% relative humidity for 24 hours. Two specimens with a mass of 4 g each were weighed from the conditioned sample (scale; accuracy 0.01 g). Each specimen was measured twice. The mean, coefficient of variation, and standard deviation were calculated. The results are reported as dimensionless FMT-Shirley PL and PH values.
Insulation products – measuring thermal conductivity
The thermal conductivity was measured using a ThermoProof device (V2.00, Mergenthaler Apparatebau, Ulm, DE), a plate apparatus designed to assess heat-insulating materials’ thermal conductivity, following the standard (ISO 8302 Citation1991). A one-dimensional, steady-state heat flow through the specimen, dependent on its material properties, was induced by a temperature difference (ΔT = T2 - T1). The bottom surface is the cold plate at a temperature of 5 °C, and the top surface is the hot plate at 15 °C. The tolerance temperature “cold” was 0.02 °C, the tolerance temperature “warm” was 0.01 °C, and the measuring time was 60 minutes. The measuring chamber walls were heated, ensuring an equivalent temperature gradient within the specimen, facilitating a strictly one-dimensional heat flow. The measuring chamber is housed within a cooling box, capable of maintaining temperatures below room temperature. The cooling box walls maintain a temperature of approximately −18 °C and prevent humidity accumulation, ensuring dry specimens remain dry during the measurement. This device does not require reference samples for calibration. The samples were dried in the oven at 105 °C for 2 hours and laid between the parallel plates in the measuring chamber. The mass of the hot plate (10 kg) was used to compress the samples to the desired thickness defined by spacers along the sample’s periphery. The calculation of the thermal conductivity λ was done as follows (Eq. 1):
where is the heat flow through the meter area of the guarded hot plate, A is the area, l is the thickness of the sample, and ΔT is the average temperature difference.
Results & discussion
Fibers – physical testing
Airflow
The Airflow measurements highlighted the method’s suitability to test different natural fibers and its ability to characterize processing effects, with results presented as mean values and 95% confidence intervals in . The cotton fibers were too fine to be measured before and after carding. The coir fiber bundles were too coarse to be measured; the same applies to the unretted hemp variant V5. When objects are present as individual fibers, such as lyocell or wool, the results show that the fibers do not undergo any statistically significant refinement during processing. In a slight trend, the carded fibers of Lyocell and Wool showed slightly lower Airflow values, possibly due to the removal of coarse components and the opening of agglomerated fiber clusters. Samples present as fiber bundles, such as the hemp and flax samples, are refined during roller carding, and the fiber bundles are separated into finer fiber bundles. Statistically, all bast fiber variants differ significantly in terms of the differences before and after the carding process. There is no overlap between the 95% confidence interval as error bars, and according to Cumming et al. (Citation2007), the differences are significant.
Figure 3. Airflow values of the tested samples before and after roller carding (mean values and 95% confidence interval as error bar).
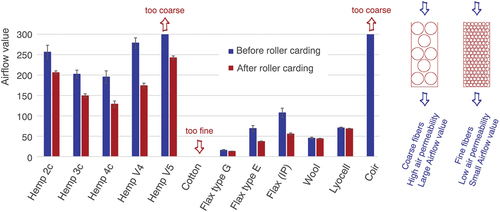
As the airflow results show, processing the bast fiber bundles leads to a change in diameter. Our investigations also considered the influence of processing on the change in length. The coir fiber bundles were not carded. The length of the fiber bundles could not be measured with the Almeter due to the large diameters. A length measurement was carried out using a ruler for orientation purposes, and the average was approximately 60 mm. For the other fibers and fiber bundles, cross-sectional length values (mean = ML(Q)) determined with the Almeter (compare Müssig Citation2001) are used as an indication of the lengths. While the mean lengths of the cotton (22 mm), wool (47 mm), and Lyocell fibers (60 mm) hardly changed in length during processing, the flax and hemp fiber bundles were simultaneously refined and shortened. For orientation purposes, the change in length due to the carding process is given for the unretted hemp variant 2c and the retted hemp variant 4c:
2c before roller carding: ML(Q) = 73 mm
2c after roller carding: ML(Q) = 43 mm
4c before roller carding: ML(Q) = 63 mm
4c after roller carding: ML(Q) = 36 mm
After carding, the other bast fiber bundles were, on average, between approx. 40 and 50 mm in length.
Shirley
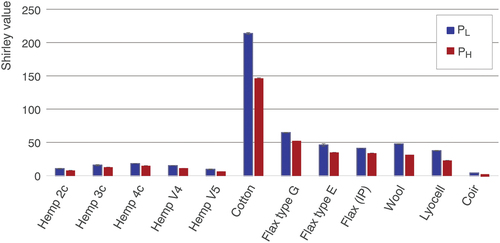
With the IIC Fineness & Maturity Tester (FMT), all fibers, including cotton fibers and coir fiber bundles, could be measured. Similar to the airflow results, there was no significant change in fiber fineness in the variants where only single fibers were present. The carded fibers tended to show slightly higher Shirley data, possibly due to removing dirt or coarse components; however, the differences were not significant (compare ). The flax and hemp fiber bundles were refined through the carding process and showed higher Shirley values than the not-carded samples (a high Shirley value represents finer fibers, in contrast to the Airflow value). Since the coir fiber bundles were not carded, the fineness value for these fiber bundles remained the same. shows the PH and PL values of the fiber variants used for the insulation materials.
Figure 4. Shirley PL and PH values of the tested samples after roller carding, except for the coir fiber bundles, which could not be roller carded and were directly incorporated into the insulation material (mean values and standard deviation as error bar).
Manufacturing & measuring the insulation products
Manufacturing the insulation products
The manufacture of the insulation materials was successful, and all kinds of fibers could be processed into easy-to-handle insulation samples. The roller carding process proved suitable for most fibers; only the very coarse coir fiber bundles could not be processed. During processing, it became apparent that the card clothing was not ideally suitable for all fiber types. The losses were accordingly very different, most pronounced for unretted hemp, followed by retted hemp, cotton, lyocell, retted flax tow, and least for wool. In industrial processing, the card clothing should be adapted to the fiber to be processed.
Density and thermal conductivity of the manufactured insulation materials
The density of the insulation materials was defined as 30 g/cm3 and a thickness of approximately 6 cm. A 35 g/cm3 density was achieved in the thermal conductivity device by changing the thickness of the sample to 5 cm. The thermal conductivity values as a function of different thicknesses (5 cm and 6 cm) are shown in and . The thermal conductivity values determined for dry samples are theoretically 10% lower than under real (ambient humidity) conditions.
Figure 5. Thermal conductivity (λ) of manufactured insulation materials as a function of different thicknesses for different fiber types.
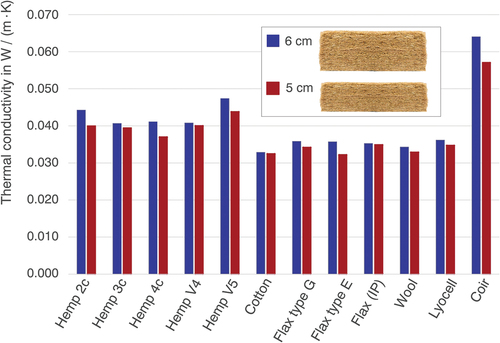
Table 1. Values of the thermal conductivity of the manufactured insulation materials as a function of different thicknesses and densities for different fiber types.
shows the thermal conductivity as a function of the tested thicknesses and densities for the fiber types used.
The determined thermal conductivity values show good agreement with the values mentioned in the literature (compare, e.g., Hung Anh and Pásztory Citation2021). Zach et al. (Citation2013), for example, determined a thermal conductivity of 0.04951 W/(mK) for hemp fiber insulation with a density of 31 kg/m3, which is slightly above the value of the thermal conductivity for the coarsest hemp V5 (compare ). Gaujena et al. (Citation2020) achieve relatively high values of thermal conductivity above 0.0544 W/(mK) for hemp-based insulation materials, which is probably due to the use of raw materials with a very high shive content and a high insulation density of 200 kg/m3.
In addition to the analyzed densities, we attempted to set a density of 40 g/cm3 by reducing the thickness of the samples to 4 cm. However, the 4 cm thick samples could not be realized for all fiber types; this was only possible for samples shown in .
Figure 6. Thermal conductivity (λ). Average densities of the considered insulating materials.
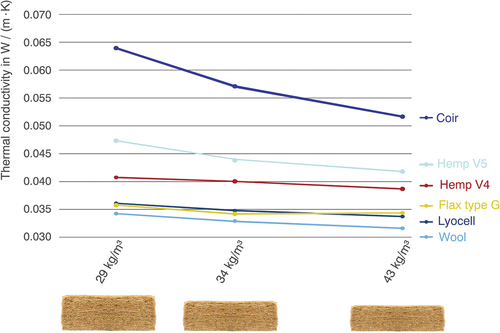
Stapulionienė et al. (Citation2016) investigate insulation materials made from the following raw materials: long and short flax and hemp in different processing stages as well as chopped peat. Density was between 40 kg/m3 and 100 kg/m3, and the thermal conductivity varied from 0.0599 to 0.0341 W/(m·K). The dependence of density and thermal conductivity shown in is also described by Zach et al. (Citation2016) for hemp. In their work, a density range of approx. 30 to 60 kg/m3 is investigated, and the thermal conductivity changes in this range from slightly over 0.055 W/(mK) to somewhat over 0.040 W/(mK). In the present work, lower thermal conductivity values are achieved for hemp (compare ) than in Zach et al. (Citation2016), which is possibly the case because Zach et al. (Citation2016) used an air-layered hemp insulation material (15% polyether bicomponent fibers) with a higher shive content. Furthermore, it can be assumed that the coarse hemp fiber bundles have not undergone any further refinement in the air-lay process. In contrast, the fiber bundles are refined and shortened when using a roller card (see ).
Domínguez-Muñoz et al. (Citation2010) describe a strong dependence of the thermal conductivity on the density of the glass fiber insulation materials. In the published data, the thermal conductivity drops sharply for density values between 20 and 40 kg/m2 and remains constant up to approx. 70 kg/m2 and then even increases slightly again. For natural fibers, the dependence on insulation density and thermal conductivity varies depending on the type of fiber. Murphy et al. (Citation1999) show that the thermal conductivity of cotton-based insulation materials does not change between 20 and 50 kg/m3. The thermal conductivity for glass fiber insulation and fine-separated flax hardly varies for insulation densities between 35 and 50 kg/m3. For coarser hemp fiber bundles, the authors see a further decrease in thermal conductivity for both retted and unretted hemp from densities between 35 and 50 kg/m3 (Murphy, Bockisch, and Schäfer-Menuhr Citation1999).
The present study investigates the correlations (Excel 2013, Microsoft, Redmond, USA) between thermal conductivity, Airflow, and Shirley values within various thermal insulation materials using natural and regenerated cellulose fibers. shows the analysis findings of two distinct sample thicknesses, namely 5 cm and 6 cm. For the 5 cm thick samples, an Airflow model () was developed to describe the dependence of the thermal conductivity on the fiber fineness (Airflow). A Shirley-PL and PH model () specifically tailored to the 5 cm thick samples was calculated. The investigation was extended to 6 cm thick samples, utilizing an Airflow model () and a Shirley-PL and -PH model (). The results show the mathematical correlation between the thermal conductivity and the Airflow, as well as the Shirley values for the fibers investigated.
Figure 7. Correlations between thermal conductivity (λ), Airflow, and Shirley values. (a) Airflow model for 5 cm thick (mean density 35 kg/m3) samples, (b) Shirley-PL model for 5 cm thick samples, and (c) Shirley-PH model for 5 cm thick samples. (d) Airflow model for 6 cm thick (mean density 29 kg/m3) samples, (e) Shirley-PL model for 6 cm thick samples, and (f) Shirley-PH model for 6 cm thick samples.
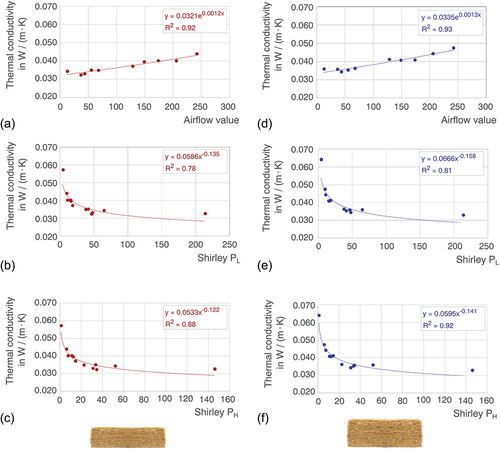
The following can be considered for the Airflow measurements and the developed models: The measuring device covers a smaller fiber fineness measuring range than the FMT Shirley device. The measurements for cotton and coir fibers were impossible because they were too fine or too coarse. Thus, the resolution of the Airflow device is higher than the resolution of the Shirley FMT. Shirley-PH shows the most accuracy with the highest R2 value (see ).
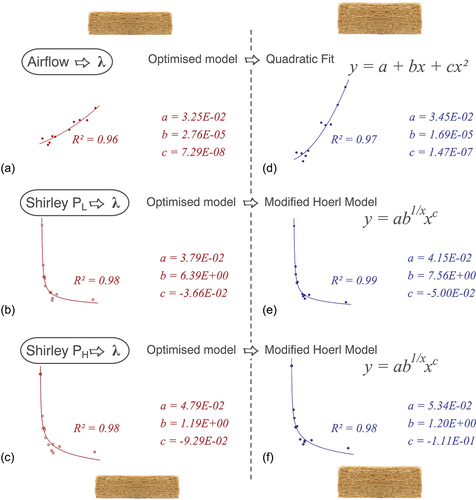
The model’s accuracy was further optimized using the Curve Expert software (version 1.34, Hyams Development, US). summarizes the results and the proposed calculation models.
Figure 8. Using the Curve Expert software, refined correlations between thermal conductivity (λ), Airflow, and Shirley values. (a) Airflow model for 5 cm thick (mean density 35 kg/m3) samples, (b) Shirley-PL model for 5 cm thick samples, and (c) Shirley-PH model for 5 cm thick samples. (d) Airflow model for 6 cm thick (mean density 29 kg/m3) samples, (e) Shirley-PL model for 6 cm thick samples, and (f) Shirley-PH model for 6 cm thick samples.
To test the general suitability of the models for estimating the thermal conductivity of an insulation product based on the determined fiber fineness, the Airflow, and Shirley values were measured for a commercially available glass fiber insulation product, and the thermal conductivities were calculated using the proposed models. Using the Airflow and Shirley data, the thermal conductivity values were calculated according to the equations given in . The results of these calculations are summarized in .
Table 2. Calculation of the thermal conductivity for a commercial insulation product based on the measurement of the properties using the Airflow and Shirley FMT compared to the measured thermal conductivity values. The measured Airflow and Shirley results are given in brackets. The calculation models and the relevant parameters are also shown.
The comparison of the results between the estimation and measurement of the thermal conductivity of the glass fiber insulation product shows a slight deviation in the values. The Airflow model offers little more advantages here than the Shirley models, with results closer to the measured thermal conductivity.
Conclusion
The basic approach of our model was to estimate the thermal conductivity of a natural fiber insulation material based on the fineness measured with the Airflow and Shirley systems. For this reason, we have included the broadest possible range of natural fibers with different finenesses in our research. The model is based on these measurement series (fiber fineness vs. thermal conductivity), which allows us to consider natural fibers/fiber bundles with very different thicknesses. Based on our research, it is possible to predict the thermal conductivity of natural fiber insulation materials based on fiber fineness measurement according to the principle of airflow with the calculation models obtained. Using the model to calculate the thermal conductivity of a glass fiber insulation material as a function of the fiber fineness demonstrates the applicability of the approach, which is not only suitable for natural fibers. The Shirley method covers a broader range of fibers (bundles) – from cotton to coir. If the fibers to be examined are in a narrower range, e.g., in the area of bast fiber bundles, the measurement with the Airflow device shows a higher resolution.
Overall, the use of the Airflow or Shirley devices in the context of natural fiber insulation materials is interesting from several perspectives:
An insulation manufacturer can use the approach to guarantee fast incoming raw material control.
The setting of the fiber processing components, such as openers or cards, and the influence on the refinement of the fiber bundles can be monitored quantitatively.
The modeling approach allows for an easy and efficient estimation of insulation materials’ thermal conductivity from airflow measurements of raw materials.
The models can be used to estimate how the thermal conductivity of the products changes due to a process-related refinement of the fiber bundles.
Overall, a simple method has been developed that enables the thermal conductivity of insulation materials to be predicted quickly during the incoming raw materials inspection. Future research on the thermal conductivity prediction model presented in this paper should focus on evaluating and improving its robustness by applying it to other natural fiber insulation materials to more intensively validate its effectiveness and reliability.
Highlights
Study shows models to predict thermal conductivity in natural fibers based on fineness values.
Airflow and Shirley systems effectively measure fiber fineness for a broad set of natural fibers.
Research offers a method for manufacturers to gauge and optimize materials’ thermal properties.
Disclosure statement
No potential conflict of interest was reported by the author(s).
References
- Amtmann, M., M. Höher, O. Mairam Tinkhof, L. Strimitzer, D. Banner, A. Bauer, H. Brugger, J. Hug, I. Tributsch, and S. Vogel. 2014. “Dämmstoffe richtig eingesetzt: Eignung, Anwendung und Umweltverträglichkeit von Dämmstoffen (Insulation materials used correctly: suitability, application and environmental compatibility of insulation materials).” In Media Owner and Publisher: Federal Ministry of Agriculture, Forestry, Environment and Water Management, edited by M. Schuster, K. Kowalski, E. Bargmann, and H. Bader, 8th ed. Vienna, Austria. November (in German).
- Andrä, H., D. Dobrovolskij, M. Engelhardt, M. Godehardt, M. Makas, C. Mercier, S. Rief, et al. 2023. “Image-Based Microstructural Simulation of Thermal Conductivity for Highly Porous Wood Fiber Insulation Boards: 3D Imaging, Microstructure Modeling, and Numerical Simulations for Insight into Structure–Property Relation.” Wood Science and Technology 57 (1): 5–13. https://doi.org/10.1007/s00226-022-01434-6.
- Cumming, G., F. Fidler, and D. L. Vaux. 2007. “Error Bars in Experimental Biology.” The Journal of Cell Biology 177 (1): 7–11. https://doi.org/10.1083/jcb.200611141.
- Day, M., and D. M. Wiles. 1978. “Combustibility of Loose Fiber Fill Cellulose Insulation: The Role of Borax and Boric Acid.” Journal of Thermal Insulation 2 (1): 30–39. https://doi.org/10.1177/109719637800200104.
- Domínguez-Muñoz, F., B. Anderson, J. M. Cejudo-López, and A. Carrillo-Andrés. 2010. “Uncertainty in the Thermal Conductivity of Insulation Materials.” Energy and Buildings 42 (11): 2159–2168. https://doi.org/10.1016/j.enbuild.2010.07.006.
- El-Sawalhi, R., J. Lux, and P. Salagnac. 2016. “Estimation of the Thermal Conductivity of Hemp Based Insulation Material from 3D Tomographic Images.” Heat and Mass Transfer 52 (8): 1559–1569. https://doi.org/10.1007/s00231-015-1674-4.
- FNR. Fachagentur Nachwachsende Rohstoffe e. V. (FNR), Gülzow-Prüzen, DE, Order No. 317, 10th, revised edition: Editor; 2019. Marktübersicht - Dämmstoffe aus nachwachsenden Rohstoffen (Market overview - Insulation materials from renewable raw materials). Gülzow-Prüzen, Germany: Fachagentur Nachwachsende Rohstoffe e. V.
- FNR. 2021. “Marktanteil von Nawaro-Dämmstoffen wächst - Umfrage Zum Einsatz Biobasierter Baustoffe (Market Share of Nawaro Insulation Materials Grows - Survey on the Use of Bio-Based Building Materials).” in German. (2021-02-4). https://baustoffe.fnr.de(2024-03-02).
- Gaujena, B., V. Agapovs, A. Borodinecs, and K. Strelets. 2020. “Analysis of Thermal Parameters of Hemp Fiber Insulation.” Energies 13 (23): 6385. https://doi.org/10.3390/en13236385.
- Ghosh, S. K., S. Bairagi, M. R. Bhattacharyya, and M. M. Mondal. 2016. “Study on Potential Application of Natural Fibre Made Fabrics As Thermal Insulation Medium.” American International Journal of Research in Science, Technology, Engineering & Mathematics 16 (203): 8–13.
- Hung Anh, L. D., and Z. Pásztory. 2021. “An Overview of Factors Influencing Thermal Conductivity of Building Insulation Materials.” Journal of Building Engineering 44:102604. https://doi.org/10.1016/j.jobe.2021.102604.
- Hurtado, P. L., A. Rouilly, V. Vandenbossche, and C. Raynaud. 2016. “A Review on the Properties of Cellulose Fibre Insulation.” Building and Environment 96:170–177. https://doi.org/10.1016/j.buildenv.2015.09.031.
- ISO 8302. 1991. “Thermal Insulation; Determination of Steady-State Thermal Resistance and Related Properties; Guarded Hot Plate Apparatus.” ISO Standard, 1st ed., 47.
- Kosiński, P., P. Brzyski, A. Szewczyk, and W. Motacki. 2018. “Thermal Properties of Raw Hemp Fiber as a Loose-Fill Insulation Material.” Journal of Natural Fibers 15 (5): 717–730. https://doi.org/10.1080/15440478.2017.1361371.
- Kymäläinen, H. R., and A. M. Sjöberg. 2008. “Flax and Hemp Fibres as Raw Materials for Thermal Insulations.” Building and Environment 43 (7): 1261–1269. https://doi.org/10.1016/j.buildenv.2007.03.006.
- Murphy, D. P. L., H. Behring, and H. Wieland. 1997. “The Use of Flax and Hemp Materials for Insulating.” Processing of Flax and Other Bast Plants Symposium, 79–84. Poznan, Poland: Institute of Natural Fibres. 30 September – 1 October 1997.
- Murphy, D. P. L., F.-J. Bockisch, and A. Schäfer-Menuhr. 1999. Möglichkeiten und Chancen von heimischen nachwachsenden Rohstoffen zur Nutzung als Dämmmaterial (Possibilities and opportunities of domestic renewable raw materials for use as insulation material), 288. Braunschweig-Völkenrode, DE: Bundesforschungsanstalt für Landwirtschaft (FAL). (in German).
- Musio, S., J. Müssig, and S. Amaducci. 2018. “Optimizing Hemp Fiber Production for High Performance Composite Applications.” Frontiers in Plant Science 9:1702. https://doi.org/10.3389/fpls.2018.01702.
- Müssig, J. 2001. Untersuchung der Eignung heimischer Pflanzenfasern für die Herstellung von naturfaserverstärkten Duroplasten. (Investigation of the Suitability of Domestic Plant Fibers for the Production of Natural Fiber-Reinforced Thermosets). Düsseldorf: VDI Verlag GmbH (in German).
- Müssig, J., S. Amaducci, A. Bourmaud, J. Beaugrand, and D. U. Shah. 2020. “Transdisciplinary Top-Down Review of Hemp Fibre Composites: From an Advanced Product Design to Crop Variety Selection.” Composites Part C Open Access 2:100010. https://doi.org/10.1016/j.jcomc.2020.100010.
- Reinhardt, J., C. Veith, J. Lempik, F. Knappe, P. Mellwig, J. Giegrich, N. Muchow, T. Schmitz, and V. I. 2019. Ganzheitliche Bewertung von verschiedenen Dämmstoffalternativen (Holistic Evaluation of Different Insulation Alternatives). Project, Funded by the Deutsche Bundesstiftung Umwelt (AZ 34426_01) and the Ministry for the Environment. Heidelberg, DE: Climate and Energy Management of Baden-Württemberg DE (in German).
- Stapulionienė, R., S. Vaitkus, S. Vėjelis, and A. Sankauskaitė. 2016. “Investigation of Thermal Conductivity of Natural Fibres Processed by Different Mechanical Methods.” International Journal of Precision Engineering and Manufacturing 17 (10): 1371–1381. https://doi.org/10.1007/s12541-016-0163-0.
- Symons, J. G., R. E. Clarke, and J. V. Peirce. 1995. “The Thermal Performance of Several Australian Fibrous Insulating Materials.” Journal of Thermal Insulation and Building Envelopes 19 (1): 72–88. https://doi.org/10.1177/109719639501900107.
- Tsapko, Y. V., A. Y. Tsapko, and O. P. Bondarenko. 2020. “Modeling of Thermal Conductivity of Reed Products.” IOP Conference Series: Materials Science & Engineering 907 (1): 012057. https://doi.org/10.1088/1757-899X/907/1/012057.
- Tye, R. P., Y. R. Fiorini, K. C. Lieb, I. C. Moore, A. L. Batik, and R. P. Tye. 1974. “Heat Transmission in Cellulosic Fiber Insulation Materials.” Journal of Testing and Evaluation 2 (3): 176–179. https://doi.org/10.1520/JTE10095J.
- Vaitkus, S., K. R, V. S, and L. L. 2014. “Development and Research of Thermal Insulation Materials from Natural Fibres.” Key Engineering Materials 604:285–288. https://doi.org/10.4028/www.scientific.net/KEM.604.285.
- Ye, Z., C. M. Wells, C. G. Carrington, and N. J. Hewitt. 2006. “Thermal Conductivity of Wool and Wool–Hemp Insulation.” International Journal of Energy Research 30 (1): 37–49. https://doi.org/10.1002/er.1123.
- Zach, J., J. Hroudová, J. Brožovský, Z. Krejza, and A. Gailius. 2013. “Development of Thermal Insulating Materials on Natural Base for Thermal Insulation Systems.” Procedia Engineering 57:1288–1294. https://doi.org/10.1016/j.proeng.2013.04.162.
- Zach, J., R. Slávik, and V. Novák. 2016. “Investigation of the Process of Heat Transfer in the Structure of Thermal Insulation Materials Based on Natural Fibres.” Procedia Engineering 151:352–359. https://doi.org/10.1016/j.proeng.2016.07.389.