
 ?Mathematical formulae have been encoded as MathML and are displayed in this HTML version using MathJax in order to improve their display. Uncheck the box to turn MathJax off. This feature requires Javascript. Click on a formula to zoom.
ABSTRACT
The environmental effects on the response of Date Palm Fiber (DPF) composites are explored through an in-depth analysis of water absorption behavior. This study comprehensively investigates the influence of fiber content, immersion time, and water type on mass gain. Rigorous experimentation and advanced statistical analyses quantify the percent contribution of each factor, emphasizing the dominant role of fiber content at 96.61%. While immersion time and water type contribute relatively smaller percentages (2.11% and 1.28%, respectively), their insights are invaluable for tailored composite design. The study extends to interaction effects, showcasing the combined influence of factors. Regression models, progressing from linear and reciprocal formulations to comprehensive global models, are developed. Meticulous examination of prediction accuracy, using diverse statistical metrics, highlights the superior performance of the global reciprocal model across different water types. This work provides essential insights for optimizing DPF composite design, fabrication, and application, empowering engineers and researchers to make informed decisions in industries demanding tailored water absorption behavior.
摘要
通过深入分析Date Palm Fiber(DPF)复合材料的吸水行为,探讨了环境对其响应的影响. 本研究全面研究了纤维含量、浸泡时间和水类型对质量增益的影响. 严格的实验和先进的统计分析量化了每个因素的百分比贡献,强调纤维含量的主导作用为96.61%. 虽然浸泡时间和水的类型所占的比例相对较小(分别为2.11%和1.28%),但它们的见解对于定制复合材料设计来说是非常宝贵的. 这项研究延伸到相互作用效应,展示了各种因素的综合影响. 开发了回归模型,从线性和倒数公式发展到全面的全球模型. 使用不同的统计指标对预测准确性进行细致的检查,突出了全球倒数模型在不同水类型中的卓越性能. 这项工作为优化DPF复合材料的设计、制造和应用提供了重要的见解,使工程师和研究人员能够在需要定制吸水行为的行业中做出明智的决策.
Introduction
Natural fiber composites have garnered significant attention in recent years as eco-friendly alternatives to traditional synthetic composites, owing to their renewable nature, low environmental impact, and favorable mechanical properties (Maurya and Manik Citation2023; Riyadh et al. Citation2023; Sathish et al. Citation2021). Among these natural fibers, Date Palm Fiber (DPF) stands out as a promising reinforcement due to its abundance, low cost, and remarkable mechanical characteristics (Amroune et al. Citation2022; Perera and Banu Citation2022; Sadek, Abdellah, and Abdel-Jaber Citation2024). The integration of DPF into polymer matrices has led to the development of composite materials with diverse applications in automotive, construction, aerospace, and packaging industries (AL-Oqla et al. Citation2023; Mahdi et al. Citation2019; Singh et al. Citation2022).
One critical aspect influencing the performance and durability of natural fiber composites is their water absorption behavior (Alshahrani et al. Citation2022; Oun et al. Citation2022). Water absorption can lead to swelling, dimensional instability, and a reduction in mechanical properties, potentially limiting the material’s functional lifespan (Mohammed, Rahman, Mohammed, Adam, et al. Citation2022). Understanding the intricate dynamics of water absorption is pivotal for tailoring these composites for specific applications and ensuring their optimal performance in various environmental conditions (Bachchan, Pratim Das, and Chaudhary Citation2022; Sahu and Gupta Citation2022).
Water absorption in natural fiber composites presents a complex interplay of factors such as fiber type, matrix material, fiber-matrix interface, composite architecture, and environmental parameters (Andrew and Dhakal Citation2022; Neto et al. Citation2022). Consequently, comprehending and manipulating the water absorption behavior of Date Palm Fiber (DPF) composites holds the key to harnessing their full potential in diverse industrial applications.
Water absorption in natural fiber composites is a multifaceted phenomenon influenced by the inherent characteristics of the constituent materials. Natural fibers are hygroscopic in nature due to the presence of hydroxyl groups in their chemical structure (Mohammed, Rahman, Mohammed, Betar, et al. Citation2022; Simon, Fulchiron, and Gouanvé Citation2022). These hydroxyl groups readily interact with water molecules, leading to swelling, microstructural changes, and consequently, degradation of mechanical properties (Mohammed et al. Citation2023; Mohammed, Rahman, Mohammed, Adam, et al. Citation2022). The extent of water absorption depends on factors like fiber diameter, porosity, crystallinity, surface morphology, and chemical composition (Mantaiah and Kumar Citation2022; Sahu and Gupta Citation2022). On the other hand, the matrix material plays a pivotal role in governing the overall water uptake behavior. Polymers have varying degrees of hydrophobicity and can exhibit different degrees of water diffusion (Bhuvaneswari et al. Citation2022). Additionally, the fiber-matrix interaction significantly influences the overall water absorption behavior. Proper adhesion and interaction between the fibers and the matrix can restrict water penetration and subsequent degradation (Lv and Liu Citation2023; Patel, Yadav, and Winczek Citation2023).
Date Palm Fiber (DPF) is a natural reinforcement with unique attributes that make it an attractive candidate for composite fabrication (Jagadeesh et al. Citation2022; Sarmin et al. Citation2023). Derived from the agricultural waste of date palm trees, DPF is not only abundant but also poses minimal environmental impact compared to synthetic fibers (Benyettou, Amroune, Slamani, et al. Citation2022; Haba et al. Citation2022). It exhibits high tensile strength and stiffness, making it suitable for load-bearing applications (Mohanavel et al. Citation2022; Refaai et al. Citation2022). The hydrophilic nature of DPF, however, introduces challenges related to water absorption. Thus, a comprehensive understanding of water absorption in DPF composites is essential for unlocking their full potential.
Incorporating DPF into polymer matrices offers several advantages, including enhanced mechanical properties, weight reduction, and improved sustainability (Sarmin et al. Citation2023). The integration of DPF can lead to the development of bio-based composites with desirable attributes. However, these benefits may be offset by the sensitivity of DPF composites to water absorption (Boey, Keong Lee, and Seng Tay Citation2022; Nanda, Narayan Das, and Mohapatra Citation2022). Therefore, investigating the water absorption behavior of DPF composites is crucial to determine their suitability for specific applications and to facilitate the design of effective moisture management strategies.
The presence of water can have a significant impact on the mechanical, thermal, and morphological properties of natural fiber composites (Balaji et al. Citation2024; Mohammed, Rahman, Mohammed, Adam, et al. Citation2022; Praveena et al. Citation2022). Water molecules can penetrate the composite structure, leading to plasticization of the matrix and weakening of the fiber-matrix interface (Benyettou, Amroune, Mohamed, et al. Citation2022; Mohammed et al. Citation2023). The ingress of water can also cause swelling of the fibers and matrix, resulting in dimensional changes and increased internal stresses (Chakkour et al. Citation2023; Lu, Fuentes, and Willem Van Vuure Citation2022; Wang et al. Citation2022). Additionally, water can accelerate chemical degradation processes, such as hydrolysis of the polymer matrix and degradation of the fibers (Barreira-Pinto et al. Citation2023; Hussnain et al. Citation2023). These combined effects can result in reduced mechanical performance, increased susceptibility to cracking and fracture, and overall degradation of the composite over time (Bhaskaran et al. Citation2023; Boey, Baidurah Yusoff, and Seng Tay Citation2022).
Understanding the water absorption behavior of Date Palm Fiber (DPF) composites is crucial for several reasons. First, it allows for the prediction of the composite’s response to moisture exposure in various environments, facilitating the design of materials that can withstand specific conditions (Andrew and Dhakal Citation2022; Hussnain et al. Citation2023). Second, knowledge of water absorption behavior aids in the selection of appropriate processing methods and matrix materials to mitigate potential issues associated with water ingress (Rakesh, Ranakoti, and Kumar Gupta Citation2023; Wu, Yu, and Chen Citation2023). Third, it provides insights into the long-term durability and lifespan of DPF composites, particularly in applications where exposure to moisture is inevitable (Bachchan, Pratim Das, and Chaudhary Citation2022; Haddar, Ben Slim, and Koubaa Citation2022). Therefore, a thorough investigation of the water absorption behavior of DPF composites is essential for advancing their use in practical engineering applications.
In recent years, researchers have devoted significant attention to studying the water absorption behavior of natural fiber composites (Bollino et al. Citation2023; Karim et al. Citation2023; Vallejos et al. Citation2023; Zou et al. Citation2023). Various factors have been identified that influence water absorption, including fiber type, fiber content, matrix material, processing techniques, and environmental conditions (Moujoud et al. Citation2023).
Mahdi et al. (Mahdi et al. Citation2021). explore the integration of circular economy principles in manufacturing polymeric composite materials, focusing on Khalasa date palm leaf fiber (KDPLF) as reinforcement. They investigate KDPLF’s morphology, material properties, chemical composition, and water uptake. The study uncovers a lumen size of 32.8 ± 15.9 µm and high hemicellulose content in KDPLF. Tensile tests reveal varying mechanical properties and morphology, with KDPLF showing a tensile strength of 47.99 ± 13.58 MPa and modulus of 2.1 ± 0.40 GPa. Moreover, the paper discusses the influence of water absorption on KDPLF/epoxy composite properties, indicating a decrease in strength and stiffness alongside increased moisture absorption, while toughness increases.
The primary objective of this paper is to comprehensively investigate the water absorption behavior of Date Palm Fiber (DPF) composites by systematically analyzing the influence of various parameters. Key research questions addressed include:
How does the fib/K/ composites?
What is the impact of immersion time on the water absorption kinetics of DPF composites?
How does the type of water, such as distilled water or saltwater, influence the water absorption behavior of DPF composites?
To address these inquiries, a series of experimental tests were conducted using DPF-reinforced polymer composites with varying fiber contents. These composites were subjected to immersion in different types of water for varying durations, and their water absorption behavior was meticulously quantified. Advanced statistical methods, including regression modeling and analysis of covariance (ANCOVA), were employed to analyze the results and elucidate the relationships between the different parameters and water absorption.
The subsequent sections of this paper provide a detailed overview of the experimental methodology, encompassing the materials utilized, sample preparation procedures, and testing protocols. The outcomes of the water absorption tests are comprehensively presented and analyzed, with particular emphasis on evaluating the effects of fiber content, immersion time, and water type. Furthermore, predictive models based on regression analysis are introduced to estimate the water absorption behavior of DPF composites under varying conditions, thereby enhancing our understanding of their performance characteristics. The study’s innovation and novelty stem from its systematic investigation, which includes the introduction of an indicator variable to assess the effect of water type on water absorption behavior, alongside the examination of fiber content and immersion time. This approach offers valuable insights for designing and engineering DPF composites with customized water absorption properties. The outcomes of this study hold significant potential for enhancing the performance and durability of DPF composites in applications where moisture resistance is crucial.
Materials and methods
The materials used in this study included Date Palm Fiber (DPF) obtained from date palm fruit branches of the region of Oued Souf (Algeria), iso-polyester resin was used as the matrix, and various types of water for immersion testing. The Date Palm Fiber (DPF) was collected, cleaned, and processed according to AFNOR 57–101 standard to obtain fibers suitable for composite reinforcement. The iso-polyester resin was selected based on its compatibility with DPF and its potential for forming effective composites. This type of resin is commonly employed in marine applications due to its favorable wax content and minimal water absorption rate. The different types of water used for immersion testing included distilled water, saltwater, and rainwater to investigate the impact of water composition on water absorption behavior.
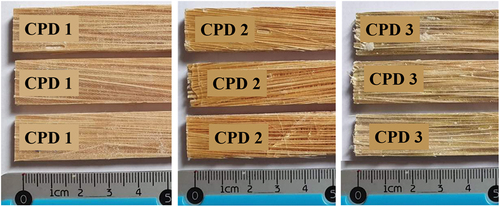
Date Palm Fiber (DPF) composites were prepared using vacuum casting technique to produce all samples, which were then placed in an oven at 75°C for a full day to ensure complete polymerization and the elimination of excess moisture and then cooled to 23°C. The DPF content in the composites was varied within the range of 15%, 20% and 27% to study the effect of fiber content on water absorption behavior. The composite specimens were prepared according to rectangular pieces measuring 50 × 15 × 5 mm3 ().
Figure 1. The specimens used in the water absorption test.
The prepared DPF composite specimens were subjected to immersion testing in different types of water, including distilled water, saltwater, and rainwater. The specimens were immersed in water at temperature of 23°C for varying periods, ranging from (24, 48, 72, 96, 120, 144, 192 240, 288, 336, 384, 432, 480, 528, 576, 624 and 672 h) to study the effect of immersion time on water absorption behavior. After each immersion period, the specimens were removed from water, gently wiped to remove surface water, and weighed to determine the absorbed water content.
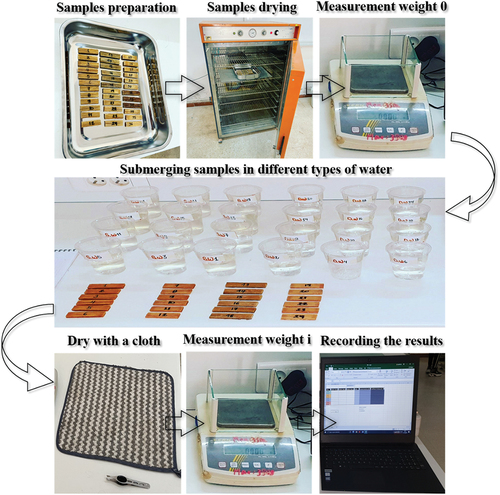
Next, the desiccated specimens underwent weighing using a precision scale accurate to 1/1000 g. Subsequently, these specimens were submerged in 40 ml receptacles containing three distinct water varieties – seawater, distilled water, and rainwater (as illustrated in ) all at an ambient temperature of 23°C. At intervals of 24 hours, the samples were extracted, gently dried with a fabric towel to eliminate lingering liquids, and then reweighed. This cycle extended beyond a span of 30 days, continuing until the specimens reached a point of saturation.
Figure 2. Materials and equipment for experimentation used to assess the water absorption behavior of CDPF.
The water absorption behavior of DPF composites was analyzed by calculating the water absorption percentage (%WA) using the formula:
Where: Wt is the weight of the specimen at time t, and Wo is the initial weight of the specimen.
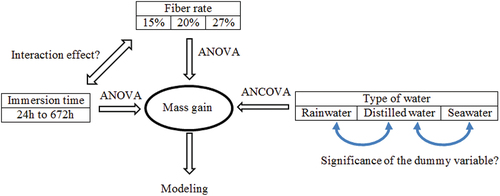
A factorial experimental design was employed to systematically investigate the effects of fiber content, immersion time, and water type on water absorption behavior. The experimental matrix was developed according to full factorial design. The results were statistically analyzed using statistical methods, e.g., ANOVA, ANCOVA and regression analysis () to determine the significance of the observed differences in water absorption behavior based on fiber content, immersion time, and water type. The analysis of Covariance (ANCOVA) was employed to assess the interaction effects of multiple independent variables on water absorption behavior. ANCOVA allowed us to determine the influence of each variable while controlling for the effects of other variables ().
Figure 3. Overview of the statistical methods used.
Results and discussions
Analysis of percent contribution
The analysis of the percent contribution is crucial in understanding the significance of various factors in the water absorption process of Date Palm Fiber composites. By quantifying the individual and interactive contributions of fiber content, immersion time, and water type, researchers and engineers gain valuable insights into the impact of these factors on mass gain. Percent contribution provides a clear measure of the relative influence of each factor, allowing for informed decision-making during the composite design and fabrication process. This information helps in selecting the optimal fiber content, controlling immersion time, and considering the specific water type to achieve the desired water absorption characteristics. Additionally, percent contribution aids in identifying the interactions between these factors, highlighting the combined effects that may play a role in determining water absorption behavior. Overall, understanding percent contribution enhances our ability to optimize the properties and performance of Date Palm Fiber composites in various applications where water absorption behavior is a critical consideration.
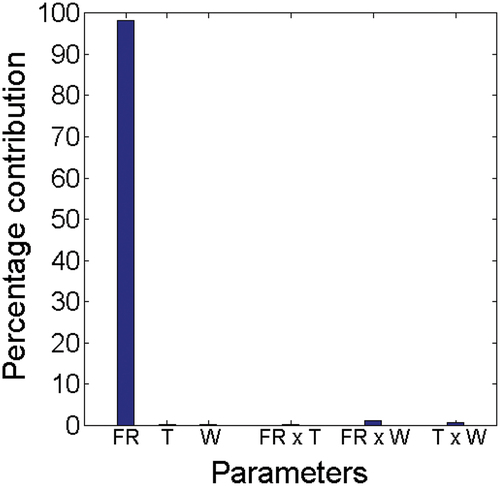
illustrates the individual contributions of each factor to the mass gain in the water absorption process. The investigation into the water absorption process of Date Palm Fiber composites reveals that the fiber content (Fc) plays a dominant role, contributing approximately 96.61% to the overall mass gain. This underscores the significance of selecting an appropriate fiber content achieve the desired water absorption properties. This is in agreement with previous studies that highlight the significant influence of fiber content on water absorption properties (Anbukarasi and Kalaiselvam Citation2015; Masoodi and Pillai Citation2012; Rajkumar, Srinivasan, and Suvitha Citation2015). An elevation in the quantity of fiber leads to an augmented rate of water absorption (Chen, Ahmad, and Gan Citation2016; Huner Citation2015; Sanjeevi et al. Citation2021; Singha and Thakur Citation2008; Zahari et al. Citation2015). This heightened water absorption rate can be attributed primarily to reduced adhesion between the fiber and matrix (Jothibasu et al. Citation2020). The quantity of fiber used has a substantial impact on the mass gain during water absorption, making it a critical factor to consider during composite fabrication.
Figure 4. Individual contributions of factors to mass gain in water absorption process of date palm fiber composites.
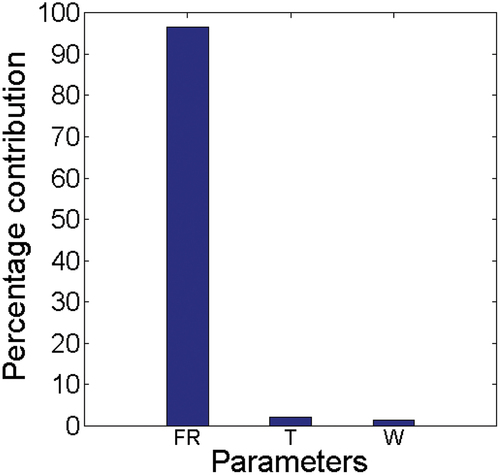
In contrast, the contributions of immersion time (T) and water type (W) are relatively small, accounting for approximately 2.11% and 1.28% respectively. Although these contributions may seem minor compared to the influence of the fiber content, they still offer valuable insights into the water absorption behavior of the composites (Saaidia et al. Citation2023).
The modest contribution of immersion time highlights its influence on the mass gain. Longer immersion times result in relatively lower mass gains, suggesting that the duration of exposure has a diminishing effect on the water retention properties compared to the fiber content.
Optimizing the immersion time remains important for tailoring the composites to specific applications requiring specific water absorption properties. To establish the significance of immersion time on mass gain, additional statistical analysis is necessary, which will be extensively addressed in the following sections of this paper. Further in-depth statistical analysis will be extensively addressed in the upcoming sections of this paper to establish the true significance of immersion time on mass gain.
Similarly, the contribution of water type indicates that the choice of water source has a relatively minor impact on the water absorption behavior of Date Palm Fiber composites. While different water sources may lead to slight variations in water absorption, the overall contribution of water type is smaller compared to the fiber content. Nonetheless, understanding these variations can be relevant for applications that necessitate precise control over water absorption properties. To establish the significance of water type on mass gain, additional statistical analysis is necessary, which will be extensively addressed in the later sections of this paper.
When taking the interaction between these factors into account, the analysis of the water absorption process of Date Palm Fiber composites shows significant differences. illustrates the interactive contributions of the factors to the mass gain in the water absorption process.
Figure 5. Interactive contributions of factors to mass gain in water absorption process of date palm fiber composites.
The investigation into the water absorption process of Date Palm Fiber composites demonstrates that the fiber content (Fc) plays a major role, contributing approximately 98.12% to the overall mass gain. This indicates the critical importance of selecting an appropriate fiber content to achieve the desired water absorption properties. Optimal fiber contents should be carefully determined during the composite fabrication process to ensure the desired water absorption characteristics.
The contributions of immersion time (T), water type (W), and their interactions are relatively small, yet they offer valuable insights into the overall behavior of the composites. Although their individual contributions may be small compared to the dominant contribution of the fiber content, they provide nuanced information about the water absorption behavior.
Similarly, the contribution of water type highlights the influence of different water sources on water absorption. Although the percentage may be small, the varying degrees of water absorption observed with different water types, such as seawater, distilled water, or rainwater, have implications for tailoring the properties of the composites to specific applications. Understanding the impact of water type is crucial for accurately predicting and optimizing the water absorption characteristics of the composites.
The interactions between factors, such as the interaction between fiber content and immersion time (Fc×T), the interaction between fiber content and water type (Fc×W), and the interaction between immersion time and water type (T×W), collectively contribute to the overall behavior of the composites. Although their individual contributions may be small, studying these interactions provides a comprehensive understanding of how multiple factors interact and affect the water absorption process.
Analysis of the average mass gain
Now, let’s delve into the analysis of the average mass gain, a key aspect that offers valuable insights into the water absorption behavior of Date Palm Fiber composites. This analysis not only provides a comprehensive understanding of how water is absorbed by the composites but also serves as a guiding tool for developing tailored strategies to improve their performance and functionality. By optimizing the water absorption properties, these composites can find wide-ranging applications in industries where water absorption behavior is of utmost importance.
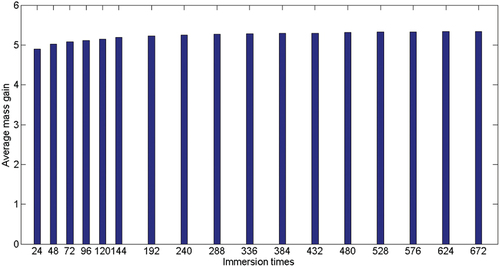
shows the evolution of average mass gain with immersion times whatever the fiber contents and the type of water. As shown in this figure, the evolution of average mass gain with immersion times demonstrates that the mass gain increases as the immersion time progresses. This indicates that the duration of water exposure has a significant impact on the water absorption behavior of the composites. However, as the immersion times continue to extend, the rate of mass gain starts to decrease, eventually reaching a plateau. This saturation behavior, as depicted in , suggests that there is a limit to the water absorption capacity of the composites.
Figure 6. Evolution of average mass gain with immersion times.
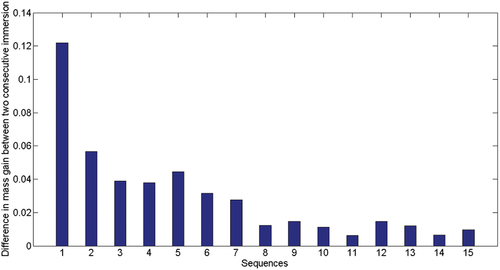
Furthermore, the analysis of the difference in mass gain between consecutive immersion times, as shown in , reveals a decreasing trend as the immersion time increases. This suggests that the composites are approaching a state of saturation, where the additional mass gain between consecutive immersions becomes progressively smaller. The saturation behavior, as depicted in , indicates that the composites have reached their maximum water absorption capacity.
Figure 7. Differences in mass gain between each two consecutive immersion times.
The results presented in indicate that saturation is achieved around 192 hours with minimal fluctuation thereafter. This is consistent with the general trend observed in Bachchan et al.‘s study (Bachchan, Pratim Das, and Chaudhary Citation2022), where they concluded that moisture absorption capacity increases with time but eventually saturates, reaching a constant level. However, it’s worth noting that the specific saturation times and levels may vary depending on the material composition and environmental conditions. Additionally, while Bachchan et al (Bachchan, Pratim Das, and Chaudhary Citation2022). provide a broader overview of moisture absorption behavior in natural fiber reinforced polymer composites, our study focuses specifically on date palm leaf fiber composites, providing detailed insights into the water absorption behavior of this particular material system. However, our results contrasts with Mahdi et al.‘s (Mahdi, Hernández, and Eltai Citation2015) observations, where date palm leaf fiber (DPLF) exhibited rapid hydrophilic behavior, reaching saturation within 24 hours, likely due to a higher volume fraction of reinforcement (31.4%). Notably, our results underscore the substantial influence of fiber content, contributing approximately 98.12% to the overall mass gain. Additionally, effectively illustrates the impact of fiber content on average mass gain.
Figure 8. Evolution of average mass gain with fiber content.
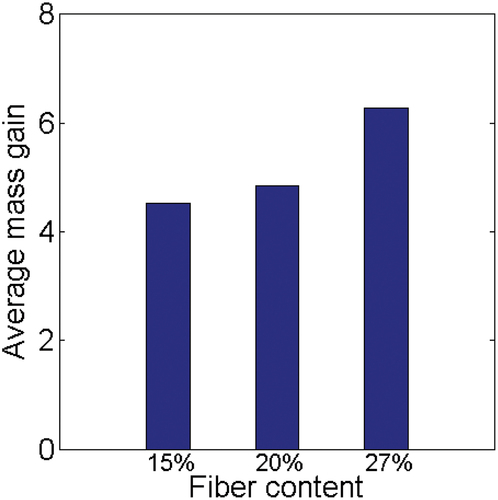
The relationship between average mass gain and fiber content, regardless of immersion time and water type, as depicted in , shows that higher fiber contents result in greater mass gains. This indicates that the amount of fiber incorporated into the composites directly affects their water absorption behavior. This observation aligns well with the conclusions drawn by Bachchan et al. (Bachchan, Pratim Das, and Chaudhary Citation2022) in their comprehensive review study. Previous research has also identified a parallel trend, linking higher fiber content to a heightened water absorption rate (Singha and Thakur Citation2008). This phenomenon is attributed to reduced adhesion between the fiber and matrix, as elucidated in (Jothibasu et al. Citation2020), elucidating the underlying cause for this elevated water absorption rate.
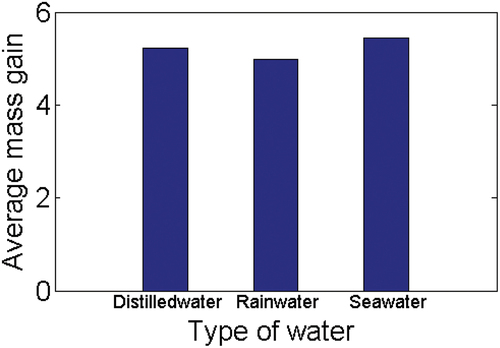
The variation in the average mass gain across different types of water whatever the immersion times and the fiber contents, as depicted in , suggests that the water source used during the water absorption process also impacts the water absorption behavior of the composites. Distilled water, rainwater, and seawater exhibit distinct water absorption characteristics, leading to varying degrees of mass gain in the composites. A notable observation indicated that the fibers exhibit the highest water absorption capacity in seawater, attributable to its elevated pH level, as shown in . Conversely, rainwater, characterized by its comparatively lower pH level, displayed the lowest water absorption among the three types (Nosbi et al. Citation2011). To further understand their impact, statistical modeling will be extensively explored in the subsequent section of this paper.
Figure 9. Evolution of average mass gain with type of water.
In summary, the analysis of the average mass gain, as illustrated in , provides valuable insights into the water absorption process of Date Palm Fiber composites. The immersion time, fiber content, and type of water all play significant roles in determining the mass gain and water absorption behavior of the composites. Understanding these factors and their interactions is crucial for optimizing the design and fabrication process of the composites to achieve specific water absorption properties.
Regression model
The regression model is of utmost importance in analyzing and understanding complex relationships between variables in the context of the water absorption process of Date Palm Fiber composites. By employing a regression model, researchers can quantitatively assess the contributions and interactions of factors such as fiber content, immersion time, and water type. This modeling approach allows for the identification of significant predictors and their respective coefficients, providing valuable insights into the extent of influence each factor has on the mass gain during water absorption. Moreover, the regression model enables researchers to make predictions and draw conclusions based on empirical evidence, aiding in the optimization of composite design and fabrication processes. By leveraging the power of regression analysis, the water absorption behavior of Date Palm Fiber composites can be more accurately understood and tailored to specific application requirements, ultimately contributing to the advancement and practical application of these composites in various industries.
During the modeling of mass gain in the water absorption process of Date Palm Fiber composites, it is common practice to divide the collected data into two sets: the estimation set and the validation set. This division is crucial for assessing the performance and reliability of the regression model.
The estimation set is used to develop the regression model. It consists of a subset of the collected data that is employed to train the model and estimate the coefficients of the predictors. This set serves as the foundation for building the regression equation that relates the factors (fiber content, immersion time, water type) to the mass gain during water absorption. By fitting the model to the estimation set, the relationship between the predictors and the response variable is established.
However, it is essential to evaluate the model’s ability to generalize to unseen data. This is where the validation set comes into play. The validation set is a separate subset of the collected data that is not used during the model development stage. Instead, it is reserved to assess the performance of the trained regression model. The validation set acts as an independent dataset against which the model’s predictive accuracy and reliability are evaluated. By applying the model to the validation set, it is possible to assess how well the model can predict the mass gain for new unseen observations.
The use of both estimation and validation sets provides a rigorous evaluation of the regression model. It helps in detecting potential issues such as over fitting, where the model may perform well on the estimation set but fail to generalize to new data. By examining the model’s performance on the validation set, researchers can gauge its robustness and identify any necessary adjustments or improvements.
Linear regression model
Let’s begin by considering the simpler case, which is a linear model without any interaction terms. In this case, the model assumes that the effect of each factor such as immersion times, fiber content, and type of water on the mass gain remains independent of other factors in the model.
The equation representing this model specification is as follows:
In equation (II), represents the estimated mass gain,
is the intercept,
denotes the immersion time,
stands for the fiber content,
corresponds to the coefficient of the ith factor, and
represents the error term with a mean of ∈(
) = 0 and variance Var(
) =
. By using this straightforward linear equation, we can predict the values of mass gain for any combination of the input factors within the specified range.
Equation (II) can also be expressed in matrix form as follows:
The coefficients can be estimated using the following formula:
After estimating the equation (II), it becomes:
Upon examining , it is evident that the model given in equation (V) is inadequate, as the calculated F-value (F = 0.417) is smaller than the critical F-value (3.403) at a significance level of 5%.
Table 1. ANOVA table for the simple regression model.
Let’s now introduce the interaction effect, an essential yet frequently overlooked concept in regression analysis. Interaction terms offer a valuable tool to investigate whether the relationship between the target and an independent variable alters based on the value of another independent variable. In other words, they help us explore how the impact of one variable on the target varies depending on the presence or absence of another variable.
Upon incorporating the interaction term, equation (V) is modified as follows after estimation:
However, the ANOVA table () reveals that the estimated model remains inadequate since 3.028.
Table 2. ANOVA table for the simple regression model with interaction.
Let’s now delve deeper into the analysis of the model with second-order terms presented in equation (VII). The updated model equation is as follows:
The adequacy of the model is determined by comparing the calculated F-value (1102.13) with the critical F-value of 2.685 (). Since the calculated F-value significantly exceeds the critical value, the model is considered adequate for the given dataset. Additionally, the R-square value, , indicates that the model explains approximately 99.62% of the variance in the observed data. This high R-square value demonstrates the model’s capability to capture the relationship between the predictors and the target variable, mass gain.
Table 3. ANOVA table for the second order regression model.
The ANOVA table () highlights the importance of each term in explaining the variability of the mass gain data. The regression (SSR) value of 25.9 indicates that the model’s fitted values account for a significant portion of the total variation in the data, while the residual (SSE) value of 0.1 represents the unexplained variation. Together, these values contribute to the total (TSS) value of 26, which represents the overall variation in the mass gain data.
Next, we assess the significance of each term included in the model by comparing their respective F-values to the critical value 4.242, as shown in . According to this table, the interaction effect term, T× Fc, has an F-value of 0.0074, which is less than the critical value. This result indicates that the interaction effect is statistically insignificant, and its presence or absence from the model does not significantly impact the model’s quality of adjustment.
Table 4. F-values for individual terms in the model.
Based on this analysis, we remove the term with the lowest F-value (i.e. T× Fc), and the revised equation (VIII) for the model becomes:
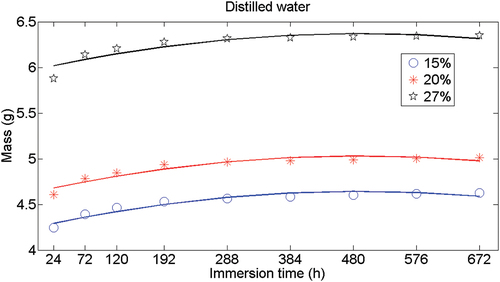
It is worth noting that the removal of the insignificant term does not impact the quality of adjustment, as the R-square value remains unchanged at . This observation further supports the adequacy of the model in capturing the relationship between the predictors and the “mass gain” variable for the estimation data ().
Figure 10. Experimental vs predicted mass using distilled water estimation data.
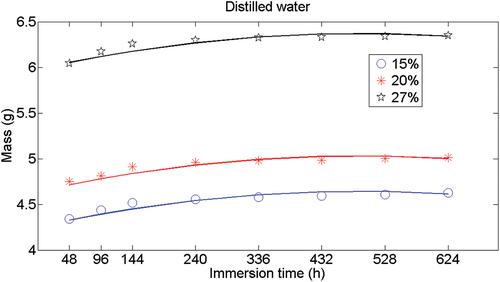
, presents the comparison of experimental vs. predicted mass gain using validation data for distilled water. The model demonstrates a strong fit to the validation data, as indicated by an impressive R-square value of . This high R-square value confirms the model’s ability to accurately predict “mass gain” in the given experimental conditions, making it a valuable tool for future predictions and analysis.
Figure 11. Experimental vs predicted mass using distilled water validation data.
In the improved model, we have not yet incorporated the effect of the type of water. To address the variations in mass gain based on different water types, we introduce an indicator variable, commonly known as a dummy variable. This approach allows us to account for the influence of various water sources on the water absorption behavior of the composites and provides a more comprehensive analysis.
The indicator variable allows us to represent the different types of water in a categorical manner, with distinct values assigned to each type. For example, we may assign a value of 0 to distilled water and 1 to rainwater, or to seawater. By incorporating this dummy variable into our model, we can assess how the type of water influences the relationship between the independent variables (such as immersion times and fiber content) and the dependent variable (mass gain).
The analysis technique employed to examine the effects of the type of water, along with the other independent variables, is called ANCOVA (Analysis of Covariance). ANCOVA is a powerful statistical method that combines elements of both regression analysis and analysis of variance (ANOVA). It allows us to investigate how the different levels of the categorical variable (in this case, the type of water) impact the outcome variable while controlling for the effects of other continuous variables (e.g., immersion times and fiber content).
By using ANCOVA, we can gain valuable insights into the differences in mass gain caused by the different types of water, considering the effects of other factors simultaneously (). This comprehensive approach enhances the model’s accuracy and allows us to make more robust predictions based on the type of water used in the experiments.
Let us now incorporate the influence of the type of water in our model. To accommodate variations from using different types of water such as distilled water, rainwater, or seawater, we will introduce an indicator variable, also known as a dummy variable.
By including this qualitative effect through the dummy variable (denoted as D), our multiple regression models takes on the following form:
Here, D will take a value of 0 to represent distilled water and a value of 1 for rainwater or seawater.
To determine the overall adequacy of our model and assess the significance of the dummy variable, we applied both ANOVA (Analysis of Variance) and Student’s t-test at a significance level of ∝ = 0.05.
The t-test was conducted specifically on the last coefficient, denoted as , which corresponds to the dummy variable D. This t-test allowed us to test two null hypotheses:
Null Hypothesis (H0): This hypothesis posits that the type of water does not significantly affect the outcome. In other words, it suggests that the two regression models are equivalent and yield similar fitted surfaces (
).
If we reject the null hypothesis, we would instead support the alternative hypothesis (H1):
This indicates that the type of water has a significant impact on the mass gain ().
The two fitted surfaces are then distinguished by an offset
To calculate the t-value, we used the regression coefficients () and their corresponding standard errors (
) for
The computed t-value was then compared to a critical t-value with
degrees of freedom at ∝ = 0.05.
Upon applying the t-test to both the distilled water and seawater estimation data, we found that the effect of the dummy variable was statistically significant. The t-test on yielded a t-value of 11.0427, which exceeded the critical t-value,
(at ∝ = 0.05). As a result, we rejected the null hypothesis (H0), indicating that the coefficient
significantly contributed to the model at the specified threshold.
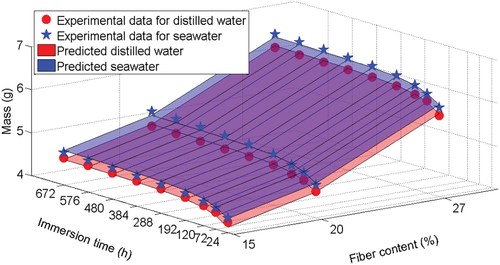
The resulting regression model, based on this analysis, is:
This model reveals that the fitted surfaces for distilled water and seawater are distinct, with an offset represented by the differential intercept coefficient , as illustrated in .
Figure 12. Prediction of mass gain by the global linear regression model using distilled water and seawater estimation data.
Additionally, the ANOVA test () confirms the adequacy of equation (X) with an F-value of 1322, surpassing the critical F-value of 2.409 (at ∝ = 0.05). Moreover, the model exhibits an R-squared value of , indicating a strong fit.
Table 5. ANOVA table for the linear regression model included dummy variable (distillated water vs seawater).
The mass gain between distilled water and rainwater for the estimation data was further compared using the Student’s t-test. The change in mass gain was found to be significant, as the t-test on resulted in a t-value of −10.14, less than the critical t-value of −2.009 (
at
. As a result, we rejected the null hypothesis (H0), signifying that rainwater had a significant impact on mass gain compared to distilled water.
The global regression model obtained from this comparison is:
This model demonstrates that the fitted surfaces for distilled water and rainwater exhibit a noticeable difference in their intercepts, which is represented by the coefficient , as depicted in .
Figure 13. Prediction of mass gain by the global linear regression model using distilled water and rainwater estimation data.
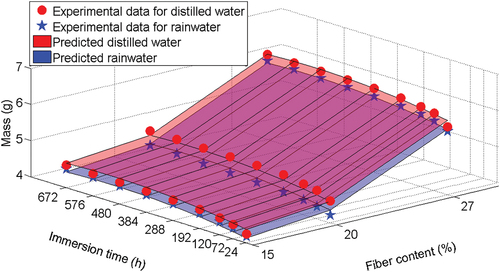
Similarly, the ANOVA test () affirms the adequacy of equation (XI) with an F-value of 830.84, surpassing the critical F-value of (at ∝ = 0.05). Additionally, the model exhibits an R-squared value of
, indicating a high level of accuracy in predictions.
Table 6. ANOVA table for the regression model included dummy variable (distilled water vs rainwater).
depict a comparison of experimental vs. predicted mass gain using validation data for distilled water-rainwater and distilled water-seawater, respectively. Both models demonstrate strong fits to the validation data, as indicated by high R-squared values of and
for rainwater and seawater, respectively. These results confirm the model’s ability to accurately predict mass gain under various water conditions.
Figure 14. Prediction of mass gain by the global reciprocal model using distilled water and rainwater validation data.
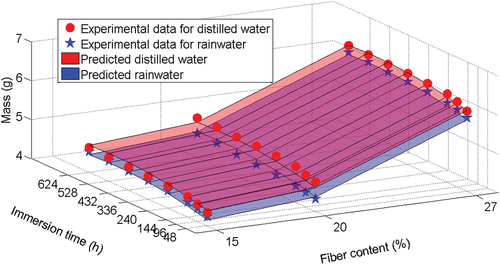
Figure 15. Prediction of mass gain by the global linear regression model using distilled water and seawater validation data.
Reciprocal model
Let’s explore the more straightforward scenario, which involves a basic reciprocal model with first-order interaction terms. The mathematical representation of this specific model is as follows:
Upon conducting the estimation of the equation (XII), it transforms into the following form:
After analyzing , it becomes clear that the model represented by equation (XIII) is insufficient. This conclusion is drawn from the calculated F-value (F = 0.9098), which is lower than the critical F-value () at a significance level of 5%.
Table 7. ANOVA table for the simple regression model with interaction.
Let’s proceed with a more in-depth analysis of the model containing second-order terms, presented in equation (XIV). By eliminating the non-significant terms, the revised model equation becomes:
The ANOVA test results, as shown in , validate the suitability of equation (XIV) with a significant F-value of 11,818.18, well surpassing the critical F-value of 2.817 (at α = 0.05).
Table 8. ANOVA table for the second order reciprocal model.
Furthermore, the model demonstrates a high R-squared value of , indicating a robust fit.
The incorporation of the reciprocal model now extends to encompass the influence of different water types. To account for the variations introduced by using distinct water types such as distilled water, rainwater, or seawater, a novel approach is adopted by introducing an indicator variable within a global model, as previously demonstrated. This qualitative effect is seamlessly integrated using a dummy variable, enabling the reciprocal model (Equation XV) to take on the following form:
Upon subjecting both the distilled water and seawater estimation data to a t-test, the impact of the dummy variable becomes evident. The t-test conducted on yielded a t-value of 14.67, which exceeded the critical t-value,
(at ∝ = 0.05). Consequently, the null hypothesis (H0) is rejected, indicating that the coefficient
significantly contributed to the model at the specified threshold.
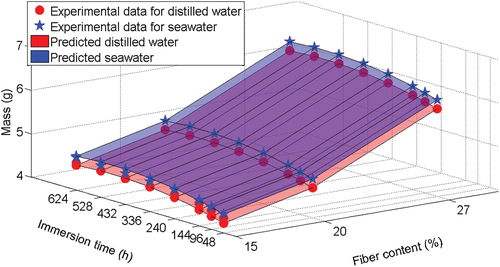
The resulting regression model derived from this analysis is:
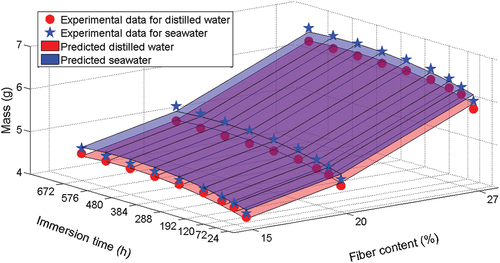
This model unveils distinctive fitted surfaces for distilled water and seawater, characterized by an offset represented by the differential intercept coefficient , as depicted in .
Figure 16. Prediction of mass gain by the global reciprocal model using distilled water and seawater estimation data.
Further validation is offered through ANOVA test results, as showcased in . These results affirm the appropriateness of equation (XVI) with a notably significant F-value of 2454.074, surpassing the critical F-value of 2.409 (at α = 0.05). Additionally, the model’s robust fit is underscored by a high R-squared value of .
Table 9. ANOVA table for the global reciprocal model using distilled water and seawater estimation data.
Proceeding to analyze the distilled water and rainwater estimation data, a similar t-test on unveils a t-value of −11.28. This value is lower than the critical t-value of
(at α = 0.05), leading to the rejection of the null hypothesis (H0) and signifying the significant contribution of the coefficient
to the model.
The derived regression model from this analysis is:
This model’s visualization reveals distinct fitted surfaces for distilled water and rainwater, marked by an offset characterized by a value , as illustrated in . The reliability of equation (XVII) is further demonstrated by ANOVA test outcomes presented in . These results showcase a significant F-value of 1037.44, surpassing the critical F-value of 2.409 (at α = 0.05).
Figure 17. Prediction of mass gain by the global reciprocal model using distilled water and rainwater estimation data.
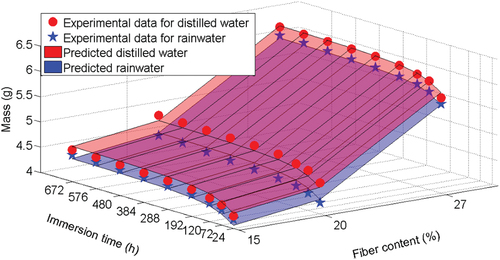
Table 10. ANOVA table for the global reciprocal model using distilled water and rainwater estimation data.
Incorporating these findings, illustrates the prediction of mass gain using the global reciprocal model based on distilled water and rainwater estimation data. This visual depiction reinforces the model’s capability to capture distinct behaviors and underscores the potency of the reciprocal model’s predictive capabilities across various scenarios.
Conducting a comprehensive comparative evaluation, the predictive accuracy of two distinct models – the linear regression model and the reciprocal model – has been rigorously scrutinized. This thorough assessment encompasses various statistical criteria, as detailed in the following figures:
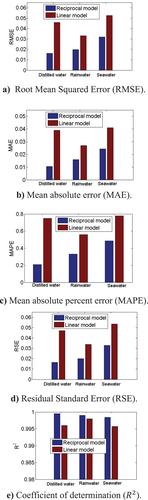
meticulously examines accuracy evaluation of the prediction performance of the proposed models for each water type, solely utilizing estimation data. The reciprocal and linear models undergo detailed analysis across essential statistical metrics, encompassing Root Mean Squared Error (RMSE, ), Mean Absolute Error (MAE, ), Mean Absolute Percent Error (MAPE, ), Residual Standard Error (RSE, ), and the coefficient of determination (, ). The Reciprocal model consistently outperforms the linear model across these metrics, providing a more robust prediction of mass gain across diverse water types. Notably, the reciprocal model showcases a significantly lower RMSE across all water types, underscoring its ability to provide more precise predictions.
Figure 18. Statistical criteria for model evaluation (estimation data by water type).
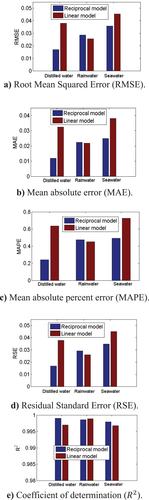
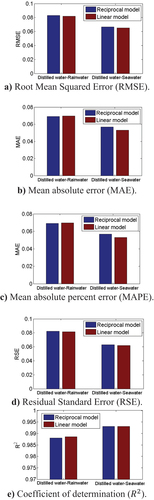
Simultaneously, extend accuracy assessment to different water types using validation data. The reciprocal and linear models are subjected to the same array of statistical criteria, consistently highlighting the reciprocal model’s superior performance. Its capacity to offer more precise mass gain predictions across various water types is consistently evident through its higher accuracy in comparison to the linear model. The distinct advantage of the reciprocal model is notably visible in its consistently lower MAPE values compared to the linear model, underscoring its heightened accuracy.
Figure 19. Statistical criteria for model evaluation (validation data by water type).
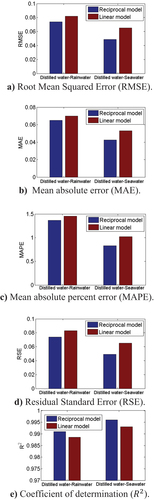
adopt an innovative approach, used a glob model that designating distilled water as the reference model. It assesses the reciprocal and linear global models within the context of Distilled water-Rainwater and Distilled water -Seawater scenarios. This profound evaluation accentuates the reciprocal model’s dominance in capturing nuanced mass gain fluctuations, even when considering distinct water types. The comprehensive metrics presented consistently support the reciprocal global model’s accuracy, establishing its superiority over the linear global model in both scenarios. These figures also mirror the trends seen in the Residual Standard Error (RSE) values, further emphasizing the reciprocal model’s robust predictive capabilities.
Figure 20. Statistical criteria for global model evaluation (estimation data).
In line with expand the analysis to a broader context, evaluating the Distilled water-Rainwater and Distilled water-Seawater pairs using validation data. Echoing the pattern, the global reciprocal model maintains its superior performance, underscoring its robust predictive capabilities across diverse water types. Furthermore, the visual congruence with the Mean Absolute Percent Error (MAPE) values reinforces the reciprocal model’s consistent and superior predictive accuracy across diverse water types.
Figure 21. Statistical criteria for global model evaluation (validation data).
In summary, this meticulous analysis of the tables underscores the reciprocal model’s steadfast dominance in predicting mass gain for Date Palm Fiber composites. Its propensity for heightened accuracy and superior fits across various water types, under both estimation and validation conditions, reaffirms its significance for applications requiring precise control over water absorption properties. These detailed statistical insights provide a comprehensive elucidation of the models’ performances and their consequent implications for practical implementation.
Conclusion
In this investigation, an extensive assessment of the water absorption behavior of Date Palm Fiber (DPF) composites was undertaken, leading to the following key conclusions:
The significant impact of fiber content on mass gain in DPF composites highlights its dominance in water absorption behavior.
Immersion time and water type play secondary roles, emphasizing the need for optimal fiber content during composite fabrication.
Saturation behavior observed in average mass gain underscores the pivotal roles of immersion time and fiber content in water absorption kinetics.
Second-order regression models, including a water type dummy variable, successfully capture relationships, enhancing predictive accuracy.
The superior predictive capabilities of a reciprocal model with interactions across different water types offer nuanced insights.
The study contributes to a comprehensive understanding of DPF composite water absorption behavior, enabling tailored material design.
Rigorous statistical analyses establish a robust foundation for optimizing composite design for desired water absorption characteristics.
Moving forward, this study lays the groundwork for future research in Date Palm Fiber (DPF) composites, offering a strong basis for further investigations. Prospective studies could fine-tune matrix properties for specific water absorption modulation, explore extended durability under water exposure, and examine hybrid composites for synergistic effects. Advanced microscopy and spectroscopy could unveil microstructural changes during water absorption. These insights hold engineering relevance, guiding the development of water-resistant DPF composites for eco-friendly material applications.
Highlights
Comprehensive analysis of DPF composite water absorption.
Dominance of fiber content in shaping water behavior.
Immersion time and water type’s secondary roles.
Saturation behavior highlights immersion-fiber interplay.
Advanced regression models enhance predictive accuracy.
wjnf_a_2375530_sm0991.docx
Download MS Word (15.4 KB)wjnf_a_2375530_sm0993.docx
Download MS Word (12.7 KB)wjnf_a_2375530_sm0990.docx
Download MS Word (13.8 KB)wjnf_a_2375530_sm0992.docx
Download MS Word (20.8 KB)Acknowledgments
This research is supported by PRFU Project-N° A11N01UN280120220001 organized by the Algerian Ministry of Higher Education and Scientific Research (MESRS). The authors would like to thank Mr. Belkacem Aoufi Assistant Engineer University of M’sila, Faculty of Technology. The authors also extend their gratitude to Researchers Supporting Project number (RSP2024R117) King Saud University, Riyadh, Saudi Arabia for funding this work.
Disclosure statement
No potential conflict of interest was reported by the author(s).
Additional information
Funding
References
- AL-Oqla, F., M. Mohammed, T. Hayajneh, and N. Nawafleh. 2023. “Advanced Synthetic and Biobased Composite Materials in Sustainable Applications: A Comprehensive Review.” Emergent Materials 6:809–29. https://doi.org/10.1007/s42247-023-00478-z.
- Alshahrani, H., B. A. Alshammari, A. Hussain Shah, and A. Qadeer Dayo. 2022. “Development of Hybrid Composite Utilizing Micro-Cellulose Fibers Extracted from Date Palm Rachis in the Najran Region.” Polymers 14 (21): 4687.
- Amroune, S., A. Bezazi, A. Dufresne, F. Scarpa, and A. Imad. 2022. “Investigation on Microstructure, Tensile Properties and Fatigue Characterization of Porous Date Palm Fiber.” Journal of Natural Fibers 19 (17): 15751–15764. https://doi.org/10.1080/15440478.2022.2134255.
- Anbukarasi, K., and S. Kalaiselvam. 2015. “Study of Effect of Fibre Volume and Dimension on Mechanical, Thermal, and Water Absorption Behaviour of Luffa Reinforced Epoxy Composites.” Materials & Design 66:321–330. https://doi.org/10.1016/j.matdes.2014.10.078.
- Andrew, J. J., and H. N. Dhakal. 2022. “Sustainable Biobased Composites for Advanced Applications: Recent Trends and Future Opportunities–A Critical Review.” Composites Part C Open Access 7:100220. https://doi.org/10.1016/j.jcomc.2021.100220.
- Bachchan, A. A., P. Pratim Das, and V. Chaudhary. 2022. “Effect of Moisture Absorption on the Properties of Natural Fiber Reinforced Polymer Composites: A Review.” Materials Today: Proceedings, 49:3403–3408. https://doi.org/10.1016/j.matpr.2021.02.812.
- Balaji, A., S. Kannan, R. Purushothaman, S. Mohanakannan, A. Haja Maideen, J. Swaminathan, B. Karthikeyan, and P. Premkumar. 2024. “Banana Fiber and Particle-Reinforced Epoxy Biocomposites: Mechanical, Water Absorption, and Thermal Properties Investigation.” Biomass Conversion and Biorefinery 14:7835–7845. https://doi.org/10.1007/s13399-022-02829-y.
- Barreira-Pinto, R., R. Carneiro, M. Miranda, and R. Miranda Guedes. 2023. “Polymer-Matrix Composites: Characterising the Impact of Environmental Factors on Their Lifetime.” Materials 16 (11): 3913.
- Benyettou, R., S. Amroune, S. Mohamed, Y. Seki, and A. Dufresne. 2022. “Experimental Investigation of the Absorption Behavior of Date Palm Fiber Reinforced Iso-Polyester Composites: Artificial Neuron Network (ANN) Modeling.” Journal of Natural Fibers 19 (17): 15902–15918.
- Benyettou, R., S. Amroune, M. Slamani, Y. Seki, A. Dufresne, M. Jawaid, and S. Alamery. 2022. “Assessment of Induced Delamination Drilling of Natural Fiber Reinforced Composites: A Statistical Analysis.” Journal of Materials Research and Technology 21:131–152. https://doi.org/10.1016/j.jmrt.2022.08.161.
- Bhaskaran, S. K., K. Boga, R. Arukula, and S. Kumar Gaddam. 2023. “Natural Fibre Reinforced Vegetable-Oil Based Polyurethane Composites: A Review.” Journal of Polymer Research 30 (8): 325.
- Bhuvaneswari, V., B. A. Balaji Devarajan, R. Mahendran, S. Rajkumar, S. Sharma, K. Mausam, C. Li, and E. Tag Eldin. 2022. “A Critical Review on Hygrothermal and Sound Absorption Behavior of Natural-Fiber-Reinforced Polymer Composites.” Polymers 14 (21): 4727.
- Boey, J. Y., S. Baidurah Yusoff, and G. Seng Tay. 2022. “A Review on the Enhancement of composite’s Interface Properties Through Biological Treatment of Natural Fibre/Lignocellulosic Material.” Polymers & Polymer Composites 30:09673911221103600.
- Boey, J. Y., C. Keong Lee, and G. Seng Tay. 2022. “Factors Affecting Mechanical Properties of Reinforced Bioplastics: A Review.” Polymers 14 (18): 3737. https://doi.org/10.3390/polym14183737.
- Bollino, F., V. Giannella, E. Armentani, and R. Sepe. 2023. “Mechanical Behavior of Chemically-Treated Hemp Fibers Reinforced Composites Subjected to Moisture Absorption.” Journal of Materials Research and Technology 22:762–775. https://doi.org/10.1016/j.jmrt.2022.11.152.
- Chakkour, M., M. Ould Moussa, I. Khay, M. Balli, and T. Ben Zineb. 2023. “Effects of Humidity Conditions on the Physical, Morphological and Mechanical Properties of Bamboo Fibers Composites.” Industrial Crops and Products 192:116085. https://doi.org/10.1016/j.indcrop.2022.116085.
- Chen, R. S., S. Ahmad, and S. Gan. 2016. “Characterization of Rice Husk-Incorporated Recycled Thermoplastic Blend Composites.” Bio Resources 11 (4): 8470–8482.
- Haba, B., F. Benali, M. Jawaid, and A. Lopes Leao. 2022. “A Review on Gypsum-Based Composites Reinforced with Palm Fibers in Construction Applications.” International Journal of Thermophysics 43 (11): 164.
- Haddar, M., Y. Ben Slim, and S. Koubaa. 2022. “Mechanical and Water Absorption Behavior of Thermoset Matrices Reinforced with Natural Fiber.” Polymer Composites 43 (6): 3481–3495.
- Huner, U. 2015. “Effect of Water Absorption on the Mechanical Properties of Flax Fiber Reinforced Epoxy Composites.” Advances in Science and Technology Research Journal 9 (26): 1–6.
- Hussnain, S. M., S. Z. H. Shah, P. S. M. Megat-Yusoff, and M. Z. Hussain. 2023. “Degradation and Mechanical Performance of Fibre-Reinforced Polymer Composites Under Marine Environments: –A Review of Recent Advancements.” Polymer Degradation and Stability 215:110452. https://doi.org/10.1016/j.polymdegradstab.2023.110452.
- Jagadeesh, P., M. Puttegowda, P. Boonyasopon, S. Mavinkere Rangappa, A. Khan, and S. Siengchin. 2022. “Recent Developments and Challenges in Natural Fiber Composites: A Review.” Polymer Composites 43 (5): 2545–2561.
- Jothibasu, S., S. Mohanamurugan, R. Vijay, D. Lenin Singaravelu, A. Vinod, and M. R. Sanjay. 2020. “Investigation on the Mechanical Behavior of Areca Sheath Fibers/Jute Fibers/Glass Fabrics Reinforced Hybrid Composite for Light Weight Applications.” Journal of Industrial Textiles 49 (8): 1036–1060.
- Karim, A., M. Ramzan, D. Tahir, K. Imran Khan, A. Hussain, E. Ul Haq, and M. Sohail Malik. 2023. “Improved Mechanical and Water Absorption Properties of Epoxy-Bamboo Long Natural Fibres Composites by Eco-Friendly Na2CO3 Treatment.” Plastics, Rubber & Composites 52 (2): 114–127.
- Lu, M. M., C. A. Fuentes, and A. Willem Van Vuure. 2022. “Moisture Sorption and Swelling of Flax Fibre and Flax Fibre Composites.” Composites Part B Engineering 231:109538. https://doi.org/10.1016/j.compositesb.2021.109538.
- Lv, C., and J. Liu. 2023. “Alkaline Degradation of Plant Fiber Reinforcements in Geopolymer: A Review.” Molecules 28 (4): 1868.
- Mahdi, E., D. R. Hernández, and E. O. Eltai. 2015. “Effect of Water Absorption on the Mechanical Properties of Long Date Palm Leaf Fiber Reinforced Epoxy Composites.” Journal of Biobased Materials and Bioenergy 9 (2): 173–181.
- Mahdi, E., D. R. Hernández Ochoa, A. Vaziri, A. Dean, and M. Kucukvar. 2021. “Khalasa Date Palm Leaf Fiber As a Potential Reinforcement for Polymeric Composite Materials.” Composite Structures 265:113501. https://doi.org/10.1016/j.compstruct.2020.113501.
- Mahdi, E., D. Ochoa, A. Vaziri, and E. Eltai. 2019. “Energy Absorption Capability of Date Palm Leaf Fiber Reinforced Epoxy Composites Rectangular Tubes.” Composite Structures 224:111004. https://doi.org/10.1016/j.compstruct.2019.111004.
- Mantaiah, S., and V. Kumar. 2022. “Water Absorption Behavior and Its Effect on Static Mechanical and Dynamic Mechanical Properties of Flax Fabric Reinforced Epoxy Composites.” Journal of Natural Fibers 19 (15): 12415–12433.
- Masoodi, R., and K. M. Pillai. 2012. “A Study on Moisture Absorption and Swelling in Bio-Based Jute-Epoxy Composites.” Journal of Reinforced Plastics & Composites 31 (5): 285–294.
- Maurya, A. K., and G. Manik. 2023. “Advances Towards Development of Industrially Relevant Short Natural Fiber Reinforced and Hybridized Polypropylene Composites for Various Industrial Applications: A Review.” Journal of Polymer Research 30 (1): 47.
- Mohammed, M., A. Ja’afar Mohamad Jawad, A. M. Mohammed, J. K. Oleiwi, T. Adam, A. F. Osman, O. S. Dahham, B. O. Betar, S. C. Gopinath, and M. Jaafar. 2023. “Challenges and Advancement in Water Absorption of Natural Fiber-Reinforced Polymer Composites.” Polymer testing 124:108083. https://doi.org/10.1016/j.polymertesting.2023.108083.
- Mohammed, M., R. Rahman, A. M. Mohammed, T. Adam, B. O. Betar, A. F. Osman, and O. S. Dahham. 2022. “Surface Treatment to Improve Water Repellence and Compatibility of Natural Fiber with Polymer Matrix: Recent Advancement.” Polymer Testing 115:107707. https://doi.org/10.1016/j.polymertesting.2022.107707.
- Mohammed, M., R. Rahman, A. M. Mohammed, B. O. Betar, A. F. Osman, T. Adam, O. S. Dahham, and S. C. Gopinath. 2022. “Improving Hydrophobicity and Compatibility Between Kenaf Fiber and Polymer Composite by Surface Treatment with Inorganic Nanoparticles.” Arabian Journal Chemistry 15 (11): 104233.
- Mohanavel, V., T. Sathish, S. Dinesh Kumar, M. Ravichandran, S. Suresh Kumar, S. Rajkumar, and R. Subbiah. 2022. “Investigation of Mechanical Strength and Weight Fraction of Date Palm Fibre Hybrid Composites Reinforced with Polyethylene.” Paper Presented at the Materials Science Forum.
- Moujoud, Z., S. Sair, H. Ait Ousaleh, I. Ayouch, A. El Bouari, and O. Tanane. 2023. “Geopolymer Composites Reinforced with Natural Fibers: A Review of Recent Advances in Processing and Properties.” Construction and Building Materials 388:131666. https://doi.org/10.1016/j.conbuildmat.2023.131666.
- Nanda, J., S. Narayan Das, and A. Mohapatra. 2022. “Compressive Characterization of Date Palm Leaf Fiber.” Journal of Natural Fibers 19 (15): 9813–9826.
- Neto, J., H. Queiroz, R. Aguiar, R. Lima, D. Cavalcanti, and M. Doina Banea. 2022. “A Review of Recent Advances in Hybrid Natural Fiber Reinforced Polymer Composites.” Journal of Renewable Materials 10 (3): 561.
- Nosbi, N., H. Md Akil, Z. Arifin Mohd Ishak, and A. Abu Bakar. 2011. “Behavior of Kenaf Fibers After Immersion in Several Water Conditions.” Bio Resources 6 (2): 950–960.
- Oun, A., A. Manalo, O. Alajarmeh, R. Abousnina, and A. Gerdes. 2022. “Long-Term Water Absorption of Hybrid Flax Fibre-Reinforced Epoxy Composites with Graphene and Its Influence on Mechanical Properties.” Polymers 14 (17): 3679.
- Patel, R. V., A. Yadav, and J. Winczek. 2023. “Physical, Mechanical, and Thermal Properties of Natural Fiber-Reinforced Epoxy Composites for Construction and Automotive Applications.” Applied Sciences 13 (8): 5126.
- Perera, H., and H. Banu. 2022. “Recent Developments in Composite Reinforcement Using Date Palm Fibers for Improved Performance Through Physical and Chemical Modifications.” International Journal of Polymer Analysis and Characterization 27 (7): 446–463.
- Praveena, B. A., N. S. Abdulrajak Buradi, V. Kedambadi Vasu, J. Hatgundi, and D. Huliya. 2022. “Study on Characterization of Mechanical, Thermal Properties, Machinability and Biodegradability of Natural Fiber Reinforced Polymer Composites and Its Applications, Recent Developments and Future Potentials: A Comprehensive Review.” Materials Today: Proceedings, 52:1255–1259. https://doi.org/10.1016/j.matpr.2021.11.049.
- Rajkumar, G., J. Srinivasan, and L. Suvitha. 2015. “Natural Protein Fiber Hybrid Composites: Effects of Fiber Content and Fiber Orientation on Mechanical, Thermal Conductivity and Water Absorption Properties.” Journal of Industrial Textiles 44 (5): 709–724.
- Rakesh, P. K., L. Ranakoti, and M. Kumar Gupta. 2023. “6 Mechanical Properties of Chemically Treated Cellulosic Fiber-Reinforced Polymer Composites.” In Cellulose Composites: Processing and Characterization, 151. Vol. 15. https://doi.org/10.1515/9783110768787-006.
- Refaai, M. R. A., R. Meenakshi Reddy, M. Indra Reddy, B. Khan, V. Nagaraju, and S. Praveen Kumar. 2022. “Investigation on Physical and Mechanical Characteristics of Date Palm Fiber Reinforced Aliphatic Epoxy Hybrid Composites.” Advances in Polymer Technology 2022:11. https://doi.org/10.1155/2022/4916499.
- Riyadh, B., S. Amroune, M. Slamani, K. Saada, H. Fouad, M. Jawaid, and S. Sikdar. 2023. “Modelling and Optimization of the Absorption Rate of Date Palm Fiber Reinforced Composite Using Response Surface Methodology.” Alexandria Engineering Journal 79:545–555. https://doi.org/10.1016/j.aej.2023.08.042.
- Saaidia, A., A. Belaadi, M. Boumaaza, H. Alshahrani, and M. Bourchak. 2023. “Effect of Water Absorption on the Behavior of Jute and Sisal Fiber Biocomposites at Different Lengths: ANN and RSM Modeling.” Journal of Natural Fibers 20 (1): 2140326.
- Sadek, M. G., M. Y. Abdellah, and G. T. Abdel-Jaber. 2024. “A Review on Properties, Applications and Feasibility Study of Date Palm Fiber-Reinforced Polymer Composites.” SVU-International Journal of Engineering Sciences and Applications 5 (2): 50–61.
- Sahu, P., and M. K. Gupta. 2022. “Water Absorption Behavior of Cellulosic Fibres Polymer Composites: A Review on Its Effects and Remedies.” Journal of Industrial Textiles 51 (5_suppl): 7480S–7512S.
- Sanjeevi, S., V. Shanmugam, S. Kumar, V. Ganesan, G. Sas, D. Joel Johnson, M. Shanmugam, A. Ayyanar, K. Naresh, and R. Esmaeely Neisiany. 2021. “Effects of Water Absorption on the Mechanical Properties of Hybrid Natural Fibre/Phenol Formaldehyde Composites.” Scientific Reports 11 (1): 13385.
- Sarmin, S. N., M. Jawaid, S. Ahmad Zaki, A. Mohd Radzi, H. Fouad, R. Khiari, S. Rahayu, and M. Hazim Mohamad Amini. 2023. “Enhancing the Properties of Date Palm Fibre Reinforced Bio-Epoxy Composites with Chitosan–Synthesis, Mechanical Properties, and Dimensional Stability.” Journal of King Saud University-Science 35 (7): 102833. https://doi.org/10.1016/j.jksus.2023.102833.
- Sathish, S., N. Karthi, L. Prabhu, S. Gokulkumar, D. Balaji, N. Vigneshkumar, T. S. Ajeem Farhan, A. AkilKumar, and V. P. Dinesh. 2021. “A Review of Natural Fiber Composites: Extraction Methods, Chemical Treatments and Applications.” Materials Today: Proceedings 45:8017–8023. https://doi.org/10.1016/j.matpr.2020.12.1105.
- Simon, M., R. Fulchiron, and F. Gouanvé. 2022. “Water Sorption and Mechanical Properties of Cellulosic Derivative Fibers.” Polymers 14 (14): 2836.
- Singh, M. K., R. Tewari, S. Zafar, S. Mavinkere Rangappa, and S. Siengchin. 2022. “A Comprehensive Review of Various Factors for Application Feasibility of Natural Fiber-Reinforced Polymer Composites.” Results in Materials 100355. https://doi.org/10.1016/j.rinma.2022.100355.
- Singha, A. S., and V. K. Thakur. 2008. “Mechanical Properties of Natural Fibre Reinforced Polymer Composites.” Bulletin of Materials Science 31:791–799. https://doi.org/10.1007/s12034-008-0126-x.
- Vallejos, M. E., F. Vilaseca, J. A. Méndez, F. X. Espinach, R. J. Aguado, M. Delgado-Aguilar, and P. Mutjé. 2023. “Response of Polypropylene Composites Reinforced with Natural Fibers: Impact Strength and Water-Uptake Behaviors.” Polymers 15 (4): 900.
- Wang, J., Y. Li, T. Yu, Q. Li, and Z. Li. 2022. “Anisotropic Behaviors of Moisture Absorption and Hygroscopic Swelling of Unidirectional Flax Fiber Reinforced Composites.” Composite Structures 297:115941. https://doi.org/10.1016/j.compstruct.2022.115941.
- Wu, F., Q. Yu, and X. Chen. 2023. “Unleashing the Potential of Bio-Based Concrete: Investigating Its Long-Term Mechanical Strength and Drying Shrinkage in Real Climatic Environments.” Cement and Concrete Composites 143:105237. https://doi.org/10.1016/j.cemconcomp.2023.105237.
- Zahari, W. Z. W., R. N. R. L. Badri, H. Ardyananta, D. Kurniawan, and F. M. Nor. 2015. “Mechanical Properties and Water Absorption Behavior of Polypropylene/Ijuk Fiber Composite by Using Silane Treatment.” Procedia Manufacturing 2:573–578. https://doi.org/10.1016/j.promfg.2015.07.099.
- Zou, Y., W. Zhang, H. Chen, and H. Cheng. 2023. “Investigating the Moisture Absorption Behavior of Bamboo Fiber-Reinforced Epoxy Composites by Modelling.” Bio Resources 18 (1): 272.