
 ?Mathematical formulae have been encoded as MathML and are displayed in this HTML version using MathJax in order to improve their display. Uncheck the box to turn MathJax off. This feature requires Javascript. Click on a formula to zoom.
ABSTRACT
This study aims to enhance the mechanical properties of date palm fibers (DPFs) by implementing a targeted treatment technique. The response surface methodology (RSM) is utilized for modeling and optimizing. The study seeks to identify the optimal Alkaline treatment settings for improving the mechanical properties of DPFs by carefully analyzing parameters such as average diameter, time, and NaOH concentration. The analytical results offer valuable insights into the possible use of DPFs in many engineering applications, contributing to the industrial advancement of sustainable and eco-friendly materials. The experimental findings are analyzed using a full-factorial design (43), incorporating analysis of variance and RSM. Combining RSM and desirability function is used to get the best mechanical properties, including stress, strain, and Young’s modulus. The model appropriateness is evaluated by analyzing residual values. The findings suggest that the sodium hydroxide concentration (%NaOH) has the most significant impact on strain (11.63%), stress (12%), and Young’s modulus (11.72%) besides the time t (h) also significantly influences 6.01%, 6.26%, and 5.79% strain, stress, and Young’s modulus, respectively.
摘要
本研究旨在通过实施有针对性的处理技术来提高椰枣纤维的力学性能. 响应面方法(RSM)用于建模和优化. 该研究旨在通过仔细分析平均直径、时间和NaOH浓度等参数,确定改善DPF机械性能的最佳碱性处理设置. 分析结果为DPF在许多工程应用中的可能用途提供了宝贵的见解,有助于可持续和环保材料的工业进步. 实验结果采用全因子设计(43)进行分析,结合方差分析和RSM. 结合RSM和期望函数来获得最佳的力学性能,包括应力、应变和杨氏模量. 通过分析残差值来评估模型的适用性. 研究结果表明,氢氧化钠浓度(%NaOH)对应变(11.63%)、应力(12%)和杨氏模量(11.72%)的影响最为显著,此外时间t(h)也分别显著影响6.01%、6.26%和5.79%的应变、应力和杨氏模量.
Introduction
Lately, fiber-reinforced composites have been gaining momentum in the manufacturing industry (Blythe et al. Citation2022; Chai et al. Citation2023). In particular, date palm fibers (DPFs), stemming from natural and renewable resources (Lalaymia et al. Citation2024), have received massive attention due to their high tensile strength, low density, and biodegradability (Al-Oqla et al. Citation2014; Dhakal et al. Citation2018; Ghori et al. Citation2018). Various treatment processes have been made to exploit the DPFs benefits fully, enhancing their mechanical properties. In this study, particular attention is paid to modeling and optimizing the treatment process in order to further improve the mechanical characteristics of DPFs. The DPFs’ mechanical properties are essential, especially considering their potential engineering applications.
By enhancing their tensile strength, flexibility, and durability, the fibers become a promising alternative to conventional materials in sectors like construction (Balakrishnan et al. Citation2024; Crini et al. Citation2020; Sunny and Rajan Citation2022), automotive (Ashori Citation2008; Friedrich and Almajid Citation2013; Siakeng et al. Citation2019), packaging (Johansson et al. Citation2012; Mahardika et al. Citation2024; Šišková et al. Citation2021), sports and recreation industry (Ali, Rohit, and Dixit Citation2023; Malkar et al. Citation2023; Subie, Mouritz, and Troynikov Citation2009). Another sector where natural fibers are increasingly used is the textile and fashion industry (Adnan Ali and Imran Sarwar Citation2010; Senthil Kumar and Suganya Citation2017; Matthes et al. Citation2021 and the manufacturing of furniture and interior design products (Azman et al. Citation2021; Dahy Citation2017; Hayles Citation2015).
Multiple studies have focused on investigating natural fibers and their optimization using the response surface methodology (RSM). Haji and Rahimi (Haji and Rahimi Citation2022) optimized the dyeing process of wool with Berberis thunbergii DC leaves, aiming to develop a sustainable coloration method. They used RSM to vary dye concentration, dyebath temperature, pH, and mordant concentration to maximize color strength (K/S). They identified the optimal conditions (pH 5, 146% of dye concentration, 76°C dyeing temperature, and 3.8% of mordant concentration) for achieving the highest K/S. The dyed wool under these conditions exhibited good color fastness properties, offering a potential eco-friendly alternative for textile dyeing.
Saada, Farsi, et al. (Citation2024) investigated the correlation between the density of natural fiber filling (10%, 15%, 25%) and its influence on the flexural properties of polymer compounds that are strengthened with Diss, Sisal, and Luffa fibers. They used sophisticated methods such as fiber analysis and Fourier transform infrared spectroscopy. They indicated that a filling density of 25% leads to the maximum stress values (25.61 MPa, 22.21 MPa, and 20.88 MPa) for Diss, Sisal, and Luffa compounds, respectively, promoting strong bonding in Diss-reinforced polymers. The artificial neural network (ANN) model exhibited exceptional predictive capacity, with correlation values surpassing 0.99 for stress and displacement, hence outperforming RSM. The analysis of variance (ANOVA) highlights the influence of sample section parameters and fiber rate on stress, confirming the importance of type parameters and fiber rate on displacement.
Mahfoudhi et al. (Citation2015) optimized the extraction of colorant from Tamarix aphylla L. Karst leaves using RSM. They explored the combined effects of extraction conditions: sodium hydroxide concentration (0.25 mol/L), extraction time (65 min), extraction temperature (88°C), and mass of leaves powder (52.5 g/L) on total phenolic content (1.12 g/L) and color yield (K/S, 11.20). They employed high-performance liquid chromatography to identify major phenolic compounds in the dye extract, such as gallic acid, quercetin, luteolin, and kaempferol.
Belaadi et al. (Citation2023) built upon a prior publication they released. Initially, they used RSM statistics to evaluate the flexural characteristics of a Washingtonia filifera (WF) fiber-reinforced plaster composite treated with sodium bicarbonate. They evaluated the data using an ANN technology. They predicted the flexural properties of an ecologically friendly gypsum biocomposite reinforced with both treated and untreated WF fibers, utilizing RSM and ANNs. They also presented a comparative approach between models predicted using RSM and ANNs. Statistical data such as root mean square error and coefficient of determination revealed that both ANN and RSM are excellent strategies for predicting the bending properties of plaster/WF biocomposites.
In another study started by (Imoisili et al. Citation2023), the researchers created a plantain fiber/multiwall carbon-nanotube reinforced hybrid nanocomposite using epoxy resin and modified the fiber surface with KMnO4-acetone to enhance adhesion. They used RSM and ANN to predict and optimize the impact strength, achieving an expected value of 44.54 kJ/m2. Experimental testing validated the approach, with impact strengths of 24.32 and 45.21 kJ/m2 for pristine and hybridized nanocomposite, respectively. The RSM-ANN technique proved effective in achieving desired mechanical properties efficiently and economically.
Recently a study started by Tablit et al. (Citation2024) explored the potential of Arundo donax L. as a reinforcing ingredient for polylactic acid/polypropylene waste blend three-dimensional (3D) printing filament. Their objective was to improve the compatibility between the fiber and polymer by chemically altering the Arundo fiber using alkali and silane treatments. The fibers that have not been treated and those that have not been treated are extruded with polymer blends for the specific purpose of 3D printing. They investigated the impact of chemical treatment on the composites’ thermal, mechanical, and morphological properties. The 3D-printed specimens underwent testing to determine their tensile strength, Izod impact resistance, and water absorption. They demonstrated that the alkali-treated and combination of alkali and silane-treated composites have promising features, including increased tensile strength and modulus, as well as retained stability in the Izod impact test, suggesting that integrating Arundo fibers did not impair performance. Scanning electron microscopy research validated these findings by indicating advantageous interfacial interactions between the matrix and fiber components, resulting in minimum spaces between them.
To achieve the necessary improvements, we used the RSM method, a powerful, cutting-edge statistical technique. This method enabled a systematic investigation and improvement of different treatment parameters, making it easier to identify the most efficient conditions for enhancing the mechanical performance of DPFs. The present study was to optimize the utilization of this natural resource by accurately managing these factors and promoting sustainable and eco-friendly solutions. This study not only presents the experimental set-up, technique and results obtained, but also highlights the originality of this approach in this field. The results obtained have made it possible to explore the importance of potential applications for treated DPFs in several industrial sectors. The ultimate purpose of this research was to provide significant insights into the utilization of DPFs as a feasible and environmentally beneficial option, therefore contributing to the growth of eco-friendly materials in engineering and beyond. In addition, this study focuses on modeling and optimizing the Alkaline treatment process to further improve the mechanical properties of DPFs. The mechanical properties of DPFs are essential, especially when considering their potential technical applications.
Materials and methods
Fibers’ preparation
The date palm (Phoenix dactylifera L.) fibers were used after obtaining them from the fruit bunch branch of the palm date, which was brought from the El-Hodna M’sila area in Algeria. The date fruit bunch was immersed in a water bath for 48 h to gain sufficient flexibility to extract the fibers. After immersion, the peeling stage followed to remove the outer part, making it easy to extract the fibers using a metal comb with lengths of up to 1.2 meters. They needed to undergo several chemical and thermal treatments to enhance the physical and mechanical properties of DPFs (Amroune et al. Citation2015, Citation2021). In fact, alkaline treatment interrupts the hydrogen bonding process in the fiber’s network structure, increasing its surface roughness. This operation removed some of the lignin, wax and oils covering the outer surface of the fiber cell wall, depolymerizing the cellulose and exposing the short-length crystallites. This treatment promoted ionization of the hydroxyl group to the alkoxide. Consequently, if better mechanical crossing is achieved, the increase in the amount of cellulose exposed on the fiber surface translates into an increase in the number of possible reaction sites (Mohanty, Misra, and Drzal Citation2001).
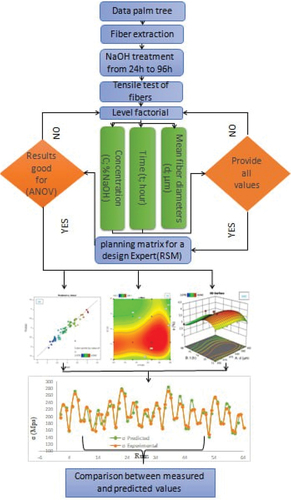
Additionally, all technical fibers were sourced from the same palm date to ensure statistically coherent data. Following fiber extraction, the fruit bunch branch of palm date (FBBPD) technical fibers were immersed in NaOH (alkaline) solutions with concentrations of 0.5%, 1%, 2%, and 3% for different durations, ranging from 12 to 96 h, at room temperature (23°C). Subsequently, the technical fibers were rinsed with tap water and dipped into a 1% sulfuric acid (H2SO4) concentration for 5 min. To remove impurities and modify their chemical state, the FBBPD fibers were immersed in distilled water for 15 min and then dried in an oven at 70°C for 5 h. Before testing, all technical fibers must be preserved in polyethylene bags to prevent moisture absorption ().
Figure 1. Date palm fibers (DPFs) preparation and experimental design.
Factors and levels used in the experimental plan
Within the scope of this study, various factors and levels were integrated into the experimental design to explore the parameters influencing the DPFs’ properties thoroughly. Three key factors were considered: the average fiber diameter, treatment time, and the percentage concentration of NaOH. Concerning the first factor, three levels were considered: a small, an average, and a large diameter. The levels were set as short, medium, and extended treatment time for the second factor. Finally, NaOH concentration, the third factor, was assessed through low, medium, and high concentration levels. This approach allows for systematically examining interactions between these factors and determining how each variation influences the fibers’ mechanical properties. The ultimate goal of exploring different combinations of factor levels is to identify optimal treatment conditions that maximize the DPFs’ mechanical performance. The results from this approach have the potential to significantly contribute to improving fibers’ features, paving the way for their application in various engineering fields and promoting the development of sustainable and environmentally friendly materials. lists the details of the variables used in the study. The mathematical models proposed for deformation (ε), tensile strength (σ), and Young’s modulus (E) are specifically designed for the four levels of fiber diameter, different levels of treatment duration, and various percentages of NaOH concentration illustrated in . The fiber diameters have been classified into four levels: 350 µm for Level 1, 450 µm for Level 2, 550 µm for Level 3, and 650 µm for Level 4. For each diameter level, a comprehensive series of tests was conducted to evaluate the mechanical properties. The results of these tests were then averaged to obtain representative responses for each level. Furthermore, the experimental conditions, including treatment durations and NaOH concentrations, were meticulously controlled. Treatment durations varied from 12 hours to 96 hours, while NaOH concentration percentages ranged from 0.5% to 3%. This systematic and controlled variation of experimental parameters ensures the robustness and reliability of the proposed mathematical models. Ultimately, these models provide a detailed understanding of mechanical behaviors based on different treatment conditions and material specifications.
Table 1. Factors and levels used in the experimental plan.
Results and discussion
Modeling of mechanical properties
presents the experimental data for various responses, encompassing mechanical characteristics, such as deformation ε (%), stress σ (MPa), and Young’s modulus E (GPa). These values were obtained by exploring multiple combinations of parameters, namely, average fibers diameter d (µm), treatment time t (h), and NaOH concentration C (%). This exploration followed a comprehensive experimental design matrix, with 43 factors at three levels, totaling 64 trials. The results provide an in-depth analysis of the relationships between these parameters and their impacts on the DPFs’ mechanical properties. These findings are crucial for determining optimal treatment conditions to maximize the DPFs’ mechanical performance. A thorough understanding of these relationships holds promising prospects for applying these fibers in various engineering fields, thereby fostering the development of environmentally friendly and sustainable materials. presents details of the variables used in this.
Table 2. Experimental results following a full-factorial design (plan = 64).
Analysis of variance (ANOVA) and regression models
The ANOVA is crucial for understanding the influence of input parameters derived from a series of experimental results using the experimental design method while also providing an informed interpretation of the output data (Belaadi et al. Citation2022; Benyettou et al. Citation2022, Citation2023; Ferfari et al. Citation2024; Saada, Zaoui, et al. Citation2024).
This fundamental statistical approach aims to decompose the total variation in an experiment into elements attributable to controlled factors and generated errors. By subdividing the observed variation, ANOVA allows for the precise identification of the specific contributions of each factor to the variability of the results. The statistical significance of quadratic prediction models is evaluated using the ANOVA p and F-values. These statistical indicators provide a robust foundation for determining the model’s validity and the controlled factors’ relevance. In summary, ANOVA offers a systematic and rigorous approach to quantifying and analyzing the impacts of input parameters on experimental results, thereby enhancing the understanding of complex relationships between variables in the context of experimental designs. The p-value represents the probability (ranging from 0 to 1) that the observed results in a study, or more extreme results, could have occurred by chance. This statistical measure is crucial for assessing the validity of observations and determining whether the observed differences are significant or merely the result of random variability. A low p-value indicates a high probability that the results are not due to chance, thereby reinforcing the reliability of the conclusions drawn from the study: (i) if p < .05, the parameter is significant, (ii) if p > .05, the parameter is insignificant.
• In the first column and for each parameter, the sum of the squares (SS) of the deviations from the mean is represented. It is computed using EquationEq. (1)(1)
(1) :
where: is the average response observed in the experiments, where the factor f takes its ieme level, N is the total number of experiments, and Nnf is the level of each factor f.
The second column displays the degree of freedom (DOF).
The third column exhibits the mean squares (MS) expressed as the ratio of the SS to the DOF (EquationEq. (2)
(2)
The fourth column integrates the F-value determined by applying EquationEq. (3)(3)
(3) , with
being the errors’ mean squares:
• The last column of the ANOVA table shows the percentage contribution of each factor to the total variation, indicating the degree of influence on the result calculated by EquationEq. (4)(4)
(4) :
R2 is the correlation coefficient that presents the proportion of variation in the response that the model explains. It is deduced by EquationEq. (5)(5)
(5) . The closer this coefficient is to unity, the better the model is:
Mechanical properties data analysis of variance (ANOVA)
The ANOVA of mechanical characteristics, namely deformation ε (%), stress σ (MPa), and Young’s modulus E (GPa), are detailed in . The results highlight that NaOH concentration C (%NaOH) is the predominant factor, showing significant contributions of 11.63%, 12%, and 11.72% for ε, σ, and E, respectively. Thus, concentration C exerts a marked influence on the DPFs’ mechanical features. Treatment time t (h) also contributes notably, with 6.01%, 6.26%, and 5.79% for ε, σ, and E, respectively. In contrast, the average fiber diameter d (µm) demonstrates a relatively moderate influence, with contributions of 0.87%, 0.68%, and 1% for ε, σ, and E, respectively. These findings underscore the significance of concentration in modifying mechanical characteristics, while treatment time and average fiber diameter play complementary but less pronounced roles. A thorough analysis of these contributions provides a holistic understanding of factors shaping the DPFs’ mechanical characteristics, with significant implications for their future use in various engineering applications, contributing to developing more performance-driven and sustainable materials. The interactions C2, t2, t3, and C3 have the highest statistical significance, while interactions d × t, t × C, d × C2, and t × C2 were found to be insignificant.
Table 3. Analysis of variance (ANOVA) results for strain data.
Table 4. Analysis of variance (ANOVA) results for σ (MPa).
Table 5. Analysis of variance (ANOVA) results for young’s modulus data.
Regression equations
The relationship between input parameters and performance measurements (outputs) is modeled by cubic regression using Minitab 16 software. The regression equations are obtained together with determination coefficients (R2), ε (%) model (reduced cubic model, RCM), and coefficients of determination from EquationEq. (6)(6)
(6) :
with: R2 = 90.49% and R2adj = 88.25%.
σ (MPa) model (RCM) and coefficients of determination are given from EquationEquation (7)(7)
(7)
with: R2 = 88.60% and R2adj = 85.92%.
E (GPa) model (RCM) and coefficients of determination are given from EquationEquation (8)(8)
(8) :
with: R2 = 91.24% and R2adj = 89.18%.
Response surface and contour plot
The 3D response surface analysis () provides an in-depth perspective on the variations in mechanical characteristics (strain, stress, and Young’s modulus) based on processing parameters. An increase in the processing time t from 12 to 36 h and in the NaOH concentration C from 0.5 to 1% resulted in a significant improvement in mechanical properties, namely an increase in strain ε (%), stress σ (MPa)), and Young’s modulus E (GPa).
Figure 2. Response surface for ε (%) as a function of (a) C = 1%, (b) t = 36 h, and (c) d = 350 µm.
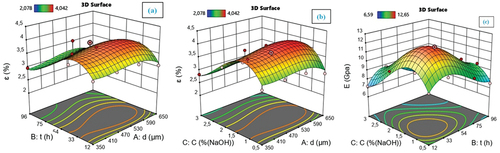
Figure 3. Response surface for σ (MPa) as a function of (a) C = 1%, (b) t = 36 h, and (c) d = 350 µm.
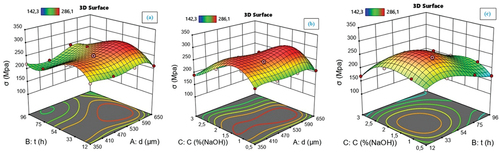
Figure 4. Response surface for E (GPa) as a function of (a) C = 1%, (b) t = 36 h, and (c) d = 350 µm.
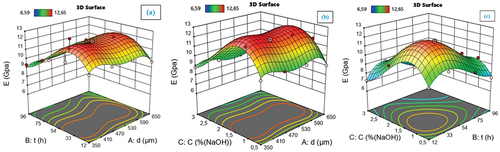
Conversely, a subsequent increase in t from 36 to 72 h and C from 1 to 3% led to a marked decrease in the mechanical characteristics. These results demonstrate the intricate dependence between t, C, and the DPFs’ mechanical properties.
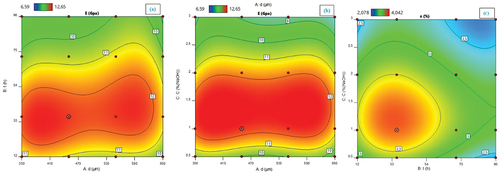
Simultaneously, the contour plots () provide a visual representation of response surfaces and aid in determining the values of mechanical characteristics for different combinations of factors (fiber diameter, processing time, and NaOH concentration). These plots highlight the response variation based on these factors and emphasize the areas where mechanical properties reach optimal or suboptimal levels. The average fiber diameter (d) appears to have a relatively weak influence on these mechanical properties within the considered range of values.
Figure 5. Contour plot for ε (%) as a function of (a) C = 1%, (b) t = 36 h and (c) d = 350 µm.
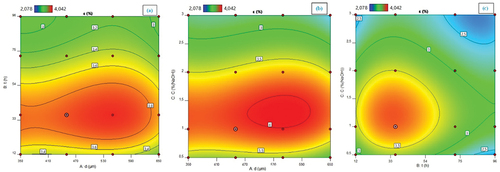
Figure 6. Contour plot for σ (MPa) as a function of (a) C = 1%, (b) t = 36 h and (c) d = 350 µm.
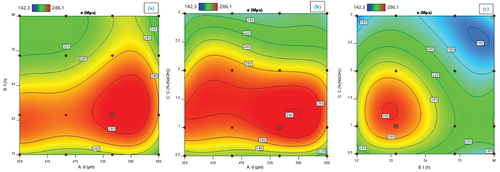
Figure 7. Contour plot for E (GPa) as a function of C = 1%, (b) t = 36 h, and (c) d = 350 µm.
In conclusion, this integrated approach of response surface analysis and contour plots offers a comprehensive understanding of the intricate relationships between processing parameters and the DPFs’ mechanical characteristics. This information is crucial for optimizing processing conditions to maximize mechanical performance and guide the development of sustainable composite materials.
Normal probability of residuals
Assessing the model’s validity involved a thorough diagnostic examination by scrutinizing the residuals, which signify the differences between the observed and predicted responses. These residuals were carefully inspected for normality to ensure the model’s reliability. The normal probability plots for the critical mechanical characteristics – deformation (ε), stress (σ), and Young’s modulus (E) – are detailed in respectively.
Figure 8. Normal probability of residuals for ε (a), σ (b), and E (c) data.
Upon inspecting these plots closely, a noteworthy observation emerged: the residuals align closely along a straight line, indicating a normal distribution of errors. This alignment serves as a crucial validation, suggesting that the model is robust and appropriately captures the underlying patterns in the data. This conformity to normal distribution is particularly significant, as it substantiates the assumption of normally distributed errors, a pivotal condition for reliable statistical analyses. The implications of the residuals following a normal distribution extend beyond mere confirmation of model accuracy, assuring no discernible violation of the assumptions regarding the independence or constant variance of errors. This is a critical aspect of model diagnostics, ensuring that the statistical inferences drawn from the model are trustworthy.
Furthermore, an ANOVA technique was employed to gauge the adequacy of the developed equations. The ANOVA results reinforce the confidence in the models, providing statistical evidence that the formulated equations are suitable representations of the underlying relationships between the input parameters and the mechanical characteristics of interest. In summary, the diagnostic assessments, including residual analysis and ANOVA, collectively affirm the reliability and appropriateness of the developed models. The normal probability plots provide a solid basis for trusting the model’s predictive capabilities by indicating a normal distribution of errors. Confirming model adequacy through ANOVA adds a layer of assurance, solidifying the confidence in the models’ representation of the complex relationships within the studied system.
Comparison between experimental and predicted data
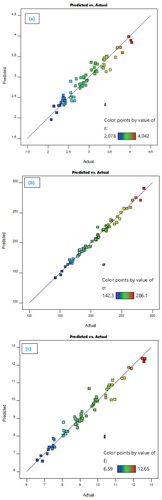
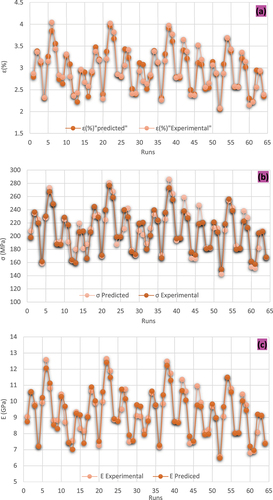
The comparison between experimental and predicted values of strain ε (%), stress σ (MPa), and Young’s modulus E (GPa), obtained through the RSM, is thoroughly examined in . These visual comparisons provide crucial insights into the models’ ability to represent the behavior of the studied mechanical characteristics faithfully. Observing these graphs reveals a general correspondence between the curves of predicted and experimental values. This consistency suggests that the models derived from RSM offer reliable results and substantially capture the actual trends in the experimental data. The similar trends in the curves indicate an excellent capacity of the model to generalize beyond the training data, thereby enhancing its robustness. However, it is essential to note some localized discrepancies between predicted and experimental values, even if they remain limited and do not substantially compromise the overall validity of the models. These minor variations could be attributed to unforeseen factors or nuances not accounted for in the model, underscoring the importance of caution in interpreting the results. Despite these occasional discrepancies, the models derived from RSM remain adequate as faithful representations of the relationships between input parameters (time, concentration, diameter) and DPFs’ mechanical characteristics (strain, stress, Young’s modulus). The critical evaluation of these results and visual analysis strengthens confidence in the model’s ability to predict mechanical performance based on treatment conditions accurately. These consolidated findings demonstrate the relevance and utility of RSM models in optimizing the DPFs’ mechanical properties.
Figure 9. Comparison between measured and predicted values for ε (a), σ (b), and E (c) data.
Multi-response optimization using the desirability approach
The optimization method is used to obtain the optimal values to maximize ε (%), σ (MPa), and E (GPa). The desirability function (DF) proposed by Derringer and Suich (Citation1980) and which appears in many experimental design software aims to find the optimal values of the input parameters (average diameter of the fibers, concentration, and time) to maximize the output parameters (ε, σ, and E).
The overall desirability D, that is to say, which takes into account the requirements of all the responses at the same time, is the geometric mean of the individual desirability’s di. The desirability D is determined by EquationEq. (9)(9)
(9) (Myers and Montgomery (Citation2002):
where: di is the desirability defined for the target output, and wi is the weighting function of di. Desirability is described in various forms for different objectives of each target output. The desirability value varies depending on the levels of factors within the interval [0,1]: one corresponds to maximum satisfaction, and zero corresponds to complete rejection.
To minimize desirability, and present the optimization results (maximizing ε, σ, and E). The optimal parameter values were d = 350.000 µm, t = 28.6847 h, and C = 1.10762%. The optimal deformation, stress, and Young’s modulus were: ε = 4.01748%, σ = 278.571 MPa, and E = 12.5951 GPa, with a combined desirability of 0.909.
Figure 10. Ramp function graph for date palm fibers (DPFs) mechanical properties data.
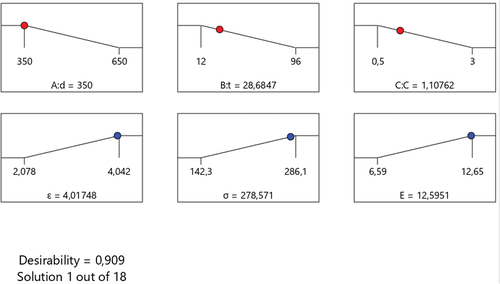
Table 6. Response optimization for tensile properties data.
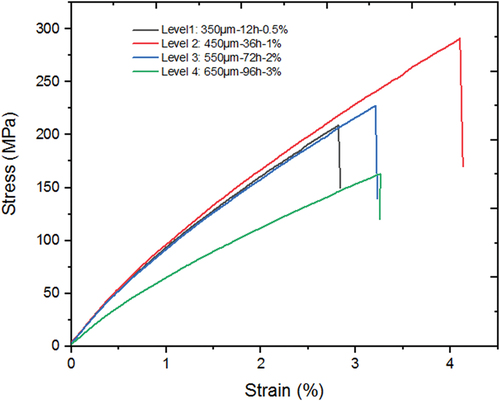
presents typical stress-strain curves based on the distribution of fiber diameters. The diameters were grouped into four distinct levels for this study. At Level 1, the fibers had a diameter of 350 µm, with a treatment duration of 12 hours and a NaOH concentration of 0.5%. Level 2 corresponded to a diameter of 450 µm, with a treatment duration of 36 hours and a NaOH concentration of 1%. For Level 3, the fibers measured 550 µm in diameter, treated for 72 hours with a NaOH concentration of 2%. Finally, Level 4 included fibers with a diameter of 650 µm, treated for 96 hours with a NaOH concentration of 3%. It is noteworthy that Level 2 exhibited a higher maximum stress of 280.7 MPa and a strain of 4.021%, whereas Level 1 showed a lower stress value of 207.7 MPa with a strain of approximately 2.867%.
Figure 11. Typical stress-strain curves.
Conclusion
This study highlighted the significant results obtained through systematically exploring factors and levels in the experimental design. Investigating the enhancement of mechanical properties of date palm fibers (DPFs) revealed crucial insights for their utilization in engineering applications. Detailed analyses have identified optimal alkaline treatment conditions significantly improving the DPFs’ mechanical characteristics.
- Modeling and optimizing methods employed in this work, namely response surface methodology (RSM), analysis of variance (ANOVA), and the desirability function (DF) for the full factorial design (43), led to the following main points:
- ANOVA analysis of mechanical properties revealed that NaOH concentration C has a significant impact on the studied mechanical properties ε (%), σ (MPa), and E (GPa) with contributions of 11.63%, 12%, and 11.72%, respectively. For time t (h), the contributions are 6.01%, 6.26%, and 5.79%, respectively. On the other hand, the average fiber diameter d (µm) has a weak influence on ε, σ, and E, with contributions of 0.87%, 0.68%, and 1%, respectively.
- The determination coefficients (R2) of the different models (ε, σ, and E) are all high, ranging between 88.60 and 91.24%, demonstrating good adequacy. These mathematical models hold significant industrial interest as they allow predicting and optimizing.
- The results analysis shows that the mathematical model for Young’s modulus E is the most representative, with an R2 = 91.24%. It is followed by the model for ε, with an R2 = 90.49%, and lastly, the model for σ, with an R2 = 88.6%.
- Based on RSM and the DF, the optimal parameters that maximize ε, σ, and E are as follows: d = 350.000 µm, t = 28.6847 h, and C = 1.10762% NaOH. The optimal responses are ε = 4.01748%, σ = 278.571 MPa, and E = 12.5951 GPa, with a combined desirability of 0.909.
These findings open promising perspectives for applying DPFs in various engineering fields, such as the production of reinforced composites and eco-friendly construction materials. Using these fibers, following optimized treatment conditions, will contribute to the development of sustainable and environmentally friendly solutions, aligning with sustainable development goals.
In summary, this study demonstrated the importance of systematic experimental approaches and rigorous exploration of factors and levels to enhance the natural materials’ properties. The obtained results open avenues for practical and innovative applications, significantly contributing to the sustainable and eco-responsible materials engineering field.
Highlights
Optimizing date palm fibers’ mechanical properties using a specific Alkaline treatment process.
Using response surface methodology (RSM) for modeling and optimization by systematically varying parameters.
Identifying the adequate treatment conditions for enhancing the mechanical characteristics.
Employing a full-factorial design (43) and analysis of variance for data.
Optimizing mechanical properties by combining RSM and desirability functions.
Nomenclature and abbreviations
Table
Disclosure statement
No potential conflict of interest was reported by the author(s).
References
- Adnan Ali, M., and M. Imran Sarwar. 2010. Sustainable and Environmental Freindly Fibers in Textile Fashion (A Study of Organic Cotton and Bamboo Fibers). University of Borås/Swedish School of Textiles.
- Al-Oqla, F. M., O. Y. Alothman, M. Jawaid, S.M. Sapuan and M.H. Es-Saheb. 2014. “Processing and Properties of Date Palm Fibers and Its Composites.” In Biomass and Bioenergy: Processing and Properties, edited by K. R. Hakeem, M. Jawaid and U. Rashid. 1–20. Cham: Springer International Publishing.
- Ali, H., K. Rohit, and S. Dixit. 2023. “Fabrication and Characterization of Eco-Friendly Natural Human Hair Fiber Reinforced Polyester Composite.” Journal of Natural Fibers 20 (1): 2181268. https://doi.org/10.1080/15440478.2023.2181268.
- Amroune, S., A. Bezazi, A. Belaadi, C. Zhu, F. Scarpa, S. Rahatekar, A. Imad, et al. 2015. “Tensile Mechanical Properties and Surface Chemical Sensitivity of Technical Fibres from Date Palm Fruit Branches (Phoenix Dactylifera L.). Composites Part A.” Composites Part A, Applied Science and Manufacturing 71:95–106. https://doi.org/10.1016/j.compositesa.2014.12.011.
- Amroune, S., A. Bezazi, A. Dufresne, F. Scarpa, and A. Imad. 2021. “Investigation of the Date Palm Fiber for Green Composites Reinforcement: Thermo-Physical and Mechanical Properties of the Fiber.” Journal of Natural Fibers 18 (5): 717–734. https://doi.org/10.1080/15440478.2019.1645791.
- Ashori, A. 2008. “Wood–Plastic Composites as Promising Green-Composites for Automotive Industries!” Bioresource Technology 99 (11): 4661–4667. https://doi.org/10.1016/j.biortech.2007.09.043.
- Azman, M. A., M. R. M. Asyraf, A. Khalina, M. Petrů, C. M. Ruzaidi, S. M. Sapuan, W. B. Wan Nik. 2021. “Natural Fiber Reinforced Composite Material for Product Design: A Short Review.” Polymers 13 (12): 1917. https://doi.org/10.3390/polym13121917.
- Balakrishnan, T. S., M. T. H. Sultan, F. S. Shahar, S. Y. Nayak, A. U. M. Shah, T. A. Sebaey, and A. A. Basri. 2024. “Plant Fiber Reinforcements as Alternatives in Pultruded FRP Composites Manufacturing: A Review.” Journal of Natural Fibers 21 (1): 2298396. https://doi.org/10.1080/15440478.2023.2298396.
- Belaadi, A., S. Amroune, Y. Seki, O. Y. Keskin, S. Köktaş, M. Bourchak, A. Dufresne. 2022. “Extraction and Characterization of a New Lignocellulosic Fiber from Yucca Treculeana L. Leaf as Potential Reinforcement for Industrial Biocomposites.” Journal of Natural Fibers 19 (15): 12235–12250. https://doi.org/10.1080/15440478.2022.2054895.
- Belaadi, A., M. Boumaaza, H. Alshahrani, M. Bourchak, and H. Satha. 2023. “Improving the Mechanical Performance of Biocomposite Plaster/Washingtonia Filifera: Optimization Comparison Between ANN and RSM Approaches.” Journal of Natural Fibers 20 (1): 2170945. https://doi.org/10.1080/15440478.2023.2170945.
- Benyettou, R., S. Amroune, S. Mohamed, Y. Seki, and A. Dufresne. 2022. “Experimental Investigation of the Absorption Behavior of Date Palm Fiber Reinforced Iso-Polyester Composites: Artificial Neuron Network (ANN) Modeling.” Journal of Natural Fibers 19 (17): 15902–15918. https://doi.org/10.1080/15440478.2022.2136323.
- Benyettou, R., S. Amroune, M. Slamani, K. Saada, H. Fouad, M. Jawaid, S. Sikdar. 2023. “Modelling and Optimization of the Absorption Rate of Date Palm Fiber Reinforced Composite Using Response Surface Methodology.” Alexandria Engineering Journal 79:545–555. https://doi.org/10.1016/j.aej.2023.08.042.
- Blythe, A., B. Fox, M. Nikzad, B. Eisenbart, B. X. Chai, P. Blanchard, and J. Dahl. 2022. “Evaluation of the Failure Mechanism in Polyamide Nanofibre Veil Toughened Hybrid Carbon/Glass Fibre Composites.” Materials 15 (24): 8877. https://doi.org/10.3390/ma15248877.
- Chai, B. X., Eisenbart, B. Eisenbart, M. Nikzad, B. Fox, A. Blythe, K. H. Bwar, J. Wang, Y. Du, and S. Shevtsov. 2023. “Application of KNN and ANN Metamodeling for RTM Filling Process Prediction.” Materials 16 (18): 6115. https://doi.org/10.3390/ma16186115.
- Crini, G., E. Lichtfouse, G. Chanet, and N. Morin-Crini. 2020. “Applications of Hemp in Textiles, Paper Industry, Insulation and Building Materials, Horticulture, Animal Nutrition, Food and Beverages, Nutraceuticals, Cosmetics and Hygiene, Medicine, Agrochemistry, Energy Production and Environment: A Review.” Environmental Chemistry Letters 18 (5): 1451–1476. https://doi.org/10.1007/s10311-020-01029-2.
- Dahy, H. 2017. “Biocomposite Materials Based on Annual Natural Fibres and Biopolymers – Design, Fabrication and Customized Applications in Architecture.” Construction and Building Materials 147:212–220. https://doi.org/10.1016/j.conbuildmat.2017.04.079.
- Derringer, D., and R. Suich. 1980. “Simultaneous Optimisation of Several Response Variables.” Journal of Quality Technology 12 (4): 214–219. https://doi.org/10.1080/00224065.1980.11980968.
- Dhakal, H., A. Bourmaud, F. Berzin, F. Almansour, Z. Zhang, D. U. Shah, J. Beaugrand. 2018. “Mechanical Properties of Leaf Sheath Date Palm Fibre Waste Biomass Reinforced Polycaprolactone (PCL) Biocomposites.” Industrial Crops and Products 126:394–402. https://doi.org/10.1016/j.indcrop.2018.10.044.
- Ferfari, O., A. Belaadi, M. Boumaaza, S. Amroune, H. Alshahrani, and M. Ka Khan. 2024. “Mechanical Properties and Statistical Analysis of Syagrus Romanzoffiana Palm Cellulose Fibers.” Journal of Composite Materials 58 (6): 755–778. https://doi.org/10.1177/00219983241231833.
- Friedrich, K., and A. A. Almajid. 2013. “Manufacturing Aspects of Advanced Polymer Composites for Automotive Applications.” Applied Composite Materials 20 (2): 107–128. https://doi.org/10.1007/s10443-012-9258-7.
- Ghori, W., N. Saba, M. Jawaid, and M. Asim. 2018. “A Review on Date Palm (Phoenix Dactylifera) Fibers and Its Polymer Composites.” IOP conference series: materials science and engineering. IOP Publishing.
- Haji, A., and M. Rahimi. 2022. “RSM Optimization of Wool Dyeing with Berberis Thunbergii DC Leaves as a New Source of Natural Dye.” Journal of Natural Fibers 19 (8): 2785–2798. https://doi.org/10.1080/15440478.2020.1821293.
- Hayles, C. S. 2015. “Environmentally Sustainable Interior Design: A Snapshot of Current Supply of and Demand for Green, Sustainable or Fair Trade Products for Interior Design Practice.” International Journal of Sustainable Built Environment 4 (1): 100–108. https://doi.org/10.1016/j.ijsbe.2015.03.006.
- Imoisili, P. E., O. Adeleke, M. E. Makhatha, and T.-C. Jen. 2023. “Response Surface Methodology (RSM)-Artificial Neural Networks (ANN) Aided Prediction of the Impact Strength of Natural Fibre/Carbon Nanotubes Hybrid Reinforced Polymer Nanocomposite.” Engineered Science 23 (852): 852. https://doi.org/10.30919/es8d852.
- Johansson, C., J. Bras, I. Mondragon, P. Nechita, D. Plackett, P. Šimon, D. Gregor Svetec. 2012. “REnewable Fibers And Bio-based Materials For Packaging Applications – A Review Of Recent Developments.” Bio Resources 7 (2): 2506–2552. https://doi.org/10.15376/biores.7.2.2506-2552.
- Lalaymia, I., A. Belaadi, M. Boumaaza, H. Alshahrani, M. K. A. Khan, and A. Dib. 2024. “Weibull Statistic and Artificial Neural Network Analysis of the Mechanical Performances of Fibers from the Flower Agave Plant for Eco-Friendly Green Composites.” Journal of Natural Fibers 21 (1): 2305228. https://doi.org/10.1080/15440478.2024.2305228.
- Mahardika, M., A. Zakiyah, S. M. Ulfa, R. A. Ilyas, M. Z. Hassan, D. Amelia, V. F. Knight. 2024. “Recent Developments in Oil Palm Empty Fruit Bunch (OPEFB) Fiber Composite.” Journal of Natural Fibers 21 (1): 2309915. https://doi.org/10.1080/15440478.2024.2309915.
- Mahfoudhi, A., N. Baaka, W. Haddar, M. F. Mhenni, and Z. Mighri. 2015. “Development and Optimization of the Extraction Process of Natural Dye from Tamarix aphylla (L.) Karst. Leaves Using Response Surface Methodology (RSM).” Fibers and Polymers 16 (7): 1487–1496. https://doi.org/10.1007/s12221-015-4772-5.
- Malkar, R., S. Kagale, Manishkumar Tiwari, and Pravin Patil. 2023. “Applications of Bioplastics in Sports and Leisure.” Handbook of Bioplastics and Biocomposites Engineering Applications 299–315.
- Matthes, A., K. Beyer, H. Cebulla, M. Arnold, and A. Schumann. 2021. Sustainable Textile and Fashion Value Chains. Springer.
- Mohanty, A. K., M. Misra, and L. T. Drzal. 2001. “Surface Modifications of Natural Fibers and Performance of the Resulting Biocomposites: An Overview.” Composite Interfaces 8 (5): 313–343. https://doi.org/10.1163/156855401753255422.
- Myers, R. H., and D. C. Montgomery. 2002. Response Surface Methodology: Process and Product Optimization Using Designed Experiments. 2nd ed. New York: John Wiley and Sons, Inc.
- Saada, K., C. Farsi, S. Amroune, M. Fnides, M. Zaoui, and H. Heraiz. 2024. “Examining the Bending Test Properties of Bio-Composites Strengthened with Fibers Through a Combination of Experimental and Modeling Approaches.” Journal of Composite Materials 58 (12): 1483–1499. https://doi.org/10.1177/00219983241240819.
- Saada, K., M. Zaoui, S. Amroune, R. Benyettou, A. Hechaichi, M. Jawaid, M. Hashem. 2024. “Exploring Tensile Properties of Bio Composites Reinforced Date Palm Fibers Using Experimental and Modelling Approaches.” Materials Chemistry and Physics 314:128810. https://doi.org/10.1016/j.matchemphys.2023.128810.
- Senthil Kumar, P., and S. Suganya. 2017. Sustainable Fibres and Textiles. 1–18. Woodhead Publishing.
- Siakeng, R., M. Jawaid, H. Ariffin, S. M. Sapuan, M. Asim, and N. Saba. 2019. “Natural Fiber Reinforced Polylactic Acid Composites: A Review.” Polymer Composites 40 (2): 446–463. https://doi.org/10.1002/pc.24747.
- Šišková, A. O., P. Peer, A. E. Andicsová, I. Jordanov, and P. Rychter. 2021. “Circulatory Management of Polymer Waste: Recycling into Fine Fibers and Their Applications.” Materials 14 (16): 4694. https://doi.org/10.3390/ma14164694.
- Subie, A., A. Mouritz, and O. Troynikov. 2009. “Sustainable Design and Environmental Impact of Materials in Sports Products.” Sports Technology 2 (3–4): 67–79. https://doi.org/10.1080/19346182.2009.9648504.
- Sunny, G., and T. P. Rajan. 2022. “Review on Areca Nut Fiber and Its Implementation in Sustainable Products Development.” Journal of Natural Fibers 19 (12): 4747–4760. https://doi.org/10.1080/15440478.2020.1870623.
- Tablit, S., R. Krache, S. Amroune, M. Jawaid, A. Hachaichi, A. S. Ismail, A. Meraj. 2024. “Effect of Chemical Treatments of Arundo Donax L. Fibre on Mechanical and Thermal Properties of the PLA/PP Blend Composite Filament for FDM 3D Printing.” Journal of the Mechanical Behavior of Biomedical Materials 152:106438. https://doi.org/10.1016/j.jmbbm.2024.106438.