ABSTRACT
Cough etiquette and respiratory hygiene are forms of source control encouraged to prevent the spread of respiratory infection. The use of surgical masks as a means of source control has not been quantified in terms of reducing exposure to others. We designed an in vitro model using various facepieces to assess their contribution to exposure reduction when worn at the infectious source (Source) relative to facepieces worn for primary (Receiver) protection, and the factors that contribute to each. In a chamber with various airflows, radiolabeled aerosols were exhaled via a ventilated soft-face manikin head using tidal breathing and cough (Source). Another manikin, containing a filter, quantified recipient exposure (Receiver). The natural fit surgical mask, fitted (SecureFit) surgical mask and an N95-class filtering facepiece respirator (commonly known as an “N95 respirator”) with and without a Vaseline-seal were tested. With cough, source control (mask or respirator on Source) was statistically superior to mask or unsealed respirator protection on the Receiver (Receiver protection) in all environments. To equal source control during coughing, the N95 respirator must be Vaseline-sealed. During tidal breathing, source control was comparable or superior to mask or respirator protection on the Receiver. Source control via surgical masks may be an important adjunct defense against the spread of respiratory infections. The fit of the mask or respirator, in combination with the airflow patterns in a given setting, are significant contributors to source control efficacy. Future clinical trials should include a surgical mask source control arm to assess the contribution of source control in overall protection against airborne infection.
Introduction
Over the past decade, the appearance of novel airborne viruses and the reemergence of tuberculosis have posed major public health threats. The most appropriate means of protection, for health care workers (HCW) against such threats, is not well defined.[ Citation 1,2 ] Some studies have suggested the use of surgical masks for HCW as inhalational barrier protection.[ Citation 3,4 ] However, surgical masks are neither tested nor certified for use as respiratory protective devices. They are classified under United States Food and Drug Administration (FDA) Code of Federal Regulations (CFR) Title 21 CFR 878.4040, as a general classification of medical apparel intended to protect both patients and persons in contact with patients from transfer of microorganisms, body fluids, and particulate materials. Respirators, in contrast, are designated as inhalational protection devices.[ Citation 5-7 ] Regulatory recommendations are often based on in vitro assessments of filtration efficiency.[ Citation 8–10 ] However, clinically relevant in vivo studies are limited and may not reflect the in vitro data.[ Citation 11 ] For example, studies conducted during the SARS and H1N1 outbreaks failed to show significant differences in rates of infection between HCW wearing surgical masks or respirators.[ Citation 4,12,13 ] In addition, in vitro studies have shown that N95 respirators and surgical masks may underperform when challenged with viruses of smaller particle sizes such as influenza.[ Citation 8,14 ] Reponen et al. reported that the physical size of the SARS coronavirus and influenza virus classifies them as highly penetrable through both surgical masks and N95 respirators.[ Citation 14 ] Both masks and respirators are defined as Personal Protection Equipment (PPE) for their distinct protective benefits, but both National Institute for Occupational Safety and Health (NIOSH) and the Occupational Health and Safety Administration (OSHA) characterize PPE as “the last line of defense,” encouraging administrative and engineering controls to mitigate environmental exposure. Our study assesses the efficacy of surgical masks in providing secondary protection to healthcare workers and others in relation to masks and respirators used for personal protection.
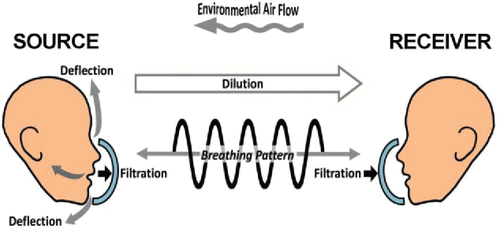
Diaz and Smaldone recently modeled effects of mask-related aerosol transmission between individuals. Their model included filtration effects but they also looked at the interaction of a number of other important factors.[ Citation 15 ] As shown in , they included environmental airflow in the room and mask protection, both deflection (e.g., face seal leakage) and filtration effects, with masks placed on either the infectious Source or the Receiver. The contribution of deflection (outward leakage around the faceseal perimeter) was determined comparing N95 with and without a Vaseline seal. They found that source control (mask on the Source) was often 3–300 times more effective than a mask on the Receiver. Interactive factors in that study were limited to tidal breathing, negative pressure room effects, and use of a hard plastic manikin. To further study the model of Diaz and Smaldone, using a new soft realistic manikin, we expanded the in vitro bench model to test three airflow environments during tidal breathing and coughing.
Figure 1. Model of source manikin, receiver manikin, and environment interplay. Model of source manikin, receiver manikin, and environment interplay. Parameters can be set or measured. Dilution is an effect of the environment on the concentration of produced aerosols. Filtration (capture efficiency) is a function of the mask used and takes place at both the source and receiver. Particles that are not captured can be deflected (outward leakage around the faceseal perimeter) by the mask at the source and carried away from the receiver by the environmental flow. Breathing patterns simulate adults with tidal breathing or coughing.
Methods
Exposure chamber
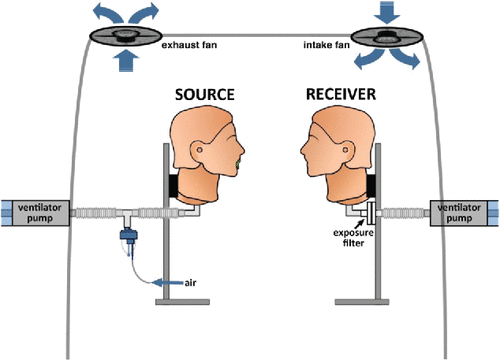
To quantify exposure, the chamber design of Diaz and Smaldone was modified. We constructed a scale model of a single patient room in our hospital (204 ft3, 6.25 ft length x 5.25 ft width x 6.25 ft height). Three different flow regimes were chosen (): (A) no ambient airflow (0 air exchanges per hour), all air movement in the chamber was secondary to the coughing or breathing of the Source and the Receiver; (B) a model of a typical Hospital room fitted with an input and output ceiling fan (6 air exchanges per hour);[ Citation 16,17 ] and (C) a typical Hospital negative pressure room, the chamber was fitted with an exhaust fan behind the Source manikin head with a defined unidirectional flow from the entrance to the vent behind the Source (12 air changes per hour).[ Citation 18 ] Proper direction of flow in the negative pressure room was checked using smoke tests. Chamber flow in ft3/min (CFM) was adjusted by regulating the fans using a balonometer (model 6200D; Alnor, Huntington Beach, CA). CFM was converted to air exchanges per hour (ACH) using the formula: ACH = (CFM x 60 min)/(Room Volume in Cubic Feet). Relative humidity and temperature of the chamber were measured daily and ranged from 33–58% and 21.0–22.8°C, respectively. We adjusted airflow in the chamber using a scaling factor. This factor was defined as the ratio of the volume of a hospital room to our chamber, e.g., 8.41 to create ventilation at both 6 ACH (171 CFM) and 12 ACH (343 CFM). This adjustment was necessary because our ventilatory parameters (e.g., tidal and cough volume) were for normal individuals but the test chamber volume was smaller than a standard room.[ Citation 19,20 ] As the volume of the test chamber decreases relative to tidal volume, the contribution of tidal volume per breath increases proportionately, thus increasing particulate concentration per breath relative to a decreased room volume. To correct for this air exchange flow must be proportionately increased.[ Citation 16 ]
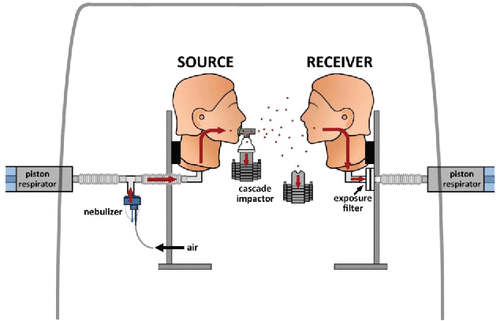
Figure 2. No flow chamber with, 0 air exchanges per hour (ACH). Schematic representation illustrating a chamber, containing the ventilated manikin heads 3 ft apart. Source head was connected to a nebulizer and exhaled radioactive aerosols. A filter was attached to the Receiver head to capture and quantify inhaled radioactive aerosols (exposure) (A). Hospital room chamber, with 6 ACH. Schematic representation illustrating a chamber, containing the ventilated manikin heads 3 ft apart. Source head was connected to a nebulizer and exhaled radioactive aerosols. A filter was attached to the Receiver head to capture and quantify inhaled radioactive aerosols (exposure) (B). Negative pressure room chamber, with 12 ACH. Schematic representation illustrating a chamber, containing the ventilated manikin heads 3 ft apart. Source head was connected to a nebulizer and exhaled radioactive aerosols. A filter was attached to the Receiver head to capture and quantify inhaled radioactive aerosols (exposure) (C).
Within the chamber two Resusci Anne CPR manikins (No. 310200; Laerdal Medical) were placed just beyond 3 ft apart, immediately outside the area defined by the CDC as close contact (<3 ft). Within this distance HCW's are at higher risk for of infection via aerosols during aerosol generating activities such as coughing.[ Citation 3 ] This mimicked two individuals in a room. Each manikin was connected to a Harvard ventilation pump (Harvard Apparatus SN No. A52587; Millis, MA). Resusci Anne CPR manikin heads are realistically sized (based on a mold of a real female face) with soft deformable “skin-textured” faces. A detailed study, testing mask fit, on this manikin has been recently published.[ Citation 21 ]
Aerosols were released from the Source during tidal breathing or coughing. An identical ventilated manikin, the Receiver, contained a filter designed to capture all inhaled particles quantifying health care worker exposure.
Test breathing patterns and aerosols
At the Source, tidal breathing and coughing were tested. For all experiments the Receiver pump was set for tidal breathing (tidal volume 500 mL, respiratory rate of 15 breaths/min, and duty cycle of 50%).[ Citation 19,20 ] The Source pump was set for either the same tidal breathing pattern or, in a separate series of experiments, for coughing. A simulated cough was generated by a series of 1.5-liter breaths generated by the pump, with a peak flow of 5.2 L/sec. As shown in , the nebulizer was connected in series with the Source manikin. For each cough the nebulizer was triggered first, filling the inspiratory tubing with aerosol (5 sec), and then the Harvard pump was energized and the full volume expelled rapidly (1 sec). This maneuver was repeated 20 times over an 8-min collection period. The Receiver maintained a tidal breathing pattern during the coughing. The chamber was washed out with clean air between experiments to prevent cross contamination.
Nebulizers were chosen based upon the aerosol characteristics reported for humans during tidal breathing and coughing.[ Citation 22,23 ] Tidal breathing aerosols were created by an AeroTech II nebulizer (Biodex, Shirley, NY) powered by an air tank at 10 L per minute. Located in line with the Source (), the nebulizer was filled with 3 mL of 0.9% normal saline labeled with technetium-99m and run for 8 min. Flow from the air tank was superimposed on the ventilator pattern during tidal breathing. Cough aerosols were generated using three Salter 8900 jet nebulizers, used in rotation; (Salter Labs, Arvin, CA) connected to a Salter Aire compressor.
The radiolabeled wet aerosols simulated infectious particles released during tidal breathing and coughing. Nebulizer output was constant over the eight minute period. In separate experiments, the distributions of particle aerodynamic diameters at the Source and the Receiver manikin heads were measured by cascade impaction (Marple 8-stage impactor; Thermo Fischer Scientific, Waltham, MA; 2 L per minute flow) (). Aerosols near the Receiver were measured without masks placed on the Source or Receiver. Distributions were plotted on log probability paper. Data were reported as MMAD (mass median aerodynamic diameter). A cumulative lognormal distribution of aerodynamic diameters, the 84.1 percentile divided by the 15.9 percentile defined GSD (geometric standard deviation).
Exposure and mask protection
Aerosol exposure to the Receiver was quantified by placing a filter (model No. 041B0522; Pari, Starnberg, Germany) within the Receiver manikin, which captured all inhaled particles ( A,B,C). All inhaled gases and particles passed through the mouth to the filter via sealed tubing. No ventilation passed through the nose.
The first series of experiments were performed with no masks on either manikin. This defined “Maximum Exposure” (Max Ex) reported as the percent of nebulized particles captured (i.e., inhaled) by the receiver.
We tested three types of facepieces: an N95-class filtering facepiece respirator (model No. 1860S size small; 3M, St. Paul, MN), a natural fit earloop surgical mask (model No. GCFCXS; Crosstex International Inc, Hauppauge, NY), and a SecureFit Ultra fitted surgical mask (model No. GCFCXUSF; Crosstex International Inc, Hauppauge, NY). Both the natural fit and SecureFit surgical masks had identical filtration materials (BFE>99.9% @ 3 microns, PFE = 99.8% @ 0.1 microns, Delta P <5.0 H2O/cm2) that meet American Society for Testing and Materials (ASTM) level 3 standards. Several mask combinations were assessed: no mask (maximal exposure), the surgical mask (SMnat), the SecureFit Ultra fitted surgical mask (SF), an N95 respirator (N95) and the N95 respirator with a Vaseline seal (N95vas). The seal was created with a seam of Vaseline placed around the perimeter of the respirator on either the source or receiver and leak tested with liquid soap. The surgical masks were never sealed to the face. To allow comparison between source control and personal protection effects on the HCW, surgical masks and N95 respirators were tested on the Receiver, the latter, with and without a Vaseline seal.
The surgical mask or N95 respirator, placed only on the Source, assessed the combined effects of two variables; capture efficiency (defined as aerosol captured by the mask) and deflection (defined as outward leakage around the faceseal perimeter), . Pure filtration of source aerosols was measured by sealing the N95 respirator to the face with Vaseline eliminating all mask leakage.
Measurements
Aerosol exposure was quantified by measuring radioactivity captured by the filter in the Receiver manikin. These values were normalized for the amount of radioactivity that left the nebulizer in a given run corrected for tube losses from the nebulizer to the ‘lips’ of the Source manikin (Activity Exhaled%). This radioactivity represents the aerosol presented to the facemask placed on the Source. Mask filtration (at the Source) was measured by determining the radioactivity on the various masks as a percentage of the Activity Exhaled. Measurements were made with a dose calibrator (0.01 micro Curies (μCi)-9999 mCi; Biodex, Shirley, NY), a calibrated rate meter (<10 μCi; Ludlum Measurements Inc, Sweetwater, TX), or a calibrated microwell (10μCi-10 mCi; Kemble Instruments, Hamden, CT). The capture efficiency is the quantity of radioactivity exhaled by the Source captured on the filter placed on the Source.
Statistics
Exposure data and mask capture efficiency were expressed as percentage of nebulized particles (mean with corresponding two-sided 95% confidence intervals [CI]). Group data were compared using the Kriskal-Wallis one-way analysis of variance, a p-value <0.05 defined statistical significance. Calculations were performed using GraphPad Prism v6.0 for Mac OS X (GraphPad Software, San Diego, California). For comparison purposes, we calculated a Receiver protection factor (RPF) defined as the ratio of Max Ex to actual exposure.
Results
Aerosol particle distribution
Particle distributions, MMAD, and GSD are summarized in . Particle distributions are presented for all three rooms at both the Source and Receiver. In all three rooms, during coughing, at the Source, distributions contained larger particles than during tidal breathing. During coughing, when particles reached the Receiver, diameters decreased significantly due to either shrinkage or settling. During tidal breathing, minor, insignificant shrinkage effects were seen.
Table 1. Particle distributions described by mass mean aerodynamic diameter (MMAD) and geometric standard deviation (GSD) for tidal breathing and cough. MMAD are expressed in μm.
Exposure and mask protection: Tidal breathing
Max Ex and exposure data are shown in , with the corresponding RPF for each mask configuration listed in . Data on the figure are reported as percentage of nebulized particles. Max Ex indicates the effect of dilution due to environmental flow and is assigned an RPF of 1 representing no protection. Mean values of exposure data were used to derive RPF. In the No flow, Hospital and Negative pressure rooms, Max Ex averaged 1.146% (95% CI: 1.037–1.255%), 0.617% (95% CI: 0.577–0.657%), and 0.0167% (95% CI: 0.0152–0.0182%),a respectively.
Table 2. Respiratory protection factors (RPF) for tidal breathing and cough. An asterisk (*) denotes significance for a p-value <0.05 using the Kruskal-Wallis one-way analysis of variance.
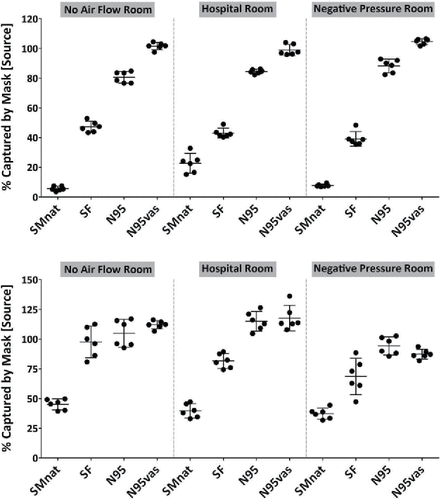
Figure 4. Exposure data for tidal breathing, expressed as a percent of aerosol exhaled with a two-sided 95% CI, plotted for different masks on the Source or Receiver. An asterisk (*) denotes significance for a p-value <0.05 using the Kruskal-Wallis one-way analysis of variance. S = Source, R = Receiver, MaxEx = Maximum Exposure, SMnat = natural fit surgical mask, SF = SecureFit Ultra fitted surgical mask, N95 = 3M N95 respirator, N95vas = 3M N95 respirator with a Vaseline seal.
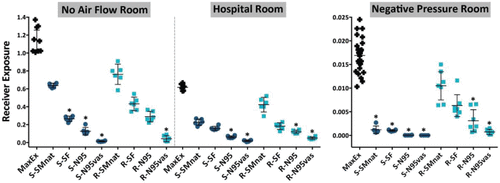
Figure 5. Exposure data for cough, expressed as a percent of aerosol exhaled with a two-sided 95% CI, plotted for different masks on the Source or Receiver. An asterisk (*) denotes significance for a p-value <0.05 using the Kruskal-Wallis one-way analysis of variance. S = Source, R = Receiver, MaxEx = Maximum Exposure, SMnat = natural fit surgical mask, SF = SecureFit Ultra fitted surgical mask, N95 = 3M N95 respirator, N95vas = 3M N95 respirator with a Vaseline seal.
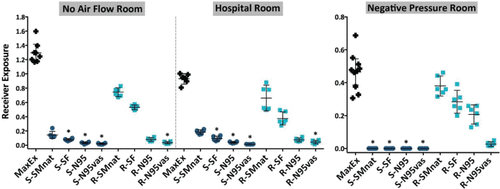
The effect of each mask intervention in reducing exposure is best illustrated by the change in RPF (). There were important differences observed between the rooms. For the room with no airflow, mask on Source was statistically superior for the SecureFit Ultra fitted surgical mask and N95 respirator with and without a Vaseline seal. The only mask to provide significantly different results on the Receiver was the N95 with a Vaseline seal. Differences between mask types were significant indicating that the major mechanism of protection was filtration. Similar findings were seen in the Hospital room, that is, with better filtration, exposure was reduced with an N95 with and without a Vaseline seal on Source or Receiver. Review of RPF data for the Hospital room indicates that, in general, exposure was lower (higher RPF) when the respirator was on the Source. However, this was not statistically significant. In the Negative pressure room applying either surgical mask or respirator to the Source resulted in statistically significant reductions in exposure, while on the Receiver only the N95 with or without a Vaseline seal afforded similar protection. While there were significant differences between some masks (e.g., capture efficiency effect, SMnat vs. N95 vs. N95vas), in the Negative pressure room, the major differences in exposure were due to outward leakage of particles around the faceseal perimeter (deflection) at the Source. In this environment, deflected particles are rapidly carried away by the airstream. This observation is most evident by comparing RPF between the Source and Receiver. Each mask on the Source markedly reduced receiver exposure even if the mask had a poor capture efficiency. Here, deflection was the important mechanism in reducing receiver exposure.
Exposure and mask protection: cough
Data for cough are shown in and the lower panel of . Compared to tidal breathing there are major differences in magnitude and mechanisms of exposure. In general, for all rooms, mask on Source was superior to mask on Receiver. Results were relatively insensitive to capture efficiency, that is, compared to an N95 on the Receiver, the natural fit surgical mask on the Source was either as effective (No flow room and Hospital room) or more effective (Negative pressure room). Compared to tidal breathing, the reduction of exposure from coughing is likely a function of impaction of larger particles in any mask or respirator placed on the Source.
Filtration at the source
Mask capture efficiency (capture of particles exiting at the Source) for the various facepieces is demonstrated in . For tidal breathing (upper panel) a typical capture efficiency pattern was observed. That is, the natural fit surgical mask captured particles poorly due to outward leakage around the faceseal perimeter (∼ 5–20%). With a better-fit and reduced mask leakage using the SF surgical mask filters ∼ 50%, the N95 ∼ 80–90%, and a sealed N95 ∼100%. During coughing a different pattern was observed ( - lower panel). Capture efficiency of particles was increased for both surgical masks and respirators, such that with the increased fit provided by the SF, both the SF surgical mask and the N95 capture ∼ 100% of the exhaled aerosol.
Discussion
Our data quantifies the potential synergy of source control using facepieces and personal protection using respiratory protection devices. Combined with environmental controls, source control can be more effective than personal protection alone.
Our study focused on the use of masks and respirators as a means to reduce environmental contamination via barrier protection at the source and does not suggest or support the use of surgical masks as a means of respiratory protection. Nor does it address the many variables associated with such protection, such as infectious dose and transmission modes, all of which may vary significantly with each infectious threat. Rather, we utilize in vitro respiratory protection measurements such as RPF as a means to correlate exposure reduction with source control to that achieved through the use of different masks or respirators on the Receiver. Our findings support the use of facemasks as a potentially reliable and consistent means of infection control, akin to other environmental controls such as respiratory etiquette, hand washing, physical partitions and engineering controls such as negative pressure isolation rooms. While “patients” and “HCW” are used here to identify the most obvious “Sources” and “Receivers” within a hospital setting, our data would likely apply to any combination of potential “Sources” and “Receivers,” e.g., hospital visitors, HCW who have not received influenza flu shots or patients within healthcare settings such as emergency rooms and physician office waiting rooms.
While clinical studies are needed to confirm our observations, analysis of the mechanisms of exposure illustrated in combined with our quantitative data suggests source control as an approach to reducing exposure. For example, if the patient in a negative pressure room were to wear a surgical mask for a period of time prior to the entry of a HCW, e.g., for several air exchanges, exposure would be significantly reduced. This observation applies to all the rooms but the magnitude of the effect depends on the interaction of source control and the room's environment, as observed in the Negative pressure room.
Our data may help in designing better masks. In the Hospital room, when there was an increased outward leakage at the Source (e.g., less aerosol captured by the mask) there was reduced protection (reduced RPF) at the Receiver. Reducing facepiece resistance would reduce outward leakage and may compensate for flaws with the fit of a mask.[ Citation 24 ]
During coughing, source control was clearly superior to masking the Receiver. In the Negative pressure chamber, placing a natural fit surgical mask (S-SMnat) on the Source during coughing reduced exposure approximately 1,500-fold (RPF = 1587), compared to the extreme of sealing an N95 respirator (R-N95-vas) to the face of the receiver (RPF = 17). This observation was due to the combined effects of the impaction of expelled particles on the mask () and extraction of deflected particles by the flow of air in the room. These findings were consistent with the results reported by Cheong and Phua[ Citation 18 ] who found that, in a negative pressure room, placing the exhaust vent on the wall behind the patient's bed, as in our experiments, was more effective in removing pollutants than having the exhaust vent in the ceiling above the patient.[ Citation 18 ]
Our study has several limitations. Directions of airflow and head position were fixed and changes in direction may affect our observations. In addition, in an actual hospital setting, the airflow and ventilation may vary based on room design, location of vents and position of the patient and HCW. Our head positions and airflow were in an optimized direction for HCW protection, from Receiver to Source. This may enhance the reported effect of Source control. However, the parameters we have chosen for ventilation and airflow magnitude and direction are typical for those reported for hospital rooms in previous studies.[ Citation 25 ] In addition, Lindsley et al. found that exposure to potentially infectious aerosols anywhere in the room was unaffected by head position.[ Citation 25 ]
Our aerosols are aqueous and particle distributions will be affected by changes in ambient relative humidity. While relative humidity of the ambient air varied, wet nebulizers provide saturated air so the aerosols leaving the Source manikin always are insensitive to room air humidity.
Our study does not use formal fit-testing methods to arrive at protective RPF values, but we utilize set of measurements to arrive at an equivalent fit factor (e.g., a reduction in exposure due to use of a mask). Fit testing of manikins is complex as reported in our previous study, which focused on the effects of testing different types of manikins on our measurement of fit.[ Citation 21 ] As we reported in that study, improved fit was readily quantified by our techniques allowing a separation of effects caused by changes in Source control and/or changes in fit at the Receiver. Many manikin studies simply seal the facepiece to the manikin to avoid this issue. We feel that our sealed and unsealed results provide an increased understanding of the interaction between factors involved with actual exposures beyond that of only Receiver protection alone.
Our data should help design future clinical trials. A source control arm should be included in tests of mask and respirator effectiveness.
Acknowledgments
The authors thank Lorraine Morra for her assistance in performing the experiments and creating the manuscript and figures.
References
- Nicas, M. , and R.M. Jones : Relative contributions of four exposure pathways to influenza infection risk. Risk Anal. Off. Publ. Soc. Risk Anal . 29:1292–1303 (2009).
- CDC : “Prevention Strategies for Seasonal Influenza in Healthcare Settings Guidelines and Recommendations.” Available at http://www.cdc.gov/flu/professionals/infectioncontrol/healthcaresettings.htm 2013.
- Siegel, J.D. , E. Rhinehart , M. Jackson , L. Chiarello , and the Healthcare Infection Control Practices Advisory Committee : 2007 Guideline for Isolation Precautions: Preventing Transmission of Infectious Agents in Healthcare Settings (2007).
- Loeb, M. , N. Dafoe , J. Mahony , et. al.: Surgical mask vs N95 respirator for preventing influenza among health care workers: a randomized trial. JAMA 302:1865–1871 (2009).
- Berger, S.A. , M. Kramer , H. Nagar , A. Finkelstein , A. Frimmerman , and H.I. Miller : Effect of surgical mask position on bacterial contamination of the operative field. J. Hosp. Infect . 23:51–54 (1993).
- Qian, Y. , K. Willeke , S.A. Grinshpun , J. Donnelly , and C.C. Coffey : Performance of N95 respirators: filtration efficiency for airborne microbial and inert particles. Am. Indust. Hyg. Assoc. J . 59:128–132 (1998).
- General and Plastic Surgery Devices: Code of Federal Regulations. Title 21 . U.S Food and Drug Administration (FDA) and U.S. Department of Health and Human Services (DHHS), 2000.
- Balazy, A. , M. Toivola , A. Adhikari , S.K. Sivasubramani , T. Reponen , and S.A. Grinshpun : Do N95 respirators provide 95% protection level against airborne viruses, and how adequate are surgical masks? Am. J. Infect. Control. 34:51–57 (2006).
- Balazy, A. , M. Toivola , T. Reponen , A. Podgorski , A. Zimmer , and S.A. Grinshpun : Manikin-based performance evaluation of N95 filtering-facepiece respirators challenged with nanoparticles. Ann. Occup. Hyg. 50:259–269 (2006).
- Shine, K.I. , B. Rogers , and L.R. Goldfrank : Novel H1N1 influenza and respiratory protection for health care workers. New England J. Med . 361:1823–1825 (2009).
- Janssen, L. , H. Ettinger , S. Graham , R. Shaffer , and Z. Zhuang : The use of respirators to reduce inhalation of airborne biological agents. J. Occup. Environ. Hyg . 10:D97–D103 (2013).
- Loeb, M. , A. McGeer , B. Henry et al. : SARS among critical care nurses, Toronto. Emerg. Infect. Dis. 10:251–255 (2004).
- Johnson, D.F. , J.D. Druce , C. Birch , and M.L. Grayson : A quantitative assessment of the efficacy of surgical and N95 masks to filter influenza virus in patients with acute influenza infection. Clin. Infect. Dis. 49:275–277 (2009).
- Lee, S.A. , S.A. Grinshpun , and T. Reponen : Respiratory performance offered by N95 respirators and surgical masks: human subject evaluation with NaCl aerosol representing bacterial and viral particle size range. Ann. Occup. Hyg. 52:177–185 (2008).
- Diaz, K.T. , and G.C. Smaldone : Quantifying exposure risk: surgical masks and respirators. Am. J. Infect. Control . 38:501–508 (2010).
- Moon, K. : Design of Hospital Isolation Rooms. In Business Briefing: Hospital Engineering & Facilities Management , 2004.
- Sehulster, L.M. , C.R.Y.W. Chinn , M.J. Arduino et al. : Recommendations from CDC and the Healthcare Infection Control Practices Advisory Committee (HICPAC), 2004.
- Cheong, K.W.D. , and S.Y. Phua : Development of ventilation design strategy for effective removal of pollutant in the isolation room of a hospital. Build. Environ. 41: (2009).
- Nikander, K. , J. Denyer , M. Everard , and G.C. Smaldone : Validation of a new breathing simulator generating and measuring inhaled aerosol with adult breathing patterns. J. Aerosol Med. 13:139–146 (2000).
- Dennis, J.H. , and O. Nerbrink : New Nebulizer Technology. In Drug Delivery to the Lung , H. Bisgaard , C. O’Callaghan , G.C. Smaldone (ed.). Boca Raton, FL : CRC Press, 2001. pp. 326–328.
- Mansour, M.M. , and G.C. Smaldone : Respiratory source control versus receiver protection: impact of facemask fit. J. Aerosol Med. Pulm. Drug. Deliv . 26:131–137 (2013).
- Nicas, M. , W.W. Nazaroff , and A. Hubbard : Toward understanding the risk of secondary airborne infection: emission of respirable pathogens. J. Occup. Environ. Hyg . 2:143–154 (2005).
- Xie, X. , Y. Li , H. Sun , and L. Liu : Exhaled droplets due to talking and coughing. J. Roy, Soc . 6( Suppl 6 ):S703–14 (2009).
- Skaria, S.D. , and G.C. Smaldone : Respiratory source control using surgical masks with nanofiber media. Ann. Occup. Hyg. 58(6):771–781 (2014).
- Lindsley, W.G. , W.P. King , R.E. Thewlis et al. : Dispersion and exposure to a cough-generated aerosol in a simulated medical examination room. J. Occup. Environ. Hyg . 9:681–690 (2012).

