
Abstract
The aim of this study was to make a preliminary evaluation of the University of North Carolina passive aerosol sampler (UNC sampler) for personal air sampling of particles. Nine personal air samplings of respirable fraction were conducted in an open-pit mine, with pairwise UNC samplers and a respirable cyclone mounted on the chest of workers. UNC samples were analyzed with scanning electron microscopy (SEM) and to some extent energy dispersive X-ray spectroscopy (EDS). Respirable cyclone filter samples were weighed. Correlations and particle elemental compositions were described. Microscopic imaging of the collection surface showed that the particles were heterogeneously deposited across the surface of the UNC sampler. Collected particles were shaped as gravel particles and the resulting particle size distribution in air showed a peak at ca. 3 µm aerodynamic diameter, similarly to what has previously been reported from the same mine. The elemental composition indicated mineral origin. All correlations between the airborne mass concentrations from UNC samplers and respirable cyclones (Pearson = 0.54 and Spearman = 0.43) and between pairs of parallel UNC samplers (Pearson = 0.55 and Spearman = 0.67) were weak. The UNC sampler mass concentrations were approximately 30 times higher than those measured with the respirable cyclone. In conclusion, the UNC sampler, when used for personal sampling in a mine, provides a reasonable particle size distribution and the deposited particles appeared to be of mineral origin and not from textile or skin but the approximately 30-fold overestimation of mass concentrations when comparing with respirable cyclone sampling indicates that further improvements are necessary. Positioning of the sampler may be critical and moving the UNC sampler from the chest to e.g. the top of a helmet might be an improvement. Grounding of the sampler in order to avoid static electricity might also be useful. The UNC sampler should continue to be researched for personal sampling, as passive sampling might become a useful alternative to more laborious sampling techniques.
Introduction
Occupational exposure to particles can lead to different health effects among workers.[Citation1–3] Measuring occupational exposure by using active sampling requires a working pump and special expertise for maintenance and sampling. The cost of obtaining samples with the expertise of industrial hygienists can therefore be high considering the time required and the operational costs. A cost-effective and simpler alternative to active sampling is passive sampling,[Citation4] which is also less disturbing for the worker. Passive sampling does not rely on a pump and requires no power supply; it uses gravity and diffusion to collect particles.
To measure occupational particle exposure with a passive sampler, the Wagner and Leith[Citation5–7] University of North Carolina passive aerosol sampler (UNC sampler) was used, which collects particles by gravity and diffusion. It has a mesh cap, with conical holes that have a diameter of 150 µm, which protects the collection surface from large particles. The UNC sampler has a diameter of 15 mm and weighs 1.7 g, making it a potential candidate for personal sampling in a working environment. Multiple studies in the lab and various field environments have been performed using the UNC sampler.[Citation5–10]
There are two previous reports using the UNC sampler in the same working environment as in the present study.[Citation11,Citation12] These studies showed that stationary sampling with the UNC sampler was possible for PM2.5, respirable fraction, and PM10 in the mine, which is an open-pit mine. In Shirdel et al.,[Citation12] a new model (area factor) was presented that did not consider the effects from wind because of the windless conditions in the mine. For personal sampling when the worker moves, it is imperative to find out if the same windless model (area factor) is more appropriate than the original model (mesh factor).
In this explorative study using the UNC sampler as a personal sampler, a mining environment dominated by mineral particles was chosen and established procedures to determine the placement of the personal measurement devices were followed. This has never been done before, and the results may aid in future developments of the UNC sampler as a personal sampler.
The aim of this pilot study was to make a preliminary evaluation of the UNC sampler for personal sampling. More specifically, the goal was to characterise the particle size distribution, to see if these results indicate any differences compared to previously reported stationary sampling results from the same mine and provide information on which of the two UNC analysis models would be most suited for personal sampling. Another goal was to learn about the particles’ shape and elemental composition in order to learn if personal sampling could lead to significant collection of, for example, textile particles in addition to particles from the working environment. Furthermore, this study compares the UNC sampler to respirable cyclones.
Methods
Personal air sampling of the respirable particle fraction was performed on workers with different tasks in an open pit mine. One measurement set was collected from three devices fastened to the workwear of each worker, including one respirable cyclone (Position 3 from the center; see ) and two UNC samplers (positions 1 and 2 from the center, see ). The respirable cyclone was attached to a harness. In total, nine different measurement sets were collected (). The work shifts ranged from 5–8 hr, with some workers participating more than once. In calculations, the temperature was approximated to be the same for all measurements (20 °C, 293 K). The workers moved between indoor and outdoor conditions, but were mostly indoor.
Figure 1. Measurement setup: Each worker had one respirable cyclone (3) and two UNC samplers (1 and 2) fastened to their workwear.
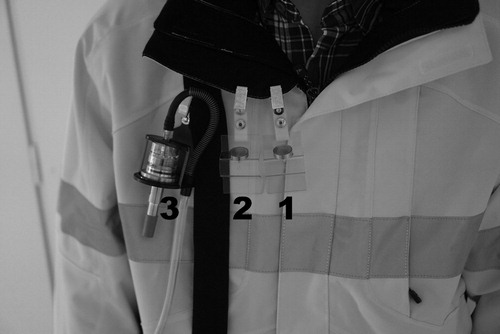
Table 1. Overview of activities during the nine measurement events.
The whole measurement campaign lasted three days, and on each day one UNC sampler field blank was used. The UNC sampler field blank was opened during mounting for the first measurement of the day (∼5 min, immediately closed when done) and opened during dismantling for the last measurement of the day (∼5 min, immediately closed when done). There were also in total two unopened transport blank filters. Ethical approval was given by the regional ethical review board in Umeå (Dnr 2012-365-31M).
Active sampling
For the active personal sampling of the respirable fraction, the following were used: aluminium cyclones (SKC Inc., Eighty Four, PA), three-piece monitor cassettes with the inlet section removed (Merck Millipore, Darmstadt, Germany), MF-Millipore membrane filters (25 mm, 3.0 µm, Merck Millipore, Darmstadt, Germany), and SKC filter holders (SKC Inc., Eighty Four, PA). Both GilAir-3 (Sensidyne, St. Petersburg, FL) and AirChek 2000 (SKC Inc., Eighty Four, PA) pumps were used and were set at a flow rate of 2.5 L/min. A flow calibration adapter (SKC Inc., Eighty Four, PA) and a flow meter (DryCal DC-Lite, Bios International, NJ) were used at the beginning and end of each measurement, confirming that the air flows were within ±5% of the flow rate. Weighing of filters, assembly of filters in the filter monitors, and analysis were performed by the Department of Occupational and Environmental Medicine, Örebro University Hospital in an SS-EN ISO/IEC 17025 certified and accredited laboratory.
Passive sampling
The passive personal sampling of the respirable fraction was performed with UNC samplers (RJ Lee Group, Monroeville, PA) mounted with clip holders (kindly provided by RJ Lee Group) during measurement. At all other times the samplers were stored in closed plastic transport vials. For protection, the UNC sampler consisted of a mesh cap, with conical holes that have a diameter of 150 µm. The cap was attached by stainless steel screws.[Citation13] The mesh cap consisted of a screen assembly covered on top by the mesh. The screen assembly had a circular opening with a diameter of 6.35 mm. The mesh cap was fastened to an aluminium scanning electron microscopy (SEM) stub with a polycarbonate collection surface in between. The collection surface consisted of a polycarbonate filter cut out from a 47 mm Millipore filter with 0.1 µm pore size (Merck Millipore, Darmstadt, Germany) fastened to the stub with a layer of Ted Pella Electrodag DAG-T-502 Carbon paint (Ted Pella Inc., Redding, CA).
Analysis of passive samplers
The collection surfaces of the UNC samplers were analysed with a backscatter electron detector in a Carl Zeiss EVO LS15 SEM with software SmartSEM (Version 5.09 SP10, Zeiss, Oberkochen, Germany) and SmartStitch (Version 01.02.07, Zeiss). Using the software, automatic image collection was made with the SEM covering a pre-defined area, the entire collection surface of each UNC sampler. A minimum of 192 images were taken, each measuring 427x569 μm, with 500x magnification and 1.8 pixels/μm resolution. The process was manually overlooked with each image visually inspected to check if the assessment of the particles’ shape by the automatic image collection needed adjustments, which only happened for a small proportion of particles. This inspection meant that a person visually observed the shape of each particle. Although no systematic recording of these observations was made, they gave information about whether particles resembled, e.g., gravel, fibres, skin debris, and so on. The microscope was set to a working distance of 8.5 mm, a probe current of 400 pA, and a beam accelerating voltage of 15 kV.
For the energy dispersive spectroscopy (EDS), conducting elemental analysis of the particles on the collection surface, an EDS detector (X-MaxN 80 mm2, Oxford Instruments, Abingdon, UK) with software AZtec (Version 3.3 SP1, Oxford Instruments) was used with the SEM. These elemental analyses were carried out on a subset only: 8 areas on four passive samples were analyzed using the instrumental function Area Analysis, which gives the average elemental content for all particles on the selected area. Four of the areas were from zones with higher particle surface loading (particle surface loading is in this work used to refer to the number of particles per unit surface area), spread widely apart to cover different parts of the collection surface. The other four areas were scattered within the zones with higher particle surface loading. The magnification varied depending on the size and number of particles in each area, but was optimized to give the highest signal for EDS.
Images were processed in ImageJ (Version 1.50i, National Institutes of Health, Bethesda, MD) and MATLAB (R2016b [9.1.0.442655], The MathWorks, Inc., Natick, MA). The processed images were the images inside the higher particle surface loading of the circular edge and the images containing the outer rim of that circle. The threshold methods used were the triangle method and the RenyiEntropy method. (Thresholding is the process of sorting every pixel into either particle or no particle, based on the image characteristics.) Exclusion criteria were: particles touching a side of the image; particles with an imaged area larger than 10,000 μmCitation2 (these should not be able to pass the mesh cap); and particles with an area smaller than 0.31 μmCitation2 (the area corresponding to one pixel at 500x magnification).
The calculation procedures used to determine the particle mass concentrations were previously described by Shirdel et al.[Citation12] based on Wagner and Leith,[Citation5] Schneider et al.,[Citation14] and Leith et al. (Equation (2)).[Citation9] The respirable fraction sampling criterion from Hinds[Citation15] was used, as previously described by Wagner and Macher,[Citation8] to be able to compare the particle mass concentration of the UNC samplers to the concentrations measured with the respirable cyclone. Both the original mesh factor model[Citation6] and the area factor model[Citation12] were used for the concentration calculations to assess which model is better suited for personal sampling in the working environment used in this study. For the calculations, a density of 2.8 g/cm3 (provided by the mine for the density of the ore in the environments used in this study) was used, and both the volume shape factor, 1.6, and dynamic shape factor, 1.4, for heterogeneous aerosols were used, as previously described by Wagner and Leith[Citation5] and Wagner and Macher.[Citation8]
Statistical methods
Concentrations were described with means and standard deviations. Whether these concentrations followed a normal distribution was not assessed, and no statistical tests for comparisons between means were conducted, due to the limited sample size. These statistics and correlation coefficients (Pearson and Spearman) between the respirable mass concentrations for UNC samplers and respirable cyclones were calculated using the software program R (R Core Team, version 3.3.3, R Foundation for Statistical Computing, Vienna, Austria).
Results
The particle depositions on the collection surfaces of the UNC samplers were heterogeneous with a higher particle surface loading forming a circle along the edges of the collection surface (). This phenomenon appeared in about half of the samples, with varying degree. It was not possible to ascertain if the circle is positioned exactly where the cap touches the deposition surface, but that is quite possible. It could also be noted in that particles were present outside the sampling area. On some of the imaged deposition surfaces, agglomerations of particles looked like a particle that had been broken on impact or particles that had gathered together on the surface (, images a and b).
Figure 2. The whole UNC sampler collection surface imaged with a SEM. The particles were deposited heterogeneously, with a higher particle surface loading in a circular shape at the edge of the collection surface.
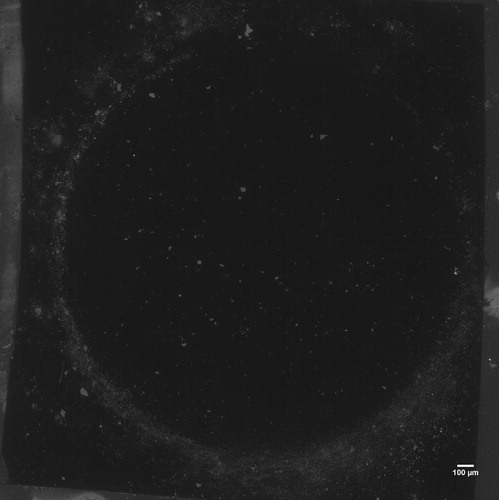
Figure 3. Four example particle collection surfaces imaged from different UNC samplers with a SEM. The particles almost exclusively resembled gravel. Panels (a), (b), and (d) show particles at the edge of the collection area, and panel (c) shows particles from the center of a deposition surface. The particle surface loading on the surface edge was generally higher than on the center of a deposition surface.
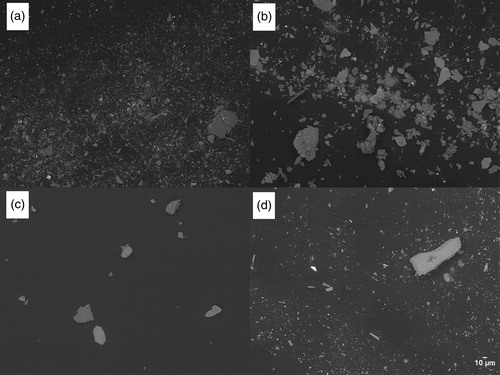
Microscopic imaging with manual inspection of each image (around 200 images per UNC sampler, examples presented in ) showed almost exclusively particles reminiscent of gravel, expressing crystal habit (hexagonal, cubic shaped, etc.). Particles of fibrous character were extremely rare, and on all the samplers combined (each sampler containing a minimum of 13,548 particles) there was a total of only 20 particles differing from the rest, having fibrous character. There were no other differing particles. The EDS analysis showed that 100% of the examined areas contained silicon, 94% aluminium, 91% iron, 79% potassium, 75% sulphur, 73% calcium, 48% magnesium, 42% copper, 42% titanium, and 30% sodium, indicating a mineral origin for the particles. For examples of images from the EDS elemental mapping, see the supplementary material (Figures S1 and S2).
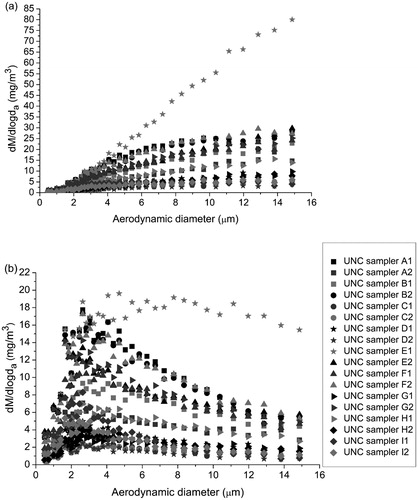
No blank subtraction was made on the particle mass concentration of the UNC samplers, because the blanks had low particle counts (227–921), compared to the UNC samplers’ particle counts (13,548–109,947). The normalized mass concentration distributions of the two models, with mesh factor and area factor, respectively, were plotted (). The shape of the distributions obtained with the mesh factor model appeared implausible for air due to its monotonic increase (i.e., no peak) throughout the aerodynamic diameter range (), while the distributions resulting from the area factor model showed a peak around 3 µm aerodynamic diameter () resembling previous observations with an aerodynamic particle sizer from the same mine.[Citation12] Thus, the area factor model was used for the comparison between the UNC sampler and the respirable cyclone.
Figure 4. Normalized mass concentration distributions (dM/dlogda) for the 18 UNC samplers calculated using the (a) mesh factor and (b) area factor.
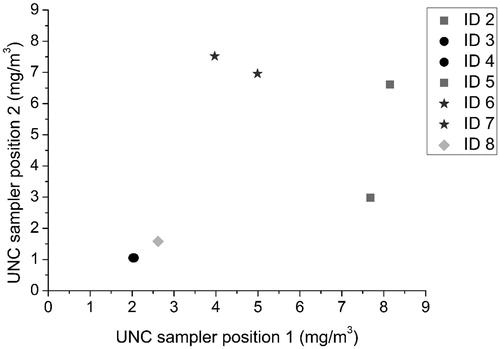
The airborne mass concentrations estimated with the UNC sampler were considerably higher than the respirable cyclone mass concentration results for all measurement sets but one (). Removing the outlier with the high respirable cyclone result the mean and standard deviation of seven respirable cyclone measurements were 0.14 ± 0.07 mg/m3 and differed from the mean values of the seven pairs of UNC samplers of 4.50 ± 2.57 mg/m3 in Position 1 and 3.96 ± 2.95 mg/m3 in Position 2. The UNC sampler results for these seven sets with personal sampling were thus approximately 30 times higher than the respirable cyclone results. Concentrations using only the central region of the collection surface were calculated, but the concentrations were still about 10 times higher for the UNC samplers compared to those from the respirable cyclones. The correlations between the UNC sampler (the mean of the two observations) and the respirable cyclone for the seven sets with personal sampling were 0.54 (Pearson) and 0.43 (Spearman) with a lack of a statistically significant association (. The paired measurements for the UNC sampler at Position 1 vs. Position 2 with the differing set excluded had weak correlations of 0.55 (Pearson) and 0.67 (Spearman), and a lack of statistically significant associations (). For the outlier, the only deviating characteristic observed was the high result of the respirable cyclone sampling.
Figure 5. (a) Mass concentrations of the respirable cyclone vs. the UNC sampler. (b) Mass concentrations of the respirable cyclone vs. the UNC sampler mean mass concentrations, with the respirable cyclone outlier (high concentration) removed.
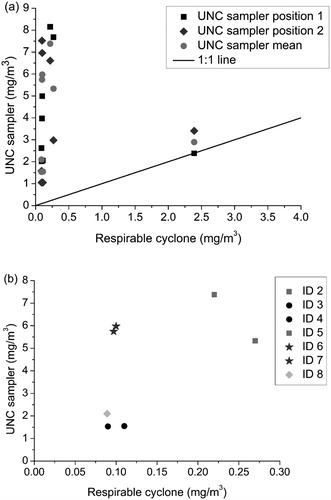
Figure 6. Mass concentrations for the seven paired measurements for the UNC sampler Position 1 vs. the UNC sampler at Position 2 with the respirable cyclone outlier (see ) removed. The points for ID 3 and 4 overlap.
Discussion
This is the first study using the UNC sampler for personal sampling. A number of aspects that work well were identified, as well as aspects that need improvements. This is an important step toward using the UNC sampler for characterisation of individual particle exposure. The particles collected in this mine looked, on SEM images, like gravel and consisted of elements indicating a mineral origin. Thus, the particles appeared to originate from the work environment and not from textiles or the skin from the worker. When using the area factor model, the particle size distributions appeared reasonable for airborne particles, as opposed to the implausible distributions obtained with the mesh factor model. However, a potential problem with the UNC sampler was that the particles were heterogeneously distributed on the collection surface with a higher particle surface loading collected in a circular shape along the edge of the collection surface. In addition, quantitation was not satisfactory because the UNC sampler overestimated the mass concentrations approximately 30 times compared to the respirable cyclone, and there were no strong correlations between the pairwise UNC samplers.
The mass concentration distributions in this working environment were in accord with a previous study when using the area factor model.[Citation12] The correlations between the UNC sampler and the respirable cyclone was however weak when personal sampling was performed. It has been shown that the respirable cyclone might show somewhat lower concentrations in this specific working environment,[Citation12] but many of the UNC sampler values, around 5–8 mg/m3, were unreasonably high and could be ruled out based on site visits and industrial hygiene experience. The two most likely explanations for the high concentrations from the UNC samplers are positioning and static electricity. Traditionally, when conducting personal sampling the measurement devices are positioned on the chest or collar, near the breathing zone. This positioning could be problematic for personal sampling with the UNC sampler, due to wall effects from the proximity of the sampler to the worker’s chest. Convection of air could interfere with the measurement because there is a “human wall” directly behind the sampler and particles collected on the worker could continuously fall from their clothes onto the samplers. This could explain why the UNC concentrations were much higher than those measured after cyclone sampling, which, due to pumping of air from the surroundings into the downward-oriented inlet of the cyclone sampler, should be less affected by this effect. The wall effect might also explain why the UNC samplers positioned 1 and 2 differ and have weak correlations. The contribution of particles on the UNC sampler could also be due to a person’s “personal cloud” (the higher particle mass concentration around a person) as compared to the air farther away. Movements of the person lead to increased emission rates[Citation16] and might increase detachment rates of particles attached to work clothes,[Citation17] which could lead to higher concentration measurements by the UNC sampler compared to the respirable cyclone due to their different sampling principles. Shirdel et al.[Citation12] reported a relative humidity of 20% for the same mine locations used in this study based on measurements conducted in the same season. The low relative humidity combined with the person’s movements, could influence the static electricity around the UNC sampler, and increased static electricity around the UNC sampler might draw more particles into it from the personal cloud.
The previous two studies[Citation11–12] where the samplers had been grounded, showed homogeneous distributions of particles on all collection surfaces. Static electricity could also be a possible explanation for the higher particle surface loading along the edge observed in this study, which might be due to an imbalance of charges leading the particles to the edge of the sampler where the electric field is strongest. The static electricity might be generated by the clip holder’s plastic material and continuous rubbing against the worker’s clothes. Similar “circular shape” behaviour and problems regarding static electricity have not been reported with stationary sampling, even when no measures were taken to minimize static electricity charges.[Citation6]
Previous studies[Citation8,Citation12] of stationary sampling with the UNC sampler, compared to impactors and cyclones, have not shown the type of large overestimation here observed in personal sampling. As has already been concluded, the particles appeared to originate from the work environment, not from, e.g., textile or skin from the worker. Further, the particle size distribution resulting from the present analyses of UNC samples resemble previously reported observations from the same mine using an aerodynamic particle sizer to characterize the particles.[Citation12] Therefore, there may be one or more additional factors, that were not present with stationary sampling, that affected how the particles were deposited and led to the vast surplus of collected particles and the large difference between the pairwise measurements in the UNC samplers. Some of the workers were exposed to bursts of higher concentrations of particles in their ordinary work because the workers were not stationary and moved around in and out of these short bursts. It is not known how the UNC sampler measures such bursts or peak exposures.
The choice of using the area factor, instead of the mesh factor, when converting particle count data to concentrations is not a possible explanation of large overestimations when measuring respirable fraction: impact of this choice on respirable fraction mass concentration is modest in comparison to the large overestimation observed in this mining application.[Citation12] The area factor was selected for use in this study because the normalized mass concentration distribution appeared plausible for air, with a peak around 3 µm, only when that model was applied. For deeper discussions on mesh factor and area factor, please refer to our previous article[Citation12] and its references. The present pilot study can however not rule out the possibility that non-airborne large gravel particles falling off from the worker could have deposited into the passive samplers. If that has been the case, such non-airborne particles could potentially explain mass concentration distributions that are implausible for air, as those shown in . Therefore, the plausibility of the mass concentration distribution cannot be basis for a final conclusion on the choice between the two UNC analysis models for use of the sampler in personal sampling. It is an indication in favour of the area factor, but it cannot be taken as final evidence.
Sampler positioning and static electricity may be the two most likely explanations for the high concentrations from the UNC samplers. However, it should be noted that the present study is an early-phase pilot study, without further experiments to provide sufficient information to rule out other potential explanations. The observation in of particles outside the circular sampling area raises concern that there may have occurred contamination from the outside of the sampler when preparing the polycarbonate surface for microscopic analysis. This possibility should be considered when further studies are designed. It would be surprising if that could explain a 30-fold overestimation with reasonable particle size distribution, but data has not been gathered to completely rule that out. Unnoticed overlap of particles, leading to an overestimation of the particle volume because particles are assumed to be spherical when mass is calculated, could contribute to overestimation but any such effect would be small in the present context. The limits of detection were not assessed for the methods used in this pilot study. It is, however, clear from stationary sampling in the same mine that the precision of the methods is limited but can still produce results with fair correlations.[Citation12] In ambient monitoring, large variation has in some cases been attributed to salt particles or aluminium from salt-related corrosion of the passive sampler shelter.[Citation18] While these effects are not probable explanations of the variations observed herein, they point at potential sources of error that should be taken into account in future, more extensive, studies.
It is common practice in stationary sampling to mount measurement devices away from walls, and adopting a similar approach might be beneficial for personal sampling with the UNC sampler. In working environments where the workers wear helmets, one could mount the samplers on top of the helmet, ensuring air flows in all directions and removing the rubbing of the clip holder, and possibly reducing the build-up of static electricity. Ideally, grounding could be arranged to avoid static electricity. Positioning of the UNC sampler for personal sampling needs to be studied further. The UNC sampler also needs to be studied under conditions in which it is subject to bursts of high occupational exposure.
Despite these limitations, a reasonable particle size distribution was still obtained, and the deposited particles appeared indeed to be of mineral origin and not textile or skin. The UNC sampler should continue to be researched for personal sampling, and although it is not ready to be used as it was in this study, it might become a useful alternative in the future.
Supplemental Material
Download MS Word (6.2 MB)Acknowledgments
The authors acknowledge the facilities and technical assistance of Dr. Cheng Choo Lee of Umeå Core Facility Electron Microscopy (UCEM) at the Chemical Biological Centre (KBC), Umeå University. The authors state no potential conflict of interest.
Additional information
Funding
Related Research Data
References
- Wiebert, P., M. Lönn, K. Fremling, et al.: Occupational exposure to particles and incidence of acute myocardial infarction and other ischaemic heart disease. Occup. Environ. Med. 69:651–657 (2012).
- Torén, K., and B. Järvholm: Effect of occupational exposure to vapors, gases, dusts, and fumes on COPD mortality risk among Swedish construction workers. Chest 145:992–997 (2014).
- Poinen-Rughooputh, S., M.S. Rughooputh, Y, Guo, et al.: Occupational exposure to silica dust and risk of lung cancer: An updated meta-analysis of epidemiological studies. BMC Public Health 16:1–17 (2016).
- Nothstein, G.L., R.M.A. Hahne, and M.W. Spence: Evaluation of the cost-effectiveness of various passive monitors and active monitors for industrial hygiene sampling. AIHA J. 61:64–68 (2000).
- Wagner, J., and D. Leith: Field tests of a passive aerosol sampler. J. Aerosol. Sci.32:33–48 (2001).
- Wagner, J., and D. Leith: Passive aerosol sampler. Part I: Principle of operation. Aerosol Sci. Technol. 34:186–192 (2001).
- Wagner, J., and D. Leith: Passive aerosol sampler. Part II: Wind tunnel experiments. Aerosol Sci. Technol. 34:193–201 (2001).
- Wagner, J., and J.M. Macher: Comparison of a passive aerosol sampler to size-selective pump samplers in indoor environments. AIHA J. 64:630–639 (2003).
- Leith, D., D. Sommerlatt, and M.G. Boundy: Passive sampler for PM10-2.5 aerosol. J. Air Waste Manage. Assoc. 57:332–336 (2007).
- Whitehead, T., and D. Leith: Passive aerosol sampler for particle concentrations and size distributions. J. Environ. Monit. 10:331–335 (2008).
- Shirdel, M., H. Wingfors, B.M. Andersson, et al.: A pilot study: The UNC passive aerosol sampler in a working environment. Ann. Work Expo. Health. 61:1029–1034 (2017).
- Shirdel, M., B.M. Andersson, I.A. Bergdahl, et al.: Improving the UNC passive aerosol sampler model based on comparison with commonly used aerosol sampling methods. Ann. Work Expo. Health. 62:328–338 (2018).
- Ott, D.K., W. Cyrs, and T.M. Peters: Passive measurement of coarse particulate matter, PM10–2.5. J. Aerosol Sci. 39:156–167 (2008).
- Schneider, T., V. Schlünssen, P.S. Vinzents, et al.: Passive sampler used for simultaneous measurement of breathing zone size distribution, inhalable dust concentration and other size fractions involving large particles. Ann. Occup. Hyg. 46:187–195 (2002).
- Hinds, W.C.: Aerosol Technology: Properties, Behavior, and Measurement of Airborne Particles. 2nd ed. New York: Wiley (1999).
- Licina, D., Y. Tian, and W.W. Nazaroff: Emission rates and the personal cloud effect associated with particle release from the perihuman environment. Indoor Air 27:791–802 (2017).
- You, R., W. Cui, C. Chen, et al.: Measuring the short-term emission rates of particles in the “personal cloud” with different clothes and activity intensities in a sealed chamber. Aerosol Air Qual. Res. 13:911–912 (2013).
- Peters, T.M., E.J. Sawvel, R. Willis, et al.: Performance of passive samplers analysed by computer-controlled scanning electron microscopy to measure PM10-2.5. Environ. Sci. Technol. 50:7581–7589 (2016).