
 ?Mathematical formulae have been encoded as MathML and are displayed in this HTML version using MathJax in order to improve their display. Uncheck the box to turn MathJax off. This feature requires Javascript. Click on a formula to zoom.
Abstract
The purpose of the study was to compare measured air and surface concentrations after application of biocidal spray products with concentrations simulated with the ConsExpo Web spray simulation tool. Three different biocidal spray products were applied in a 20 m3 climate test chamber with well-controlled environmental conditions (22 ± 1 °C, 50 ± 2% relative humidity, and air exchange rate of 0.5 h−1). The products included an insect spray in a pressurized spray can, another insect spray product, and a disinfectant, the latter two applied separately with the same pumped spray device. The measurements included released particles, airborne organic compounds in both gas and particle phase, and surface concentrations of organic compounds on the wall and floor in front of the spraying position and on the most remote wall. Spraying time was a few seconds and the air concentrations were measured by sampling on adsorbent tubes at 9–13 times points during 4 hr after spraying. The full chamber experiment was repeated 2–3 times for each product. Due to sedimentation the concentrations of the particles in air decayed faster than explained by the air exchange rate. In spite of that, the non-volatile benzalkonium chlorides in the disinfectant could be measured in the air more than 30 min after spraying. ConsExpo Web simulated concentrations that were about half of the measured concentrations of the active substances when as many as possible of the default simulation parameters were replaced by the experimental values. ConsExpo Web was unable to simulate the observed faster decay of the airborne concentrations of the active substances, which might be due to underestimation of the gravitational particle deposition rates. There was a relatively good agreement between measured surface concentrations on the floor and calculated values based on the dislodgeable amount given in the selected ConsExpo Web scenarios. It is suggested to always supplement simulation tool results with practical measurements when assessing the exposure to a spray product.
Introduction
Products containing active biocidal substances are used for many purposes both by consumers and professionals. The products have many beneficial effects such as to control insects, disinfect skin and surfaces, and protect surfaces from biological growth. However, as the active substances have inherent properties designed to eliminate or reduce living organisms, a human health risk assessment is an important part of biocidal product authorization. Risk assessment of a substance consists of an exposure assessment, which is compared to the identified hazard level. Exposure to biocidal products may occur either by inhalation or dermal uptake during use (i.e., primary exposure) or by contact with treated surfaces or oral intake after use (i.e., secondary exposure). For products intended for private consumers, the exposure assessment of primary and secondary exposure is mandatory and protective equipment cannot be assumed. Some of the typical products used in private homes are insecticides and disinfectants. Overall, the health risk of using the products depends on the exposure and the toxicity of the active substances and other harmful components in the products.
Epidemiological studies of both professional and domestic cleaning products, including disinfection products, have shown associations with adverse effects in the airways, e.g., asthma or exacerbation of pre-existing asthma (Vandenplas et al. Citation2014; Gonazlez et al. Citation2013; Folletti, Zock, Moscato and Siracus Citation2014) although the causative cleaning agents and the associated mechanisms have not adequately been identified. However, spray products are considered potential candidates, because they “may facilitate inhalation of respiratory irritants and sensitizers and contribute to the burden of asthma.” (Quirce and Barranco Citation2010; Zock, Vizcaya, and Le Moual Citation2010). Certain classes of chemicals have been suggested to be involved in development of asthma, e.g., biocides like isothiazolinones and quaternary ammonium compounds (QAC) (Vandenpla et al. Citation2014; Folletti, Siracusa, and Paolocci Citation2017). However, only few studies have reported exposure concentrations of biocides from spray products (Garrod, Rimmer, Robertshaw and Jones Citation1998; Berger-Preiß et al. Citation2005; Berger-Preiß et al. Citation2009; Hahn et al. Citation2010; Losert et al. Citation2014).
In the process of authorization of consumer spray products, information is required about the exposure levels of the user and other people present as well as information on the spray pattern and spray particle size. The product with its active substances must be safe to use for the intended application. Measurement data of the exposure during use of biocidal spray products are often difficult and costly to obtain, and no specific guideline is available for the measurements. Due to this, modeling software is often used for simulation of exposure to support applications for biocidal product authorisation. Authorities therefore often rely on results from computed exposure assessment when evaluating biocidal product applications. The European Chemicals Agency (ECHA) recommends using simulation tools such as ConsExpo (ECHA Citation2017).
ConsExpo was developed by the Dutch National Institute of Public Health and Environment (RIVM) to estimate and assess exposure to substances from consumer products, e.g., paints, cleaning agents, and personal care products. For spray products, a specific simulation model was incorporated to describe the exposure to non-volatile aerosols (particles). This was developed based on experimental data on both spray cans and trigger sprays at different spray rates and droplet diameters which is controlled by the spray equipment. ConsExpo includes measurements from spraying on people, into rooms and onto surfaces. The particle size distribution and their concentrations in the air are measured as a function of time after spraying at different distances from the spraying position (Delmaar and Bremmer Citation2009). ConsExpo is based on several general and empirical equations and models, which enables calculation and exposure assessment of substances from consumer products used indoors. ConsExpo calculates both external and internal (systemic) dose via inhalation, dermal contact, and ingestion at both acute and chronic exposures to a defined substance in the spray product. ConsExpo has been recommended as the preferred simulation tool when human exposure to biocides is assessed (Gerritsen-Ebben and Van Hemmen Citation2007).
Since the evaluation often relies on calculations based on these tools, efforts to continuously improve and further validate the integrated scenarios are therefore crucial. The aim of this project was therefore to obtain realistic exposure data at well-defined conditions in a controlled test chamber for three different biocidal spray products and to compare with simulated data. The validation of existing exposure simulation tools with experimental data will help provide a more reliable risk evaluation of biocidal spray products.
Very complex conceptual models for inhalation and dermal exposure considering many supply and removal mechanisms have been published (Schneider et al. Citation1999; Tielemans et al. Citation2008). The most important removal mechanisms for the aerosols and gasses in the climate chamber in this study are considered to be the air exchange rate, gravitational sedimentation of the aerosols, and adsorption and adherence to the chamber walls.
Materials and methods
Selected biocidal spray products
Three commercial spray products already available on the market were selected.
Biocide 1. Used for rapid control of flying insects by private consumers indoors; organic solvent-based and propellant-driven pressurized spray can.
Active substances: Pyrethrum extract, Permethrin, Piperonyl butoxide
Biocide 2. Indoor insecticide for professional use, dispersion of microcapsules containing the active substance in water stabilized with polyvinyl and ethoxylated alcohols, pumped spray formulation. It is diluted to 2% in water and loaded into a pumped spray device (Gloria 505T) and adjusted to maximum aerosol generation.
Active substance: λ-Cyhalothrin
Biocide 3. Used for professional disinfection and cleaning, in aqueous solution, pumped spray formulation. It was automatically diluted to 2% in water and loaded into a pumped spray device (Gloria 505T) and adjusted to maximum aerosol generation.
Active substance: Benzalkonium chlorides
These biocidal spray products were selected based on diversity and content of both volatile and non-volatile active substances in order to test a broad representation of biocidal spray product types.
Climate test chamber
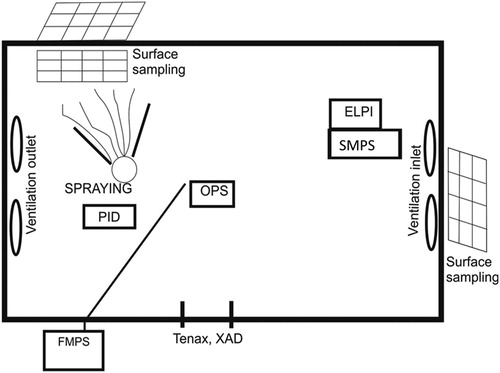
The products were tested in simulated exposure scenarios in a controlled climate chamber (20.3 m³ with an ante-chamber) at 22 ± 1 °C, 50 ± 2% RH and air exchange rate (AER) of 0.5 h−1 ( 1). For further specifications (Nørgaard et al. Citation2014). The chamber was cleaned twice before each emission spray test, first with 50/50% ethanol/water and subsequently with water. Background samples of air, floor, and walls were taken before each test. Background levels for the specific chemicals were generally between limit of detection (LOD) and 0.4 mg/m2 for surface samples, and between LOD and 5 µg/m3 for the air samples.
Figure 1. Climate chamber schematic. Sampling positions for chemical analysis is marked as Tenax TA and XAD-2. Aerosol measurements were performed in the middle and in the right side of the chamber. For wiping surfaces fields were drawn on the wall in the sprayed corner and the opposite corner and on the steel plate on the floor in the sprayed corner.
Spray products application
Application of the products was performed as far as possible with the manufacturers’ description to make the exposure scenarios realistic. Biocide 1 was sprayed in one corner of the chamber at height of the head of the operator but in different directions in the air within the angle marked from the spray position in . Biocide 2 and Biocide 3 were sprayed toward the chamber wall in one corner of the chamber (). In the sprayed corner of the chamber a 2-m2 steel plate covered the floor. A limited number of chamber experiments were successful due to different problems (see 1) in despite the fact that 3–5 chamber experiments were performed for each product. Spray mass generation rates (mass/time) were estimated by measuring the weight of the spray can before and after spraying for a specified time and then dividing the measured weight loss by the spray time. The test conditions and mass generation rates are shown in . According to user's manual for Gloria 505T the mass generation rate is 17 g/sec. Aerosol characterization of the three biocidal products was carried out in separate experiments in the climate chamber (). Particle size distribution was based on average of data 5–10 min after initial peak concentration with a resolution of 1 min−1. This time range was chosen due to better mixed particles with more stable size distribution though this may bias the distribution toward smaller particles because of settling of larger particles. Mass size distributions are shown in Figure 1S (Supplementary Materials).
Table 1. Spray characterization of the three biocidal spray products.
Chemicals
Structures and vapor pressures of the measured substances are shown in Table 1S. Calibration standards and solvents were: 1,2-benzisothiazol-3(2H)-one (97%), λ-cyhalothrin (Pestanal, 1,2-propanediol (ACS Reagent), piperonyl butoxide (Pestanal), permethrin (mixture of cis and trans isomers, Pestanal), pyrethrum extract (Pestanal), benzyldimethyldodecylammonium chloride (C12-benzalkonium chloride, ≥99.0%), and benzyldimethyltetradecylammonium chloride (C14-benzalkonium chloride, ≥99.0%) were obtained from Sigma-Aldrich. Methanol (MS-grade) and decane (99.8%) were from Fluka. Toluene (99.8%) was from Merck. LC solvents: Methanol (MS grade, Fluka) and Millipore water with 2 mM ammonium acetate (LC-MS ultra, Aldrich-Sigma) and 1% formic acid (98%, Merck).
Sampling Protocols
Airborne organic compounds ((S)VOCs) sampled on Tenax TA and XAD-2
Tenax TA tubes (200 mg/tube, mesh 60-80, Perkin Elmer, Denmark) were cleaned before sampling in a stream of pure nitrogen at 300 °C for 180 min and 340 °C for 30 min using a sample tube conditioning apparatus (TC-20, Markes International, UK). Background concentrations for single (S)VOCs were < 0.1 ng/tube. XAD-2 tubes were used as received (ORBO 43 Supelpak-20 with specially treated Amberlite XAD-2 (20/40), Sigma-Aldrich, Denmark). Background measurements were performed by sampling on Tenax TA and on XAD-2 for 10 min with flow of 200 mL/min and 2000 mL/min, respectively. The sampling was performed by passing the sampling tubes through tube holes in the chamber wall to be able to change the sampling tubes quickly without interfering with the chamber experiment. Sampling position was behind the spraying position at 1 m height 10 cm from the chamber wall (). Sampling pumps were placed outside the chamber. Sampling was started immediately (1–2 min) after the spraying event: First short-term sampling for 10 min, then sampling for 15 min within the first hour, then every 30 min for the following three hours, and once per hour for the following 4–6 hr. All together between 9 and 13 duplicate samples were collected for each chamber experiment. Total concentration of organic substances in the gas phase just behind the spraying position was monitored by a photo ionization detector (PID, see ) (MultiRAE, RAE Systems, Denmark).
Surface-deposited organic substances sampled by wiping
The walls and the floor plate were wiped in predefined fields () with alcohol swabs using both sides of the swab and wiping back and forth and using new nitrile gloves. It was single packed swabs (30 x 60 mm) of 60% viscose, 20% polyester, and 20% other synthetic fibres soaked in 70% isopropanol solution. The wiped fields were 20 cm x 10 cm (200 cm2) and all together 10 different positions were wiped: left and right positions on the wall at two heights (child 30–50 cm and adult 120–140 cm) and on the floor plate in front of the sprayer and left and right positions at two heights on the right chamber wall, respectively (see ). The test area was wiped before spraying (background) and after 6–8 hr (Day 1) and 24 hr (Day 2). On Day 2 a new test area next to the preceding one from Day 1 was wiped. For Biocide 3: The floor plate was washed 20 min after spraying (according to the instruction on the product), presumably to remove excess active chemical which by that time had reached full effect. Thus, the first wipe sample was taken after washing of the floor plate. After wiping the swab was placed in a 10-mL glass vial with screw cap. Samples were stored in freezer until analysis.
Filters used for personal dermal exposure
The operator who performed the spraying carried a glass fibre filter on the forehead and on the forearm to measure the deposited amount of spray substances on areas that potentially could cause dermal exposure. The filters were fastened to the full suit with safety pins. The glass microfiber filters (GF/C 47mm Ø circular, cat no 1822 047) were from Whatman, Denmark.
Analysis of samples
Detailed descriptions are given in the Supplementary Material and a short description is given in the following text. Organic compounds sampled on Tenax TA were analyzed by thermal desorption gas chromatography and mass spectrometry (TD-GC-MS). The content of the XAD-2 tubes, the wipes, and filters for personal dermal exposure were extracted with methanol in ultrasonic bath and the extract analysed by GC-MS or liquid chromatography mass spectrometry (LC-MS) depending on the nature of the analytes.
Aerosol measurements
Aerosol measurements were conducted using several instruments to measure number size distribution spectra from 6 nm to 10 µm at different locations in the chamber (). Fast Mobility Particle Sizer (FMPS, TSI Model 3091, Shoreview, MN) was operated at 1-sec time resolution in the measurement range: 0.056–0.56 µm; the sampling flow was 10 L/min and with exhaust outside the chamber. Scanning mobility particle sizer (SMPS, NanoScan, TSI Model 3910, Shoreview, MN) with 1-min resolution and measurement range from 0.01–0.420 µm. OPS (Optical Particle Sizer, TSI, Shoreview, MN) with 1-sec time resolution was used to detect particles from 320 nm to 10 µm. Electrical Low-Pressure Impactor (ELPI, size range: 6 nm–10 µm, Dekati Ltd., Finland) with 1-sec time resolution was used to measure in the same location as the NanoScan. We observed that the mixing inside the chamber was so fast that measurement at one position was sufficient for the aerosol number and size measurements. We also found that data was similar across the instruments and therefore focused on FMPS, SMPS, and OPS to cover the size range for aerosols capable of reaching the alveolar region of the lungs. Particles larger than 10 µm are still inhalable but are usually deposited in the upper airways. In addition, lifetime of 10 µm particles in air is short since the terminal settling velocity at standard conditions is 18 cm/min (Hinds Citation1998). Total number concentration was integrated from the number size distribution measurements. Number size distributions and total number concentrations were converted to the mass using an assumed mean density of 1 g/cm3 for spherical aerosols.
Model fitting
The concentration development over time in the chamber was modeled using a first-order decay and for Biocide 2 also a first-order decay model which takes into account the AER proposed by Dunn and Tichenor (Citation1988). The latter model assumes a continuously emitting and decaying source that follows a first-order decay and this was assumed to be the case for emission from the microcapsules that are contained in Biocide 2. The first-order decay is described by EquationEquation (1)(1)
(1) :
(1)
(1)
EquationEquation (1)(1)
(1) is assumed as a good approximation for description of all loss mechanisms combined in one constant (k1). Due to the very short spraying time of 5–10 sec () the spraying is considered an instantaneously release of aerosols and that decay starts at time = 0.
Contaminant emission from the microcapsules contained in Biocide 2 was modelled as exponentially decreasing from a source of finite mass with loss constant k1. Removal of contaminant from the chamber air by the AER was modeled as an exponential decay with loss constant k2. The constant k2 combines removal by air flow from the chamber and other possible removal mechanisms (e.g., adsorption onto surfaces, particle settling). This model proposed by Dunn and Tichenor (Citation1998) is expressed in EquationEquation (2)(2)
(2) :
(2)
(2)
where C(t) = concentration as function of time (µg/m3), C0 = concentration at t = 0, k1 = first-order decay constant (h−1), A = initial mass of substance in source (µg), t = time (h), k2 = AER (h−1), and V = volume of chamber (m3). EquationEquations (1)
(1)
(1) and Equation(2)
(2)
(2) were fitted to the experimental data points using the non-linear regression function in Minitab (Minitab 17.1.0.0, State College, PA).
Simulations of exposure concentrations in ConsExpo Web
The concentration time series after one spray event was simulated by ConsExpo Web (version 1.0.6, 13-02-2019, RIVM, The Netherlands) for the active substances in Biocide 1, Biocide 2, and Biocide 3 (see at the bottom). Concentrations in two scenarios were simulated, one with few parameters changed and one where many parameters were changed compared to the default values from the fact sheets in ConsExpo Web. In the few parameters scenarios only parameters that can be easily obtained from the experimental conditions using a watch, ruler and MSDS information were changed (). In the many parameter scenarios as many parameters as possible were adjusted to the experimental conditions in the climate chamber. According to the intended use of the products, the most relevant scenarios were selected within the fact sheet database in ConsExpo Web (). In all cases, where no value from the experimental setup was available, default values were applied (). The experimentally measured concentrations were compared with the scenarios simulated in ConsExpo Web.
Table 2. Parameters and settings in the ConsExpo Web simulations and selected results for the active substances. Experimental values inserted in place of default values are underlined.
Results and discussion
Experimental measurements
Biocide 1
The main organic substances and the active substances were present both on the Tenax TA and the XAD-2 tubes. It was assumed that both the gas and particle phases of the substances were collected with high efficiency during the air sampling since at least XAD-2 sorbent beds have been shown to efficiently filtrate 0.1–1 µm particles from an air stream (Kogan, Kuhlman, Coutant, and Lewis Citation1993). However, Tenax TA sampling generally gave higher concentrations as shown by the ratios (Tenax TA/XAD-2) of 2, 6, and 1.2 for permethrin, piperonyl butoxide, and pyrethrum extract, respectively. The ratio of 0.75 for alkanes was the only exception. Factors such as desorption efficiency and large differences in the sampling flows and volumes, Tenax TA (2 l) vs. XAD-2 (20 l) may be the cause. Calibration of the thermal desorption analysis of the Tenax TA tubes includes the desorption step and thus the recovery is accounted for by the calibration. However, this is not the case for the XAD-2 tubes, which may explain the higher concentrations obtained by Tenax TA sampling. The Tenax TA results shown in were chosen for further analysis.
The results showed a general tendency to a faster decay of the organic substance concentrations than could be explained by the AER () except alkanes that followed a first order decay governed by the AER. The same tendency was observed for the particle mass concentration () while the particle number concentration decayed with a speed close to that of the AER. The faster decay of the mass concentration may be explained by higher deposition rate of particles above 1 µm carrying much of the mass. The organic substances that have a faster decay than the AER also indicates that they are associated with particles and less abundant in the gas-phase. This is reflected by the fact that low vapor pressure substances (see Table 1S) tended to decrease fastest as illustrated by their first-order decay constants, k1 (). The k1 values tend to decrease with increasing logarithm to the vapor pressure with dimethoxymethane and the most volatile alkanes as outliers (see Figure 2S). High vapor pressure increases the tendency for substances to be in the gas-phase and thus to be ventilated out by the air exchange and not deposited with the aerosol droplets. This decreases k1 since the sedimentation removes substances faster than the AER. Dimethoxymethane may be associated with the active substances in the particles since they have similarities in structure which may decrease the tendency to enter the gas-phase and thus resulting in a higher k1 value.
Figure 2. Concentration vs. time data for active substances and alkanes after spraying Biocide 1 in the chamber (data from one experiment). The lines are the fitted first-order decay functions (see ). The black dotted line shows a decay following the air exchange rate. The ConsExpo Web curve is based on the many parameter scenario.
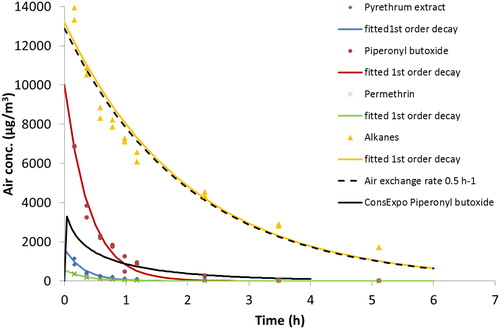
Table 3. Measured maximum air concentrations (out of 2–3 experiments) emitted during application of the biocidal spray products, parameters of fitted first-order decay model (k1 and C0 in EquationEquation (1)(1)
(1) ) with two-sided confidence limits, and available occupational exposure limit values.
The measured maximum concentrations () are remarkably close to the theoretical maximum concentrations at time = 0 based on the fitted first-order decay. This indicates, that the first-order decay well describes the concentration development over time irrespective of substances’ association with the aerosol particles or the gas-phase. As expected, the measured maximum concentrations were generally lower than the theoretical since they represent the mean concentrations obtained 10 min after spraying. Under similar conditions, Berger-Preiß et al. (Citation2009) found maximum concentrations of 5.9 and 2.6 mg/m3 for piperonyl butoxide and pyrethrum extract, respectively, which are similar to the levels in the present study. Berger-Preiß et al. (Citation2009) used a spray product with the same content, spray type, and spraying duration, but a 40 m3 room with unknown AER.
The wipe samples showed that the biocides were deposited on the surfaces near the spraying position, mostly on the floor and considerably less on the wall at child height (). This also supports the conclusion that the fast decay of both airborne particles and organic substances were due to gravitational particle deposition of larger particles. On Day 1, mean concentrations from the three tests on the floor were 10.4, 2.2, and 1.0 mg/m2, for piperonyl butoxide, pyrethrum extract, and permethrin, respectively. Their concentrations were similar the day after (12.0, 2.0, 1.2 mg/m2, respectively), implying that the active substances remain deposited on the surfaces. The personal exposure sampled on glass fiber filters on forehead and forearm were below limit of detection, whereas Berger-Preiß et al. (Citation2009) with similar sampling method but longer exposure duration of the operator could detect both piperonyl butoxide and pyrethrum extract, however, in highly variably amounts.
Biocide 2
All measurements of the active substance (λ-cyhalothrin) were below LOD both on Tenax TA and XAD-2 tubes. Other organic substances were found only on Tenax TA tubes (). It was assumed that both the gas and particle phases of the substances were collected quantitatively during the air sampling (see above for Biocide 1). However, comparison of and show that the general concentration level is about a factor of 20 lower than observed for Biocide 1; this is likely due to the waterborne formulation of Biocide 2 with low content of organic substances as well as the application onto a surface rather than in the open air.
Biocide 2 consists of microcapsules that are designed to be picked up by insects. The active substance is contained in the capsules probably together with all other organic compounds in the product. The organic compounds may be released from the capsules like from a solid paint film (Clausen Citation1993). This may explain that emission curves of trimethylbenzene and propylbenzene () appear more like classical curves for a first-order decaying source in a ventilated room (EquationEquation (2)(2)
(2) ). However, this model does not fit very well as it underestimates the concentrations after 1 hr (Figure 3S). Also, the propanediol concentration increases more slowly than can be explained by the model. Similar behaviour has been observed for glycol ether from a film of kitchen cleaning agent (Nørgaard et al. Citation2014).
Figure 3. Total particle number and mass concentrations measured by the OPS vs. time in the chamber after spraying Biocide 1 (A), Biocide 2 (B), and Biocide 3 (C) (data from one experiment).
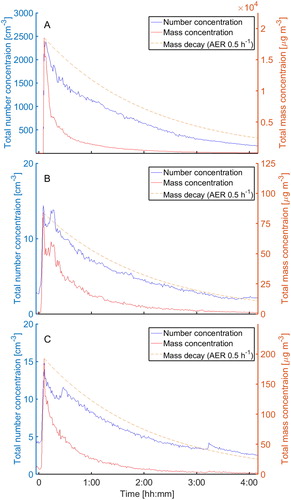
After the spray application, a plume of particles above 0.5 µm was observed, however, the number concentration was very low, less than 20 particles/cm3 (. For particles below 0.3 µm there was no change compared to the initial concentration in the chamber. This agrees with the Tenax TA measurements, which indicated no evaporation of VOCs from airborne particles and the absence of active substances (). However, the total mass concentration of particles went from maximum of about 70 µg/m3 to < 1 µg/m3 within 4 hr (.
The active substance and the product preservative (1,2-benzisothiazol-3(2H)-one) were only detected in the wipe samples, mostly on the floor and at children’s height near the spray area, while the amount was marginal at adult height (). The maximum values on the floor out of four experiments with a spraying time between 4.3 and 5 sec were on Day 1 for λ-cyhalothrin and 1,2-benzisothiazol-3(2H)-one, 9 and 17 mg/m2, respectively. The floor and wall concentrations of λ-cyhalothrin were unaltered on Day 2. For 1,2-benzisothiazol-3(2H)-one only the floor concentration was unaltered on Day 2; concentrations at adult height were below LOD both days, while at child height it went from 8.2 mg/m2 to below LOD. The filters for personal dermal exposure to airborne organic substances were all < LOD.
Table 4. Mean surface and dermal exposure concentrations of substances emitted during application of biocidal spray products.
Biocide 3
The main airborne substances identified on the XAD-2 tubes were the active substances C12- and C14-benzalkonium chlorides (). The benzalkonium chlorides are expected only to be airborne as aerosols due to their low vapor pressure (Table 1S). The benzalkonium chlorides were detected on XAD-2 in air up to 36 min after the spraying. It is noteworthy that the benzalkonium chlorides were measurable in air when λ-cyhalothrin and benzisothiazolone in Biocide 2 were not, since they were applied with the same pumped spray device. This might be due to the much higher LOD in air for the latter substances (Table 2S). The results could approximately be described by a first-order decay and showed a faster decay of the benzalkonium chloride concentrations than could be explained by the AER ( and 5). Since the benzalkonium chlorides are associated with the aerosols only, this illustrates the high deposition rate of the large aerosol particles from the pumped spray. Like for the Biocide 1 the theoretical maximum concentration (C0) is close to and slightly higher than the measured one.
A plume of particles above 0.5 µm was observed after spray application of Biocide 3, however, the concentration was below 20 particles/cm3 (. The number concentration of particles under 0.3 µm was at the same level as the initial (background) concentration in the chamber. This means that no fine aerosols were formed by the pumped spray. However, the total mass concentration of particles went from a maximum of about 160 µg/m3 to < 1 µg/m3 within 4 hours (. The maximum total particle mass concentration of about 160 µg/m3 multiplied by 2%, which is the dilution of Biocide 3 in water, and 9.5%, which is the content of benzalkonium chlorides, results in a chamber concentration of 0.3 µg/m3 of benzalkonium chlorides. This is 37 times below the maximum measured concentration of benzalkonium chloride of 11 µg/m3 (the theoretical maximum concentration at no ventilation was 10,000 µg/m3). This large discrepancy is most likely due to underestimation of the particle mass concentration. This underestimation may be due to evaporation of water from the aerosol droplets and the fact that particles with diameters above 10 µm are not measured with the particle monitors but may well be sampled on the XAD-2 tubes and that large particles contain the major part of the mass.
The personal dermal exposure sampled on head and forearm showed minor amounts of benzalkonium chlorides. This shows that there actually is an airborne exposure both by inhalation and by deposition on skin.
The wipe samples showed that the benzalkonium chlorides are concentrated around the spray area, mainly at the floor and with minor concentrations at adult, and child heights ().
Simulations of exposure concentrations in ConsExpo Web and comparison with measured concentrations
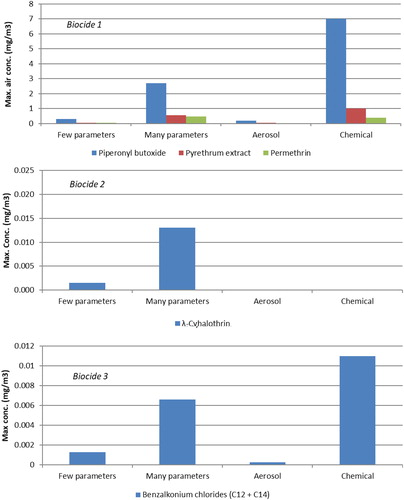
The concentration development over time after a single spray event of Biocide 1, Biocide 2, and Biocide 3 was simulated in ConsExpo Web for all active substances in the products. Two scenarios were simulated: a few parameters scenario and a many parameters scenario. The difference between the two scenarios is the number of default parameters that were replaced by experimentally determined parameters (). The peak concentrations simulated by ConsExpo Web are shown in and the concentration vs. time curves for piperonyl butoxide and benzalkonium chloride generated by ConsExpo Web can be compared with measured concentrations in and , respectively. The ConsExpo Web simulated and measured maximum concentrations are compared in .
The ConsExpo Web simulated peak concentrations of the active substances in Biocide 1 based on the many parameters scenario are about 10 times higher compared to the few parameter scenario ( and ). This difference is primarily caused by an experimentally higher airborne fraction of substance and smaller median diameter of the aerosol particles, which as parameter in ConsExpo Web results in higher air concentrations (see Figure 4S). However, also the weight fraction of substance, room volume, and AER are important. The experimentally estimated mass generation rate was equal to the default value in the selected scenario in ConsExpo Web. Thus, data about mass generation rate and particle size distribution for spray products is important for realistic ConsExpo Web simulation of exposure concentrations. This is further supported by comparison of the peak concentrations from the ConsExpo Web simulations of Biocide 1 with the experimentally estimated maximum concentrations shown in . However, the simulated peak concentrations in the many parameter scenarios were about half the measured maximum concentrations and the few parameter scenarios even lower.
Figure 4. Concentration vs. time data for organic substances after spraying Biocide 2 in the chamber (data from one experiment).
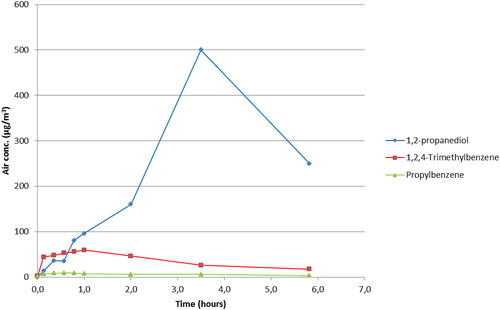
Figure 5. Concentration vs. time data for active substances after spraying Biocide 3 in the chamber (data from one experiment). The lines are the fitted first-order decay functions (see ). The ConsExpo Web curve is based on the many parameter scenario.
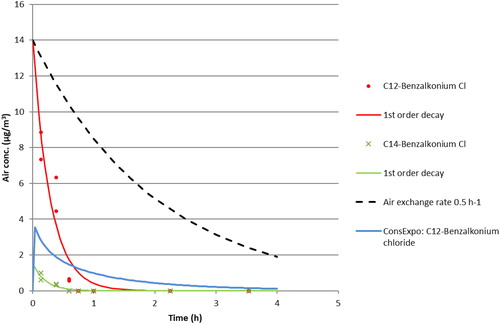
Figure 6. Comparison of simulated peak and experimental maximum exposure concentrations of Biocide 1 after one spray event. Columns termed Few and Many parameters are simulated exposure concentrations in ConsExpo Web and columns termed Aerosol and Chemical are exposure concentrations estimated based on aerosol and chemical measurements, respectively.
A comparison between experimental measurements and simulated estimates of inhalation exposure during use of consumer spray products was also performed by Park, Yoon, and Lee (Citation2018). One consumer spray product was sprayed for 5 and 15 sec, respectively, and the aerosol concentrations were measured in a chamber similar to the chamber used in the present study. The measurements were compared to simulated estimates in several simulation tools including ConsExpo Web. The authors found that for short-term exposures, the estimates were acceptable in comparison to the measurements; however, for long-term exposure the simulation tools were less accurate (Park et al. Citation2018). Another study of the exposure to DDT from indoor residual spraying in a malaria vector control programme showed a large underestimation in the ConsExpo 5.1 b01 simulated exposure (Wassie, Spanoghe, Tessema, Steurbaut Citation2012). However, the specific parameters entered in the ConsExpo simulation tool was not described in detail.
Biocide 2 and Biocide 3 show the same pattern for simulated peak and measured maximum concentration as for Biocide 1. The few parameter scenario peak concentrations are about 10 times lower than the many parameter scenarios, the maximum concentrations based on the aerosol mass concentration are even lower, and the measured concentrations of the active substances are about twice the many parameter scenario peak concentrations (). However, for Biocide 2 the measured concentration of the active substance, λ-cyhalothrin, was below LOD, which is also about twice the simulated peak concentration for the many parameter scenario simulated by ConsExpo Web. The difference between the few parameters and many parameters scenarios for Biocide 2 is primarily caused by the almost 30 times higher experimental mass generation rate () but partly counteracted by a more than four times smaller airborne fraction. The same is found for Biocide 3, which in addition also has a much lower experimental AER. Thus, experimental data on mass generation rate and airborne fraction are important for realistic ConsExpo Web simulation of spray product exposure concentrations. The strong underestimation of maximum concentrations based on aerosol mass concentration for all three spray products may be due to fast evaporation of solvent and water from the aerosol droplets and the fact that particles with diameters above 10 µm are not measured with the particle monitors but may well be sampled on the adsorbent tubes.
The experimental first-order decay constants (k1, ) are much higher than the AER and highest for Biocide 3. The high k1 for Biocide 3 may be due to fast deposition of particles larger than 10 µm that are not measured by the particle monitors. The experimental k1 values are also much higher than can be simulated by the ConsExpo Web simulations even for very large particles (Figure 4S). This indicates that the gravitational particle deposition rates are underestimated in the ConsExpo Web simulations.
Evaluation of wipe samples and post application exposure
In the following comparisons we assume that the amount of active substances wiped off the chamber surfaces is equal to the content (%) of active substance in the biocidal product multiplied with the dislodgeable amount of product given in the ConsExpo Web scenarios. The ConsExpo Web scenario Pest control products, Sprays, Air space, Post application (child), which applies for Biocide 1, has the default value of dislodgeable amount of product of 820 mg/m2 which multiplied with the content of active substances gives 10 mg/m2, 2 mg/m2, and 1.8 mg/m2 for permethrin, pyrethrum extract, and piperonyl butoxide, respectively. The measured surface concentrations on the floor () were 10.4 mg/m2, 2.2 mg/m2, and 1.0 mg/m2, respectively. In the case of Biocide 2, the ConsExpo Web scenario Pest control products, Sprays, General surface, Post application (child), has the default value of dislodgeable amount of 6100 mg/m2. Multiplying this value with the content of λ-Cyhalothrin gives 12 mg/m2. The measured surface concentration on the floor () was 3.8 mg/m2. Thus, for Biocide 1 and 2 there are relatively good agreements between calculated and measured concentrations on the floor. In the case of Biocide 3 when the ConsExpo Web scenario shown in is applied it is not possible to choose post application exposure.
Health risk assessment
Occupational exposure limits (OEL) for inhalation exposure were unavailable for the majority of the identified substances including the active substances.
Biocide 1
The WHO reference dose (RfD) for permethrin ≤0.25 mg/kg/day (Chrustek et al. Citation2018). In the Competent Authority Report for permethrin, the Acceptable Exposure Level (AEL) for permethrin for medium and long-term exposure was set to 0.05 mg/kg/day based on a long-term carcinogenicity study (EU Citation2014). One spraying with Biocide 1 for 10 sec will result in an exposure of 0.011 mg/kg bw/day according to estimation based on the many parameter scenario simulated in ConsExpo Web. Thus, based on the present study, the use of Biocide 1 would be considered safe as the exposure constitutes 22% of the AEL. However, if the product is used more than five times a day, every day a health risk may be present. Such a usage pattern is though, more likely in professional use, where protective equipment would be required.
Biocide 2
Those OEL values identified for the trimethyl- and propyl-benzene, indane, and 1,2-propanediol were substantially higher than the measured concentrations; see . Since it was not possible to measure the active substance (λ-cyhalothrin) of Biocide 2 in the air due to the concentration being below LOD, the result cannot be compared with the OEL (). However, it can be assumed that the inhalational exposure to this product is minimal and below the LOD of 0.022 mg/m3 which is half of the OEL. The risk of inhalation exposure to this type of spray application is therefore assumed not to be significant. It should also be noted that the active substance in Biocide 2, gradually leaks out from small capsules deposited on walls and floors, which explains the emission curves shown in . It may therefore be expected to pose a greater risk of dermal/secondary exposure.
Biocide 3
The Danish EPA (Berthelsen et al Citation2000) has given a limit value for QAC of 0.005 mg/m3 based on the lowest observed adverse effect level (LOAEL) modified by safety factors from an acute four hours inhalation study in rats. This limit value was exceeded by a factor of two when comparing to the measured concentrations of C12- and C14-benzalkonium chlorides in the present study (). Therefore, personal protective equipment would be required when applying the Biocide 3 spray product in the manner we have done in the present study.
It should, however, be mentioned, that the time used for application during the chamber exposure measurements, is low in comparison to the time assumed for professional use of the product. This was done for practical reasons in the chamber and as the main purpose of the study was comparison of experimental and simulated concentration estimates.
Conclusions
The pumped spray did not generate fine particles below 0.3 µm and the coarse aerosols had shorter residence time in air than could be explained by the AER. Even the fine aerosols from the pressurized can have deposition rates faster than the AER. Non-volatile benzalkonium chlorides, which are solely airborne as aerosols, could be measured in the air more than ½ hr after application with a pumped spray.
Air concentrations of the active substances and other organic substances with low vapor pressure decayed faster than could be explained by the AER, while the decay of more volatile substances followed the AER. These observations may be explained by high association of low vapor pressure substances with the aerosols and that more volatile substances mainly are in the gas-phase.
In general, the biocides deposited on surfaces near the spray position on the floor and little or below LOD on the wall at child height.
For all active substances, the lowest ConsExpo Web simulated concentrations were obtained in the few parameter scenario and the highest simulated concentrations were obtained in the many parameter scenario. For Biocide 1 and Biocide 3, the highest simulated concentrations were about half the measured concentrations. For Biocide 2 the measurements were below LOD, however, the simulated concentrations were also lower than LOD.
ConsExpo Web cannot simulate the observed fast decay of the concentrations of the active substances after the spray event. First-order decays fitted to the measured concentrations have much higher decay constants than first-order decays fitted to ConsExpo Web simulated concentration versus time curves. Even for very large particles ConsExpo Web underestimates the gravitational particle deposition rates.
For Biocide 1 and 2 there are relatively good agreements between measured surface concentrations on the floor and calculated values based on the dislodgeable amount given in ConsExpo Web. Experimental data on mass generation rate, particle size distribution and airborne fraction of spray products is important for realistic ConsExpo Web simulation of exposure concentrations. The maximum air concentrations of the benzalkonium chlorides were twice the recommended limit value by Danish EPA.
Based on our results, it is not always possible to accurately predict the actual exposure based on simulated data alone. In the present study, the ConsExpo Web simulations underestimated the exposure measured experimentally by at least two-fold. It is suggested to always supplement simulated exposure with experimental measurements when assessing the exposure to a spray product. Additional experimental data are required for further validation of the use of simulated data for exposure assessments in biocidal product authorisation procedures.
Supplemental Material
Download MS Word (261.4 KB)Additional information
Funding
Related Research Data
References
- Berger-Preiß E, Boehncke A, Könnecker G, Mangelsdorf I, Holthenrich D, Koch W. 2005. Inhalational and dermal exposures during spray application of biocides. Int J Hyg Environ Health. 208(5):357–372. DOI: 10.1016/j.ijheh.2005.04.006.
- Berger-Preiß E, Koch W, Gerling S, Kock H, Appel KE. 2009. Use of biocidal products (insect sprays and electro-vaporizer) in indoor areas—exposure scenarios and exposure modeling. Int J Hyg Environ Health. 212(5):505–518. DOI: 10.1016/j.ijheh.2009.02.001.
- Berthelsen P, Beltoft V, Thorup I, Søborg I, Nielsen E. 2000. Toxicological evaluation and limit values for 2-ethylhexyl acrylate, propylene carbonate, quaternary ammonium compounds, triglycidyl isocyanurate, and tripropyleneglycol diacrylate. Denmark: The Insitute of Food Safety and Toxicology Danish Veterinary and Food Administration. In Danish EPA Environmental Project, pp. 1–111. Report #555. Available at https://www2.mst.dk/udgiv/publications/2000/87-7944-210-2/pdf/87-7944-211-0.pdf.
- Chrustek A, Hołyńska-Iwan I, Dziembowska I, Bogusiewicz J, Wróblewski M, Cwynar A et al. 2018. Current research on the safety of pyrethroids used as insecticides. Medicina. 54(4):61. DOI: 10.3390/Fmedicina54040061.
- Clausen PA. 1993. Emission of volatile and semivolatile organic compounds from waterborne paints—the effect of the film thickness. Indoor Air. 3:269–275. DOI: 10.1111/j.1600-0668.1993.00008.x
- Delmaar JE, Bremmer HJ. 2009. The ConsExpo spray model—modelling and experimental validation of the inhalation exposure of consumers to aerosols from spray cans and trigger sprays. Bilthoven, Netherlands: National Insitute for Public Health and the Environment. Report #: 320104005/2009, pp. 1–70. Available from https://www.rivm.nl/bibliotheek/rapporten/320104005.pdf.
- Dunn JE, Tichenor BA. 1988. Compensating for sink effects in emission test chambers by mathematical modeling. Atmos. Environ. 22:885–894. DOI: 10.1016/0004-6981(88)90265-X
- European Chemicals Agency. 2017. Guidance on the biocidal products regulation—volume III human health - assessment & evaluation (Parts B + C). Helsinki, Finland: European Chemicals Agency. Available from https://echa.europa.eu/documents/10162/23036412/biocides_guidance_human_health_ra_iii_part_bc_en.pdf/30d53d7d-9723-7db4-357a-ca68739f5094.
- The European Parliament and Council of the European Union. 2014. Regulation (EU) No 528/2012 concerning the making available on the market and use of biocidal products. Assessment Report – Permethrin. Available at https://www.echa.europa.eu/documents/10162/17158507/consolidated_bpr_en.pdf.
- Folletti I, Siracusa A, Paolocci G. 2017. Update on asthma and cleaning agents. Curr Opin Allergy Clin Immun. 17(2):90–95. DOI: 10.1097/ACI.0000000000000349
- Folletti I, Zock JP, Moscato G, Siracusa A. 2014. Asthma and rhinitis in cleaning workers: a systematic review of epidemiological studies. J Asthma. 51(1):18–28. DOI: 10.3109/02770903.2013.833217
- Garrod ANI, Rimmer DA, Robertshaw L, Jones T. 1998. Occupational exposure through spraying remedial pesticides. Ann Occup Hyg. 42(3):159–165. DOI: 10.1093/annhyg/42.3.159
- Gerritsen-Ebben RM, Van Hemmen JJ. 2007. Human exposure assessment for biocides in the EU. Chimica Oggi Chem Today. 25(3):59–61. DOI: 10.1093/annhyg/mel060.
- Gonzalez M, Jégu J, Kopferschmitt MC, Donnay C, Hedelin G, Matzinger F et al. 2013. Asthma among workers in healthcare settings: role of disinfection with quaternary ammonium compounds. Clin Exper Allergy. 44(3):393–406. DOI: 10.1111/cea.12215
- Hahn S, Schneider K, Gartiser S, Heger W, Mangelsdorf I. 2010. Consumer exposure to biocides - identification of relevant sources and evaluation of possible health effects. Environ Health. 9(1):7. DOI: 10.1186/1476-069X-9-7
- Hinds, WC. 1998. Aerosol technology: properties, behavior, and measurements of airborne particles. New York: John Wiley & Sons, Inc.
- Kogan V, Kuhlman MR, Coutant RW, Lewis RG. 1993. Aerosol filtration by sorbent beds. J Air Waste Manage Assoc. 43:1367–1373. DOI: 10.1080/1073161X.1993.10467211
- Losert S, von Goetz N, Bekker C, Fransman W, Wijnhoven SWP, Delmaar C et al. 2014. Human exposure to conventional and nanoparticle-containing sprays—critical review. Environ Sci Tech. 48(10):5366–5378. DOI: 10.1021/es5001819
- Nørgaard AW, Kudal JD, Kofoed-Sørensen V, Koponen IK, Wolkoff P. 2014. Ozone-initiated VOC and particle emissions from a cleaning agent and an air freshener: risk assessment of acute airway effects. Environ Int. 68:209–218 (2014). DOI: 10.1016/j.envint.2014.03.029
- Park J, Yoon C, Lee K. 2018. Comparison of modeled estimates of inhalation exposure to aerosols during use of consumer spray products. Int. J. Hyg. Environ Health. 221(6):941–950. DOI: 10.1016/j.ijheh.2018.05.005
- Quirce S., Barranco P. 2010. Cleaning agents and asthma. J Invest Allergo Clin Immunol. 20(7):542–550.
- Schneider T, Vermeulen R, Brouwer D.H., Cherrie JW, Kromhout H, Fogh CL. 1999. Conceptual model for assessment of dermal exposure. Occup Environ Med. 56(11):765–773. DOI: 10.1136/2Foem.56.11.765
- Tielemans E, Schneider T, Goede H, Tischer M, Warren N, Kromhout H, et al. 2008. Conceptual model for assessment of inhalation exposure: defining modifying factors. Ann Occup Hyg. 52(7):577–586. DOI: 10.1093/annhyg/men059
- Wassie F, Spanoghe P, Tessema DA, Steurbaut W. 2012. Exposure and health risk assessment of applicators to DDT during indoor residual spraying in malaria vector control program. J Exp Sci Environ Epi. 22(6):549. DOI: 10.1038/jes.2012.45
- Vandenplas O, Wiszniewska M, Raulf M, de Blay F, Gerth van Wijk R, Moscato G et al. 2014. EAACI position paper: irritant-induced asthma. Allergy. 69(9):1141–1153. DOI: 10.1111/all.12448
- Zock JP, Vizcaya D, Le Moual N. 2010. Update on asthma and cleaners. Curr Opin Allergy Clin Immunol. 10(2):114–120. DOI: 10.1097/ACI.0b013e32833733fe