
 ?Mathematical formulae have been encoded as MathML and are displayed in this HTML version using MathJax in order to improve their display. Uncheck the box to turn MathJax off. This feature requires Javascript. Click on a formula to zoom.
Abstract
The Internet of Things (IoT) explores new perspectives and possible improvements in risk assessment practices and shows potential to measure long-term and real-time occupational exposure. This may be of value when monitoring gases with short-term maximum levels and for time-weighted average (TWA) concentrations used in standard measuring practices. A functional embedded system was designed using low-cost carbon monoxide (CO) electrochemical sensors and long-range-wide-area-network radio communication technology (LoRaWAN) was used to enable internet connectivity. This system was utilized to monitor gas levels continuously in the working atmosphere of an incineration plant over a 2-month period.
The results show that stable and long-term continuous data transfer was enabled by LoRaWAN, which proved useful for detecting rapid changes in gas levels. However, it was observed that raw data from the low-cost sensors did not meet the NIOSH accuracy criteria of 25% of the estimated true concentration based on field data from a co-located gas detector that met the NIOSH accuracy criteria. The new IoT technologies and CO sensor networks shows potential for remote monitoring of exposure in order to: (1) detect rapid changes in CO and other possible hazardous airborne gases; and (2) show the dynamic range of real-time data that may be hazardous for workers in the sampled areas. While the IoT low-cost sensors appear to be useful as a sentinel for monitoring hazardous atmospheres containing CO, the more useful finding may be showing real-time changes and the dynamic range of exposures, thus shedding light on the transient and toxic nature of airborne hazards. More importantly, the low-cost CO sensors are not a clear substitute for the more costly real-time gas detectors that perform within the NIOSH accuracy criteria.
Introduction
In recent years, an increasing interest in new communication technologies and the Internet of Things (IoT) has arisen. Sensor networks are used to collect real-time information from physical and chemical environments, and previous studies have described the use of sensors for measuring low concentrations of outdoor pollutants, especially in research on sustainable and smart cities (Castell et al. Citation2013; Esmaeilian et al. Citation2018). A vast number of commercially available low-cost gas sensors, radio communication technologies, power-efficient electronics, open source software, and hardware are all enablers of the IoT. Therefore, it is reasonable to assume that the IoT may be increasingly popular when investigating working environment exposures.
For example, solid waste incineration plants may benefit from IoT sensors. These plants are designed to produce electricity and heat, particularly for urban municipal areas, which has been practiced in Europe for decades. Whereas hazardous, recyclable materials such as plastics, glass, heavy metals, and other non-burnable materials are removed before burning, the flue gas cleaning process prevents the release of toxic pollutants from escaping to the outdoor environment. However, in this type of industrial workplace, workers may be exposed to combustion gases during maintenance or inspections near the incinerator. In addition, leakage caused by general wear and tear of machinery and poor ventilation measures may lead to increased concentrations of gas pollutants in the occupational environment. Exposure situations may be difficult to assess every hour of the day, unless continuously measured.
Standardized digital gas sensor instruments undergo periodic calibration and validation by the manufacturer to produce reliable data. However, these instruments are costly, typically ranging from $500–4,000, and may not be wireless or suitable for continuous gas level monitoring over extended periods of time due to their power-consuming electronics utilizing rechargeable batteries that typically last 8–12 hr before needing to be recharged. In contrast, commercially available factory calibrated low-cost sensors in conjunction with a functional IoT platform may cost approximately $100.
This study utilized electrochemical sensors for CO, which is a toxic, odorless, and colorless gas produced during insufficient burning of organic materials. The negative health effects of CO are well known and include heart and pulmonary diseases, neurotoxic effects, tissue inflammation, headaches, and nausea (Grandjean and Landrigan Citation2006; Ayer et al. Citation2016; Veronesi et al. Citation2017). In Norway, the 8-hr time-weighted average (TWA) permissible exposure limit (PEL) in the working environment is 20 ppm CO, and the 15-min short-term exposure limit (STEL) is 100 ppm (Norwegian Working Environment Act Citation2018). However, in the U.S., the National Institute for Occupational Safety and Health (NIOSH Citation2012) recommends a 35-ppm STEL for a 10-hr TWA during a 40-hr workweek and a ceiling level of 200 ppm. The Occupational Safety and Health Administration enforces an 8-hr TWA PEL of 50 ppm. To our knowledge, occupational CO exposure levels in solid waste incineration plants have been minimally studied, although waste management work has been studied in association with adverse health effects (Poulsen et al. Citation1995; Maître et al. Citation2003; Giusti Citation2009).
Areas inside an incineration plant that present a risk of CO leakage include those close to the slag transporter belts where toxic dust, ash, sludge, and slag are transported to a stock container for hazardous waste; near the recycling fan and flue gas cleaning process; and close to unsealed enclosures or inspection hatches near the incinerator, which may be opened during daily operations or inspections.
Incineration plants in general are massive, complex concrete, and steel structures that are built in order to provide appropriate fire security throughout the building; however, this may cause difficulties in radio communication signaling. Therefore, the communication technology performance is of vital importance for the stable transfer of data during measurement.
Therefore, the primary goal of this study was to design and build a complete and functional CO-IoT platform for measuring CO and observing the raw data transfer stability over the internet for a period of approximately 2 months. In addition, the effectiveness of the CO-IoT sensors in showing long-term changes in CO concentrations that could potentially be hazardous to workers inside the incineration plant was studied.
Methods
Designing and building the CO sensor modules
The long-range-wide-area-network (LoRaWAN) protocol (LoRa Alliance Inc. Citation2017) enables long-range data communication and facilitates low power consumption of electronics in a more efficient manner than higher bandwidth radio technologies, such as Wi-Fi, Bluetooth, or cellular. The module was designed around EE-02 (Exploratory Engineering, Telenor Digital AS, Trondheim, Norway), which hosts an nRF52 microcontroller (Nordic Semiconductor AS, Trondheim, Norway) and an SX1276 low-power radio transceiver (Semtech Corporation, Camarillo, CA, USA). The latter enabled LoRa connectivity with firmware running on the nRF52. The EE-02 component significantly reduced the overall design time and integration complexity with a low-cost commercially available CO sensor (SPEC Sensors, LLC, Newark, CA, USA). Two standard industrial D-cell batteries powered the CO sensor module, and to achieve the necessary battery life, the average current consumption of the module had to be less than 2 mA. While SPEC sensors utilized to support electronics require a 3.3 V power supply, the EE-02 can operate at voltages in the 1.8–5.5 V range and can be run directly from batteries. In sleep mode, the nRF52 power consumption (with RAM retention) was 1.5 A, and the current consumption of the LoRa transceivers in sleep mode was less than 1
A. This typically increased during the transmission cycle (depending on transmit power) to 60–80 mA for 1–2 sec. The gas sensors consumed approximately 2 mA in sleep mode, which was approximately three orders of magnitude more than the rest of the electronics in sleep mode, and in the active sensing mode, this increased to 5–6 mA. The minimum acceptable voltage for the digital CO gas sensor module was 2.6 V; consequently, a voltage regulator was added between the battery and the rest of the sensor electronics. Due to its low quiescent current, a TPS63030 buck/boost regulator was chosen for this task, which provided a stable 3.3 V from a minimum input of 1.8 V. Configured in a power-saving mode, the regulator’s quiescent current was a negligible 29
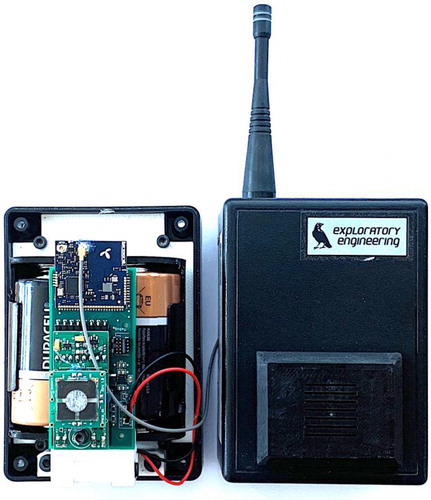
A. Battery voltage monitoring was performed via a 10 MOhm voltage divider connected to the analog-to-digital converter input on the nRF52 microcontroller. Firmware, implemented in the Apache myNewt real-time OS, enabled battery monitoring, sensor communication, and data transmission over LoRaWAN. To increase battery life, sample data was recorded every sixth minute, encoded in a data frame and transmitted as LoRA packets using the SX1276. For the module enclosures, we used off the shelf hard plastic encapsulation boxes and designed 3D printable brackets for mounting electronics and batteries. A HEPA filter was utilized as a particulate barrier between the outside and inside of the CO gas diffusion enclosure. shows the module components with a printed circuit board hosting a CO sensor and electronics inside a standard electronics enclosure.
Figure 1. Components inside a CO-IoT module. Components of a CO-IoT module with a printed circuit board hosting CO sensor, LoRa transceiver and electronics. 3D printed brackets were used as structural components inside a standard electronics enclosure.
Designing the IoT platform
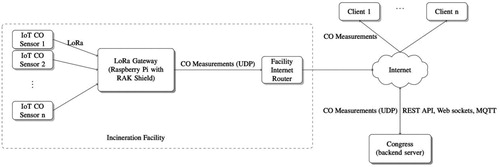
The RAK831 Raspberry Pi shield was utilized as the LoRa gateway and a packet forwarder running on the Raspberry Pi listened for LoRa packets in the Norwegian Industrial, Scientific, and Medical frequency band (868 MHz). Packets were forwarded via the user datagram protocol to a backend system. The web or application front ends can then receive data via the Representational State Transfer (REST) application program interface (API), Message Queuing Telemetry Transport (MQTT), or web sockets allowing real-time communication between clients and the backend system.
shows how the gateway is connected to the facility internet router and functions as a bridge between the LoRa radio network and the internet. The server decrypts, validates, and stores the received data from known LoRa networks in a local database. Data can be forwarded to another application running on a remote server via MQTT or accessed by clients via the REST API or web sockets.
Figure 2. High-level data flow diagram. IoT CO sensor application architecture overview. The battery-driven IoT sensors sample the CO concentration at regular intervals and transmits this data over LoRa using the LoRaWAN protocol.
Software and presentation of raw data
The Congress backend system (Exploratory Engineering, Telenor Digital AS) provided rudimentary default visualizations. Data could also be exported via a REST API for further processing and any internet-connected client is able to request data via web sockets or the Congress REST API. The same server also provides device management functionality, such as provisioning devices with unique identifiers and encryption keys. The data was presented as raw sensor responses without any form of smoothing algorithm applied. Before deployment in the industrial environment, the sensors were stabilized in clean indoor air for a period of at least 24 hr to determine a zero baseline.
Single sample sensor tests and chamber tests
In a clean laboratory environment, tests were performed using a standardized, validated gas-logging instrument (x-am 5600 with DrägerSensor XXS CO, Dräger Safety AG & Co. KGaA, Germany) co-located with SPEC sensors. For a single sample test, the sensors were exposed to 100 ppm CO calibration gas (Calgaz Ltd., Staffordshire, UK) for approximately 5 min. In addition, the sensors were tested in a chamber using 20 2 ppm CO calibration gas (Calgaz Ltd., Staffordshire, UK). A 2 dm3 chamber was saturated with CO at a flow rate of 0.5 L/min, followed by passive exhaustion of the chamber through a venting hose. Data was recorded every minute for more than 9 hr, and calculations of mean and standard deviations were made for three parallel experiments. The NIOSH accuracy criterion (% mean errors between measurements) was tested.
Deployment of CO-IoT modules in the incineration plant
Three separate CO-IoT modules were deployed at three different sampling locations: CO-IoT 1 (close to the incinerator), CO-IoT 2 (close to the recycle fan), and CO-IoT 3 (close to the slag transporter belt) at the same time. Later, a Dräger x-am 5600 instrument and all three modules were placed close to the slag transporter belt for 11 hr to test the NIOSH accuracy criterion.
Statistics
Mean and standard deviations for CO readings were calculated for the modules placed separately and also when they were co-located with the Dräger instrument. Furthermore, statistical analyses were conducted on the measured values above or equal to 2 ppm (resolution for the Dräger sensor) calculating the mean error percentage from the discrepancy between the measurements made by each of the CO-IoT modules and the Dräger instrument, and the 95% confidence interval was calculated using the bias-corrected and accelerated bootstrap method. This method is used to correct for bias and skewness in the distribution of bootstrap estimates when data is not normally distributed (Efron Citation1987). The coefficient of determination (R2) was also calculated.
Results
IoT platform performance
Sampling was taken by the firmware every sixth minute, which was necessary to maximize battery life. Receiving and forwarding data through the LoRa gateway to the backend system and internet continued throughout the measuring period.
Single sample sensor test and chamber tests
The SPEC sensor internal accuracy is 15%, as stated by the manufacturer (SPEC sensors LLC Citation2017), while the DrägerSensor XXS CO accuracy is 2% (Dräger Citation2018). Exposure of the sensors to 100 ppm CO produced SPEC sensor measurements from 104–117 ppm with an average of 112 ppm during a sample period of approximately 5 min. The DrägerSensor XXS CO sensor data stabilized at 98 ppm after approximately 20 sec (data not shown). Results from the chamber test showed accurate responses within the NIOSH accuracy criteria when exposed to CO up to 20 ppm 2 ppm for more than 9 hr.
CO-IoT module performance
Daily variations and rapid signal responses over a period of approximately 2 months could be observed when the modules were deployed at three different locations. The responses could be linked to normal process activities in the incineration plant; however, these activities were not recorded or identified in detail. In addition, response magnitudes were different between the locations within the same timeframe. As presented in and from the raw data curves (), it appears that CO levels close to the incinerator and close to the slag transporter belt were generally higher compared to the levels close to the recycle fan; however, without utilizing smoothing algorithms, the raw data curves were difficult to read due to the signaling noise.
Figure 3 (a–c). Raw data from the field measurements. Raw data measurements of CO when CO-IoT modules were depolyed close to the incinerator (a), close to the recycling fan (b), or close to a slag transporter belt (c) for more than 50 days without loss of measuring data throughout the period. Day to day variations and rapid signal responses could be seen at the three different locations.
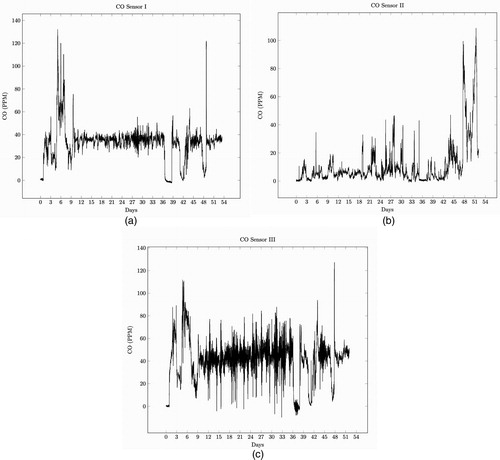
Table 1. Mean, standard deviation (SD), and minimum and maximum values from the CO measurements made by the CO-IoT modules when deployed in the incineration plant for more than 50 days, as showed in .
Accuracy of data according to NIOSH accuracy criteria
shows a general increasing tendency of CO concentrations over a measurement period of approximately 11 hr when the three CO-IoT modules were co-located with a Dräger instrument close to the slag transporter belt. As shown in , the average concentration of CO during the day, when measured by the Dräger instrument, was lower than the average concentrations measured by the CO-IoT modules. shows that the mean error percentage between measurements from the CO-IoT modules and the Dräger instrument was high, and none of the data from the CO-IoT modules were within the NIOSH accuracy criterion of 25%. However, the R2 showed that any Dräger instrument measurement variations could explain 69–70% of the measurement variations made by each of the CO-IoT modules. When sensors were exposed to 20
2 ppm CO calibration gas in a chamber test that lasted more than nine hr (), the accuracy was considerable higher and within the mean error of
25% of an estimated true value measured by the Dräger instrument.
Figure 4. Field measurements when SPEC sensors were co-located with the Dräger instrument. Measured CO concentrations made by the CO-IoT modules when co-located with a Dräger instrument over a period of approximately 11 hr and close to a transporter belt for toxic slag. Discrepancy between measurements were seen along with increasing CO levels suggesting a skewing of IoT sensor responses caused by interfering agents in the vicinity.
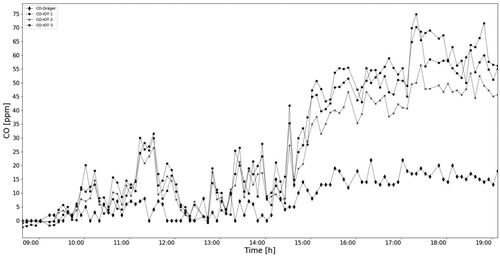
Figure 5. SPEC sensor laboratory test. SPEC sensor measurements shown as the percentage of the measured value from a Dräger instrument (dotted line). Sensors were exposed to 20 ppm “±” 2 ppm CO calibration gas and the mean and SD (shaded area) from 3 independent tests are shown. The mean error was within “±” 25% of the estimated true value and in compliance with NIOSH criterion for accuracy.
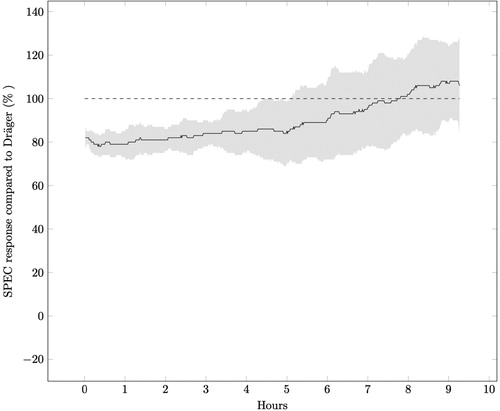
Table 2. Mean, standard deviation (SD), and minimum and maximum values from the CO measurements made by the CO-IoT modules and Dräger instrument when co-located close by the slag transporter belt for approximately 11 hr, as showed in .
Table 3. Accuracy and correlation between data points (n = 72) when CO-IoT 1, 2, and 3 were co-located with a Dräger x-am 5600 instrument close to the slag transporter belt. Mean errors (%) between the measurements made by the CO modules vs. Dräger instrument showed that there were no compliance with the NIOSH criterion for accuracy (95% CI estimated mean error of 25%), while the R2 (coefficient of determination) indicated 69–70% relative co-variations between the measurements.
Discussion
In a controlled laboratory environment when sensors were exposed to 20 or 100 ppm CO calibration gas, the SPEC sensor responded fairly accurately. However, when deployed in the incineration plant, the measurements were inaccurate when compared to those from a Dräger instrument, as shown in . It is conjectured that a mixed gas environment may have affected the SPEC sensors to a greater degree than the Dräger sensor when placed close to the slag transporter belts where toxic slag and ash are transported on open conveyors to a hazardous waste container. We suggest that some of these hazardous agents may have become airborne and interfered with the low-cost sensors. Sensors might not have adequately maintained accuracy due to the elevated interfering gas levels, in addition to CO emissions close to the slag transporter belt. In electrochemical sensor cells, a chemical reaction (oxidizing or reducing) occurs between gases and an exposed electrode. It is expected that some degree of cross sensitivity to interfering gases occur, even if a sensor is marketed as selective for a specific gas. Cross sensitivity can result in either a positive or a negative delta to the electronic response and may occur in a mixed gas environment. Given the harsh environment of the incinerator plant testing facility, it may be possible that the sensors responded to pollutive gases that were not listed by the manufacturer. Other studies have suggested that the presence of undefined cross sensitivity gases not stated by the manufacturers may have an effect on the performance of some commercially available low-cost sensors (Castell et al. Citation2017). The SPEC sensors, however, were not specifically investigated.
The Dräger sensor specification lists fewer cross-sensitive gases than the specifications for SPEC sensors, and there are differences in the measuring range (0–2,000 vs. 0–1,000 ppm, respectively), accuracy (2 vs. 15%, respectively), and resolution (2 vs. 0.1 ppm, respectively). A lower resolution (2 ppm for the Dräger sensor) could prevent minor influences on the measured values and keep the electronic signal stable, thereby avoiding signaling noise and fluctuations at low concentrations. Moreover, manufacturers typically guarantee a certain sensor precision within set temperature, pressure, and humidity ranges. The SPEC sensors were factory calibrated at 25 ± 3 °C and 40–60% relative humidity at sea level atmospheric pressure. Recalibrating the sensors at a typical usage temperature and humidity might improve the sensor precision; however, there were no temperature or humidity extremes in the testing facility where the sensors were deployed. For some electrochemical sensors, sudden changes in environmental factors may cause spikes in the responses (Alphasense Ltd Citation2013). We cannot rule out that this may also be true for the SPEC sensors, even if they are marketed as “virtually insensitive to long-term operation at relative humidity extremes.” Field calibration of sensors, when used in complex chemical environments, may be of importance in the future and machine-learning technologies may be useful tools in order to improve sensor performance. Although the performance of sensors in any given application or device is not guaranteed (SPEC Sensors LLC Citation2017), end-user calibration of sensors when deployed in an occupational environment may be a useful starting point.
Limitations
With respect to the CO sensor module configuration, the enclosure design may have affected the gas diffusion flow rate. Implementation of an internal fan could have provided a consistent gas flow across the sensor surface. In addition, the HEPA filters are not sufficient in order to filtering unknown gases; therefore, other filters need to be investigated. Furthermore, the instruments were deployed for a relatively short period while they were co-located, and considering the rapid CO level fluctuations, the comparison time to a standardized instrument may have been insufficient to assess sensor performance in the different environmental conditions. No filter algorithms were implemented to compensate for signal spikes or noise (e.g., as an exponential moving average filter); therefore, data were presented as raw sensor outputs as would be the default method. However, other studies have shown that raw measurements may be unsuitable and that corrections for cofactors using a test dataset may improve accuracy (Isiugo et al. Citation2018). Moreover, the notion that the guidelines or standards concerning accuracy testing and calibration of field-deployed low-cost sensors should be improved is supported (Spinelle et al. Citation2013, Citation2017).
Conclusions
In this study, functional IoT modules were built and low-cost CO sensors were used to detect variable gas levels when deployed in an incineration plant. It can be concluded that continuous real-time monitoring over an extended period may be useful to detect short-term and rapid changes of potentially hazardous levels of CO in the working environment. However, in order to evaluate the occupational exposure to CO, the sensor accuracy and resistance toward interfering gases must be further investigated.
Recommendations
Field-testing and accuracy tests of low-cost sensors should be performed when implemented in low-cost IoT platforms for the purpose of monitoring the occupational exposure.
Acknowledgments
This project was partially funded by the Research Council of Norway. We would like to thank Joar Nicolaysen at Vestteknikk AS for assisting with the single-sample CO test.
References
- Alphasense Ltd. 2013. Alphasense Application Note (AAN) 110. Environmental changes: temperature, pressure, humidity. [accessed 2020 Mar 8]. http://www.alphasense.com/WEB1213/wp-content/uploads/2013/07/AAN_110.pdf.
- Ayer A, Zarjou A, Agarwal A, Stocker R. 2016. Heme oxygenases in cardiovascular health and disease. Physiol Rev. 96(4):1449–1508. doi:10.1152/physrev.00003.2016
- Castell N, Viana M, Minguillón MC, Guerreiro C, Querol X. 2013. Real-world application of new sensor technologies for air quality monitoring. European Topic Centre on Air Pollution and Climate Change Mitigation (ETC/ACM). Technical paper 2013/16.
- Castell N, Dauge FR, Schneider P, Vogt M, Lerner U, Fishbain B, Broday D, Bartonova A. 2017. Can commercial low-cost sensor platforms contribute to air quality monitoring and exposure estimates? Environ Int. 99:293–302. doi:10.1016/j.envint.2016.12.007
- Dräger. 2018. DrägerSensor & portable instruments handbook, 4th ed. [accessed 2020 March 8]. https://www.draeger.com/products/content/sensors-ca-9046571-en-pod.pdf.
- Efron B. 1987. Better bootstrap confidence intervals. J Am Stat Assoc. 82(397):171–185. doi:10.1080/01621459.1987.10478410
- Esmaeilian B, Wang B, Lewis K, Duarte F, Ratti C, Behdad S. 2018. The future of waste management in smart and sustainable cities: a review and concept paper. Waste Manag. 81:177–195. doi:10.1016/j.wasman.2018.09.047
- Giusti L. 2009. A review of waste management practices and their impact on human health. Waste Manag. 29(8):2227–2239. doi:10.1016/j.wasman.2009.03.028
- Grandjean P, Landrigan PJ. 2006. Developmental neurotoxicity of industrial chemicals. Lancet. 368(9553):2167–2178. doi:10.1016/S0140-6736(06)69665-7
- Isiugo K, Newman N, Jandarov R, Grinshpun SA, Reponen T. 2018. Assessing the accuracy of commercially available gas sensors for the measurement of ambient ozone and nitrogen dioxide. J Occup Environ Hyg. 15(11):782–791. doi:10.1080/15459624.2018.1513135
- LoRa Alliance Inc. 2017. LoRaWAN 1.1 specification. [accessed 2020, March 8]. https://lora-alliance.org/sites/default/files/2018-04/lorawantm_specification_-v1.1.pdf.
- Maître A, Collot-Fertey D, Anzivino L, Marques M, Hours M, Stoklov M. 2003. Municipal waste incinerators: air and biological monitoring of workers for exposure to particles, metals, and organic compounds. Occup Environ Med. 60(8):563–569. doi:10.1136/oem.60.8.563
- National Institute for Occupational Safety and Health (NIOSH). 2012. Components for evaluation of direct reading monitors for gases and vapors. Technical Report. Pub. No. 2012-162. [accessed 2020 March 8]. https://www.cdc.gov/niosh/docs/2012-162/pdfs/2012-162.pdf.
- Norwegian Working Environment Act. 2018. Regulations concerning action and limit values. [accessed 2020 May 2]. https://lovdata.no/dokument/NLE/lov/2005-06-17-62.
- Poulsen OM, Breum NO, Ebbehøj N, Hansen AM, Ivens UI, van Lelieveld D, Malmros P, Matthiasen L, Nielsen BH, Nielsen EM. 1995. Sorting and recycling of domestic waste. Review of occupational health problems and their possible causes. Sci Total Environ. 168(1):33–56. doi:10.1016/0048-9697(95)04521-2
- SPEC Sensors LLC. 2017. DGS-CO 968-034: digital gas sensor-carbon monoxide. [accessed 2020 March 8]. https://www.spec-sensors.com/wp-content/uploads/2017/01/DGS-CO-968-034.pdf.
- Spinelle L, Aleixandre M, Gerboles M. 2013. Protocol of evaluation and calibration of low-cost gas sensors for the monitoring of air pollution. Luxembourg: Publication Office of the European Union.
- Spinelle L, Gerboles M, Villani MG, Aleixandre M, Bonavitacola F. 2017. Field calibration of a cluster of low-cost commercially available sensors for air quality monitoring. Part B: NO, CO and CO2. Sens Actuators B. 238:706–715. doi:10.1016/j.snb.2016.07.036
- Veronesi A, Pecoraro V, Zauli S, Ottone M, Leonardi G, Lauriola P, Trenti T. 2017. Use of carboxyhemoglobin as a biomarker of environmental CO exposure: critical evaluation of the literature. Environ Sci Pollut Res Int. 24(33):25798–25809. doi:10.1007/s11356-017-0270-1