
 ?Mathematical formulae have been encoded as MathML and are displayed in this HTML version using MathJax in order to improve their display. Uncheck the box to turn MathJax off. This feature requires Javascript. Click on a formula to zoom.
Abstract
Bioaerosols are known to be an important transmission pathway for SARS-CoV-2. We report a framework for estimating the risk of transmitting SARS-CoV-2 via aerosols in laboratory and office settings, based on an exponential dose-response model and analysis of air flow and purification in typical heating, ventilation, and air conditioning (HVAC) systems. High-circulation HVAC systems with high-efficiency particulate air (HEPA) filtration dramatically reduce exposure to the virus in indoor settings, and surgical masks or N95 respirators further reduce exposure. As an example of our risk assessment model, we consider the precautions needed for a typical experimental physical science group to maintain a low risk of transmission over six months of operation. We recommend that, for environments where fewer than five individuals significantly overlap, work spaces should remain vacant for between one (high-circulation HVAC with HEPA filtration) to six (low-circulation HVAC with no filtration) air exchange times before a new worker enters in order to maintain no more than 1% chance of infection over six months of operation in the workplace. Our model is readily applied to similar settings that are not explicitly given here. We also provide a framework for evaluating infection mitigation through ventilation in multiple occupancy spaces.
Introduction
Knowledge of the transmission pathways for SARS-CoV-2, the virus that causes COVID-19, is incomplete. It is currently believed that transmission can occur via both surface contact (fomites) and aerosols/droplets (Anderson et al. Citation2020; Singh and Kaur Citation2020; Wang and Du Citation2020). While, to date, there has been no documented case of fomite transmission of SARS-CoV-2 (Dietz et al. Citation2020), there are a variety of reports of aerosol transmission in social settings (Hamner et al. Citation2020; Lu et al. Citation2020). Aerosol transmission is an important pathway especially because both symptomatic and presymptomatic carriers can shed the virus (Gandhi et al. Citation2020) and aerosols can contain active virus for many hours in suspension (van Doremalen et al. Citation2020). Very recently, a large and diverse group of scientists has emphasized the importance of the airborne transmission pathway for SARS-CoV-2, urging public health organizations to include a more thorough understanding of airborne-related risks in their decision making and guidance (Morawska and Milton Citation2020). Complicating the understanding of viral spread are the effects of local air flow conditions (Hamner et al. Citation2020; Mittal et al. Citation2020). Understanding of viral transmission dynamics will play a pivotal role in the development of procedures to minimize disease transmission in work settings.
Here, we consider SARS-CoV-2 transmission via aerosolized particles. We focus in particular on the environments common in photonics, physical chemistry, atomic physics, and condensed matter physics experimental laboratories (“labs”) and the offices that are often connected with those labs (“offices”). Combining the knowledge of aerosol transmission and mask effectiveness, the typical properties of labs and offices, and a simple dose-response model, we develop guidelines for laboratory work procedures and a framework for evaluating infection mitigation through ventilation. The guidelines developed will also attenuate the large droplet transmission route, although that is not discussed in detail here. Because the air-handling and ventilation of labs and offices can differ substantially, we discuss examples for these two work environments. We present the details of our analysis in the hope that it can be applied by the reader to a variety of other laboratory and office settings.
Aerosol transmission and physical spaces
Here, we review literature indicating that aerosol transmission of SARS-CoV-2 is likely a significant contributor to the spread of infection. Furthermore, the lifetime of aerosols containing viable virus is long. Because the filtering and exchange of contaminated air with fresh air will lower the density of viral particles and can thus lower the probability of infection, we also discuss the typical air conditions in laboratory and office settings.
Aerosol transmission of SARS-CoV-2
Transmission of SARS-CoV-2 can occur even prior to onset of COVID-19 symptoms (Gandhi et al. Citation2020). In considering airborne spread of SARS-CoV-2, one can allow for two distinct modes of transmission: “droplet sprays” following a sneeze or cough and “microscopic aerosol particles” from evaporated respiratory droplets (Asadi et al. Citation2020). A general, though not universal, convention is to call particles >5 µm droplets and particles <5 µm aerosols. When an infected person coughs, breathes vigorously, or speaks loudly they may shed virus in the form of bioaerosols ranging from 0.3–100 µm in diameter (Wang and Du Citation2020). Ordinary speech can also be a significant source of aerosolized particles (Asadi et al. Citation2020). Larger droplets are also suspected of providing a transmission route for SARS-CoV-2. However, large droplets >5 µm typically have shorter suspension times in air, 10 min (Singh and Kaur Citation2020). Aerosols in the size range 1 − 5 µm are of particular concern, both because they are respirable and remain in the air for long times (Meselson Citation2020; Singh and Kaur Citation2020; Wang and Du Citation2020). Studies have shown that SARS-CoV-2 can remain viable on aerosols for >3 hr, requiring
13 hr for a 4-log10 reduction (US Food and Drug Administration Citation2020; van Doremalen et al. Citation2020); see Supplemental Material (SM) Secs. C.2 and C.3. Thus, the virus remains both active and suspended long enough to be carried by either diffusive or convective flow to other nearby (potentially uninfected) individuals.
While the question of whether aerosolized particles can lead to transmission of SARS-CoV-2 is under active investigation, there is significant circumstantial evidence that it is possible (Brosseau Citation2020; Woelfel et al. Citation2020). A study of patients infected with COVID-19 in Germany found that active shedding of virus from the upper respiratory tract occurred as symptoms developed, a potential source of respirated aerosols (Woelfel et al. Citation2020). Several case studies have suggested efficient SARS-CoV-2 transmission due to aerosols. A study in Wuhan, China, found significant aerosol spread of SARS-CoV-2 in a restaurant with 0.8 air changes per hour (Li et al. Citation2020; Lu et al. Citation2020). At the same time, the aerosol spread was found to be highly localized to the particular zone covered by a single air-handling unit (AHU), without identified spread to portions of the room under the control of other AHUs or to waiters moving in and out of the region of contaminated air (Li et al. Citation2020). This observation has important implications for shared work in the same laboratory room, e.g., if sufficient air flow and separation between areas can be maintained when two workers occupy the same room (see “Results and Discussion”). In a hospital setting, the distribution of virus-laden aerosols was found to be somewhat (albeit weakly) determined by airflow patterns in the AHUs (Guo et al. Citation2020). By contrast, very little SARS-CoV-2 RNA was found in negative-pressure, high-air-exchange rate wings of a hospital (Liu et al. Citation2020). These studies highlight the importance of convective air currents influencing the distribution of contaminated aerosols. As will be discussed below, the dominating air patterns differ between laboratory and office settings and must be taken into account in developing mitigation protocols.
Methods
General approach
Our analytical approach is to (1) use the literature and make conservative assumptions about the infectivity of the SARS-CoV-2 virus, (2) calculate the probability of a healthy person being infected via aerosols by a virus-shedding person under various physical conditions, e.g., one person per room, lab shared by two people, etc., (3) set a threshold for acceptable probability, of being infected over the course of 6 months, and (4) devise mitigation approaches to attain that
We choose
% over 6 months of work as a target because this level of risk represents a small relative risk of injury or death compared to (i) other daily risks excluding contracting COVID-19, (ii) work-related risks only, excluding contracting COVID-19, and (iii) the risk of contracting COVID-19 outside of work. (See more detailed explanation in “Choice of Risk Level,” below).
The analysis presented here is based on several assumptions that are chosen to be conservative. We assume relatively high SARS-CoV-2 infectivity, setting the relevant infectivity parameters to those of influenza. For concreteness, we consider the infection of a single uninfected (“healthy”) person H in an environment of asymptomatic (“sick”) carriers S that actively shed virus for 1 full week and assume that a person works 40 hr per week. Because a typical experimental subgroup contains ∼4 individuals, we assume in concrete examples that the healthy person significantly connects (e.g., shares in some way an office or lab) with three other people who are each shedding virus at different times. This gives a total exposure to the virus that lasts up to 3 weeks in a 6-month period of work. The accumulated dose will scale up or down according to the number of individuals S that H connects with; this adjustment can easily be applied to our model.
We also describe stricter protocols that would be required under the less realistic, but more conservative, assumption that H is exposed continuously to virus-shedding persons S for the entire 6-month period (26 weeks). We do not consider the situation where mixing of air between rooms takes place through the HVAC system, which may be an important consideration for insufficiently isolated rooms.
Model
Previous work on airborne transmission of illnesses has relied on a variety of useful models (Wells Citation1955; Riley et al. Citation1978; Noakes and Sleigh Citation2009; Sze To GN, Chao CYH. Citation2010). We use a dose-response model (Watanabe et al. Citation2010, Citation2012), described in SM Sec. A.1, to assess the risk involved with various modes of laboratory work. This model states that for a viral dose, the infection probability is
(1)
(1)
where
sets the probability that a unit dose exposure will lead to infection. The dose
is the number of viral particles inhaled by a person. We take, conservatively,
particles (see SM Sec. A.1), which is equivalent to assuming that each inhaled viral copy incurs a 1% probability of leading to an infection. With this conservative assumption our target of <1% probability of infection indicates that on average each researcher inhales less than one viral copy in 6 months of work.
Consider one healthy person, H, in a room with virus-shedding persons, S. By breathing, each S emits a certain number of SARS-CoV-2 viral particles into the air. Under normal breathing conditions, S is expected to exhale
35 − 70 viral particles/minute (Leung et al. Citation2020; Yan et al. 2018). Note that this estimate does not account for “super-emitters,” individuals who shed virus at an unusually large rate (To et al. Citation2020; Jones et al. Citation2020; Evans Citation2020). The effect of super-emitters, not incorporated into our model, is minimized when any person comes into contact with only a small number (e.g., three) of other individuals.
The exhaled viral particles will create (after mixing with a volume of air, filtering, etc.) some local density [viral particles/liter of air] that H inhales. The steady-state density of virus in a room depends on the HVAC conditions. Suppose there is a fresh air exchange rate,
[1/hr], as well as a filtered air exchange rate
[1/hr] with filtration efficiency
For a room with volume
the steady-state viral particle density is
The effective fresh air exchange rate is
The viral dose that H receives is
where
is the total volume of air inhaled by H and
is the viral particle density (which may be lower than the steady-state value). At a typical breathing rate, H will inhale a volume of air per unit time
L/hr. For example,
L during
hr of work and under these conditions
and
(viral particles). The infection probability can be expressed as
(2)
(2)
Here, is inhaled air volume per unit time, T is the total time of inhalation,
is the viral density, and k is the viral infection parameter. B is the total inhaled volume, normalized by the viral infectivity. For small probability, this simplifies to
where
and
For easy reference, we supply probability formulas in SM Sec. D.
Determining at the location of H depends heavily on the spatial situation (locations and movement of S and H) and the air conditions (mixing and replacement with outside fresh air and filtration). We will assume two baseline situations: “spaces requiring individual occupation” (S in the room alone, S leaves, H occupies) and “spaces allowing shared occupation” (S and H are in the same room at the same time). See for a summary of parameters used in the numerical examples presented here.
Table 2. Typical values assumed for office vs. laboratory spaces.
Physical spaces: Laboratories and offices
For the purposes of providing concrete examples, we consider a lab room as having an area of 500 ft2 (50 m2) with volume
liters. A typical lab room () is outfitted with air-handling units (AHUs) providing flow rates of
300−2,000 cubic feet per minute (cfm), depending on the room and generally scaling with the room volume. In order to meet strict temperature accuracy requirements for many physical science laboratories, the air flow rates from lab AHUs result in entire room fresh (outside) air changes every 5−10 min and total air changes every 3−5 min. This air change rate significantly exceeds the ASHRAE requirements of approximately one air change per hour in university laboratory settings (see, e.g., ANSI/ASHRAE Standard 62.1-2007). A typical quantum physics laboratory, which is the focus of our examples, is held at positive pressure and equipped with high-efficiency particulate air (HEPA) filtration due to sensitive optics and experimental apparatus.
Figure 1. Example room configurations for (a) laboratory and (b) office settings. In the laboratory shown, two work spaces are identified with negligible mixing of air between them. Each work space has a separate AHU with fresh air output and HEPA-filtered recirculation. In the office, the presence of one worker precludes workers in other areas, and recirculated air is not filtered. Both rooms are held at positive pressure.
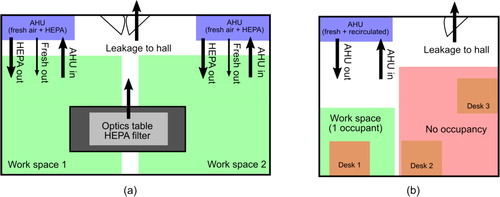
To contrast this high-circulation HVAC situation, we also consider a typical office room (which would usually be shared prior to the pandemic) of 200 ft2 (20 m2) and
liters with a fresh air flow rate from the AHU of
20−50 cfm, with an entire room fresh air change every
30−60 min and held at positive pressure (). This is in good agreement with the ASHRAE minimum requirement of 12 cfm for an office space of this size (see, e.g., ANSI/ASHRAE Standard 62.1-2007).
AHUs can be equipped with particle filters, e.g., minimum efficiency reporting value (MERV) or HEPA, with filtration efficiency dependent on particle size. HEPA filtration efficiency, is measured to be 99.994% at 50 nm, 99.98% at 0.1–0.2 µm, and >99.996% for particles >0.5 µm (Chuaybamroong et al. Citation2010; Zhang et al. Citation2014; Day et al. Citation2018; Morono et al. Citation2018). Because virus-laden particles are often expelled from the body in combination with proteins, salts, and water as droplets and aerosols (Dietz et al. Citation2020), it is not yet clear whether aerosol transmission of SARS-CoV-2 is caused by suspended individual viral particles, of size
50−150 nm (Cascella et al. Citation2020; Kim et al. Citation2020), or larger respirable aerosols of size
1−5 µm (Singh and Kaur Citation2020; Wang and Du Citation2020). Thus, to make conservative estimates below, we assume a nominal penetration value through HEPA filtration of
which matches the specified maximum value (Dietz et al. Citation2020). We note that to achieve this filtration that the heating, ventilation, and air conditioning (HVAC) unit needs to be in good working order. Specifically, the seals around the HEPA filters themselves need to be adequate, which requires testing for verification. In many other laboratory environments, MERV filters are used with
(MERV8) to
(MERV16) in the particle size range 1–3 µm, leading to much higher penetration values (Fazli et al. Citation2019; ASHRAE Citation2017). Our treatment of HEPA-filtered recirculation can be directly applied to MERV-filtered recirculation by substituting the value of
appropriate to the relevant MERV standard. Multiple international standards for operation requiring HEPA filtration specify that filtration and leakage testing must be performed at regular intervals, typically every 6–12 months, in order to rely on the specified filtration efficiencies (Food and Drug Administration [FDA] Citation2004; National Environmental Balancing Bureau [NEBB] Citation2009; World Health Organization [WHO] Citation2011). MERV filters should be tested or replaced on similar time scales per manufacturer specifications. While MERV filtration may be present in office environments, we conservatively consider the case of no air filtration in our examples.
Results and discussion
Probability of aerosol transmission
Spaces requiring individual occupation
Consider first a room with parameters matching those of a typical office. If such a space were occupied by two individuals, S and H, the risk of disease transmission would be unacceptably high, which can be shown as follows. The concentration of viral particles in the air accumulates over a time scale set by the air exchange rate in the room. Assuming rapid mixing of the aerosol (either by convective mixing or diffusion) in typical room with volume liters, the maximum density of SARS-CoV-2 is
viral particles/liter accumulating over an air exchange time of 30 min, giving H a 99% likelihood of infection for 1 week of exposure. Even with use of N95 masks in this scenario (see discussion of mask dilution factors below),
% in 1 week. This indicates that sharing offices is not possible while maintaining
%, even for a 1-week time scale. However, if S and H do not share the room simultaneously, then the dose to H is reduced by HVAC air exchange. Typically, a room will be traded between H and S one or two times per day. We assume conservatively that H enters a room previously vacated by S no more than four times per day. The time-dependent dilution of the dose is given in SM Sec. A.4 and may be used to find the total dose. If H waits nine air change times before entering, then for 26 weeks of total exposure in a 6-month period of work, the probability of infection is
%, requiring, in this example, a 4.5-hr wait-time while the room is aired out. Use of masks, either surgical or N95, will shorten the required waiting time.
We separately consider the risk to H associated with occupying a lab that has been previously occupied by S. In this case, typically liters and the air exchange time is approximately 5 min. Because the labs are assumed in our scenario to be HEPA filtered and have high rates of air circulation, the contamination present after S leaves rapidly diminishes (see SM Secs. A.3 and A.4). With 3 weeks of total exposure in a 6-month period of work, the probability of infection is
% even if H enters immediately after S leaves the room. However, we recommend that H wait for one air exchange time before entering since the local density of virus in some positions (e.g., far from the HVAC inlet) may significantly exceed the average density in the room on time scales shorter than one air exchange time. Waiting one air exchange time is also sufficient to ensure
% even with 26 weeks of total exposure.
Spaces allowing shared occupation
Now consider the case where S and H are in the same room, but (1) the air is HEPA filtered on a shorter time scale than the air change time discussed above and (2) S and H are placed far enough apart that they sit in different airstreams formed by the flow of air from the HVAC output to intake openings (SM Secs. A.3 and A.4). In this case, H is always breathing air that has been HEPA filtered. Empirical confirmation of this situation is essential; see SM Sec. F for a description of an easily implemented testing procedure using aerosolized salt particles. For a room with liters, and with an air change time for the room of 5 min, the air stream input into the HVAC system from S has an approximate viral particle density of
viral particles/liter. A small fraction of this viral particle density will survive HEPA filtering and then be introduced into the airstream occupied by H by the HVAC circulation. Due to filtering and mask wearing, there are dilution factors D that lower the number of viral particles that H is exposed to (SM Secs. A.2 and A.3). For HEPA-filtered air from the HVAC unit,
where
is the filter penetration. If both S and H wear surgical (N95) masks,
(
) (Liang et al. Citation2020). Then, for small probabilities
of H contracting COVID-19,
(SM Sec. D) in a 6-month period of work,
is evaluated to be
HEPA, no mask:
OK:
HEPA, N95:
No HEPA, N95:
We note that if H were to reside in the same airstream as S (e.g., be in the airstream from S to the input of the HVAC unit) then % for 1 week of exposure to this viral load. These conclusions remain unchanged when considering 26 weeks of exposure. We also note that the above “no masks” case is for illustrative purposes only. All workers should wear masks to mitigate droplet transmission and fomite creation, as well as to attenuate the effects of sneezes and coughs. We summarize some important parameters assumed in this model in .
Table 1. Values of model parameters assumed for example risk calculations.
Finally, we consider in detail the case that a healthy person H and virus-shedding persons S occupy the same airstream in SM Sec. E. With our preferred model parameters and reasonable room sizes, the risk of infection in this situation always exceeds our chosen risk threshold of 1%. However, under much less conservative model parameters and a significantly higher risk threshold, it may be deemed acceptable for multiple people to occupy the same workspace given a large enough area per person in the room. We refer interested readers to this model (see SM Sec. E) so they can assess the risks of working with multiple persons in a single airstream, if they are willing to adopt less conservative guidelines than we recommend.
Choice of risk level
If the risk of contracting COVID-19 in the lab over six months is %, how does this compare to risks from other sources? Although richer comparisons exist, as a baseline one can note that the risk of death due to COVID-19 contracted in the laboratory, under the
% condition, is far smaller than the typical all-cause mortality rate for the typical age of graduate students and post-doctoral researchers (Murphy et al. Citation2015). This level of risk leads to a marginal fractional increase in expected mortality in 6 months of <2% (see below for detailed estimate). Individuals outside of this age range or with preexisting medical conditions may be at elevated risk and their situation should be analyzed accordingly. The chosen level of risk (for a COVID-19 contraction risk over 6 months of
%) can be compared to a variety of other standards; see SM Sec. B for more details. The risks we compare to are an appropriate benchmark because they represent the context in which laboratory researchers worked prior to the COVID-19 pandemic (US Chemical Safety and Hazard Investigation Board Citation2018; Widener Citation2019).
Daily risks excluding COVID-19. Mortality risks may be compared with the all-cause mortality rate of an individual in the typical researcher age demographic, 25–34, excluding COVID-19 and lab-related work. This is approximately 0.05% likelihood of death per 6-month period (Murphy et al. Citation2015). Estimates of the COVID-19 infection fatality rate (from the Italian outbreak) are
Lab-related risks excluding COVID-19. Reports of injuries in academic laboratories over the 10-year period of July 2008–July 2018 give an approximate 0.04% likelihood per person per year of an OSHA-reportable injury (US Chemical Safety and Hazard Investigation Board Citation2018; Widener Citation2019).
Exposure to COVID-19 outside of lab. The lack of widespread testing means the prevalence of COVID-19 is likely severely underestimated. Several serological studies have been conducted to attempt to estimate the extent of exposure, with varying results. These have found that between 3% and 30% of the tested populations have been exposed to SARS-CoV-2 (Grzelak et al. Citation2020). While there are valid concerns about the reliability of the tests and whether the tested populations were representative, there is widespread agreement that the prevalence of COVID-19 is significantly higher than current official counts (Naranbhai et al. Citation2020; Streeck et al. Citation2020; van den Hurk et al. Citation2020). One scenario of an essential activity where one can expect a high exposure to SARS-CoV-2 is a trip to the supermarket. Under the same model as we use to assess risk in labs, we estimate that if an individual makes one trip per week and spends 1 hr each time, then their cumulative probability of infection after 6 months (26 grocery trips) is approximately 6% (SM Sec. B.4). We emphasize that this estimate is intended only as a point of comparison using the same model as we apply to workplace environments. An individual’s level of risk outside the workplace will vary dramatically based on many factors not considered here.
From a public health perspective, the risk level of % corresponds to a negligible marginal increase in the basic reproduction number,
Adjusting the risk threshold,
to values within a factor of 10 around 1% would leave the structure of our guidelines unchanged.
Conclusions
We have studied the conditions in which groups of fewer than five individuals can maintain a low risk of airborne SARS-CoV-2 transmission over 6 months of operation, assuming an exponential dose-response model for an environment typical of academic research laboratories and offices. We find that for environments with HVAC systems typical of laboratories and offices, it is safe to operate when a room (or section of a room with an isolated airstream) is left vacant for one (high-circulation HVAC with HEPA filtration) to six (low-circulation with no filtration) air exchange times before a new worker enters. While quantitative examples are given throughout the text, our model may be readily used to determine safe working conditions in other, similar environments.
Recommendations
The analyses above make clear the importance of air filtration, and, secondarily, mask usage. We note, as before, all workers should wear masks to mitigate droplet transmission and fomite creation, as well as to attenuate the effects of sneezes and coughs. The following guidelines correspond to laboratory or office work procedures which, based on the analysis presented here, will lead to a risk of contracting COVID-19 of % over 6 months, under the reasonable assumption of 3 total weeks of exposure to an infected person (and also for the conservative assumptions of 26 weeks of exposure). These guidelines are appropriate for room conditions typified by the examples described in the “Physical Spaces” section, but our approach can be adapted to other situations as needed.
Offices: Whenever possible, office work should be conducted from home instead of the office. Office rooms shall be single occupancy. Each office space should be evaluated for air flow and size to determine a minimum acceptable time to remain empty before a new researcher may enter. For a typical office room with
Laboratories: For lab rooms without HEPA or high-efficiency MERV filtration, the “Offices” guidelines shall be used. For lab rooms with efficient filtration, multiple occupancy is allowed under the conditions of large distancing and positioning workers in separate airstreams. Distancing requirements, typically at least a few meters, must be determined experimentally to situate workers in individually occupied regions between which mixing of air is negligible. In SM Sec. F, we describe one method of validating the separation of airstreams using an aerosolized salt particle generator (TSI 8026, TSI Inc., Shoreview, MN) and measurements of the particle density throughout the room with an aerosol particle counter (TSI 9303-1, TSI Inc.). A wait time is required between different users accessing a given area of a room. For a typical HEPA filtered lab this would be one air change (for either 3 or 26 weeks of exposure in a 6-month period). For shared lab resources (e.g., electronics rooms, storage cabinets, chemical rooms, etc.) without HEPA filtration, a wait time of at least four air changes will be required (SM Sec. A.5), for long exposure times.
Multiple simultaneous occupancy: Our conservative analysis prohibits multiple occupancy of airstreams that have not been experimentally validated as well separated. With the understanding that some workers may accept less conservative assumptions or higher risk tolerance, or may be unable to conduct work without multiple people occupying the same airstream, we describe in SM Sec. E how to assess personnel limits in a well-mixed room for a given fresh air or filtered air flow rate. Under the least conservative assumptions that we choose, up to one person can be added to a room per approximately 100 cfm of fresh or highly filtered air. SM Sec. E provides a framework for determination of personnel limits and indicate between approximately 100–1,000 cfm of fresh or highly filtered air per occupant, depending on the assumptions about infectivity and risk threshold.
We base these guidelines on the idea that even if all researchers contract COVID-19 over the 6-month period, any given infected person will shed virus at peak levels for only about 1 work week. Furthermore, a healthy person, H, will generally connect with at most three other people (for a typical subgroup size of four people, and assuming negligible mixing between subgroups; for a discussion of auxiliary prep spaces shared between subgroups, including bathrooms, see SM Sec. A.5). In the worst case allowed by these assumptions, H would be exposed to 3 weeks of infection risk in the workplace. An even more conservative analysis would assume that all persons (other than the one healthy person H) are constantly shedding virus at peak levels all the time. This would mean 26 weeks of exposure for a healthy person. Under the “26-week exposure” condition, the wait time indicated for offices (or rooms without HEPA filtration) would be increased to 5 hr if % is to be maintained. For the laboratory case, under the “26-week exposure” condition, the rapid dilution of virus in the air by the HEPA HVAC system is sufficient to ensure
% if H enters at a time 1−2 air change times after S leaves the room (10−15 min). Another conservative assumption that underlies these guidelines is a risk threshold of
%, which if changed to
% would indicate a wait time of <1 hr is required between occupancy of an office room.
uoeh_a_1805117_sm0377.pdf
Download PDF (262.6 KB)Acknowledgments
We gratefully acknowledge Loic Anderegg, Louis Baum, Richard L. Garwin, Christian Hallas, Nathaniel Vilas, and Xing Wu for providing feedback on this manuscript. BLA acknowledges support from the NSF GRFP and HS from the Ezoe Memorial Recruit Foundation.
Additional information
Funding
References
- American Society of Heating, Refrigerating, and Air-Conditioning Engineers (ASHRAE). 2017. ANSI/ASHRAE Standard 52.2-2017: method of testing general ventilation air-cleaning devices for removal efficiency by particle size. Atlanta, GA: ASHRAE.
- Anderson EL, Turnham P, Griffin JR, Clarke CC. 2020. Consideration of the aerosol transmission for COVID-19 and public health. Risk Anal. 40(5):902–907. doi:10.1111/risa.13500
- Asadi S, Bouvier N, Wexler AS, Ristenpart WD. 2020. The coronavirus pandemic and aerosols: does COVID-19 transmit via expiratory particles? Aerosol Sci Technol. 54(6):635–638. doi:10.1080/02786826.2020.1749229
- Brosseau L. 2020. Commentary: COVID-19 transmission messages should hinge on science. Univ Minesota CIDRAP. 19:1.
- Cascella M, Rajnik M, Cuomo A, Dulebohn SC, Di Napoli R. 2020. Features, evaluation, and treatment coronavirus (COVID-19). Treasure Island, FL: StatPearls Publishing.
- Chuaybamroong P, Chotigawin R, Supothina S, Sribenjalux P, Larpkiattaworn S, Wu CY. 2010. Efficacy of photocatalytic HEPA filter on microorganism removal. Indoor Air. 20(3):246–254. doi:10.1111/j.1600-0668.2010.00651.x
- Day DB, Xiang J, Mo J, Clyde MA, Weschler CJ, Li F, Gong J, Chung M, Zhang Y, Zhang J. 2018. Combined use of an electrostatic precipitator and a high-efficiency particulate air filter in building ventilation systems: effects on cardiorespiratory health indicators in healthy adults. Indoor Air. 28(3):360–372. doi:10.1111/ina.12447
- Dietz L, Horve PF, Coil DA, Fretz M, Eisen JA, Wymelenberg KVD. 2020. 2019 novel coronavirus (COVID-19) pandemic: built environment considerations to reduce transmission. mSystems. 5(2):e00245. doi:10.1128/mSystems.00245-20
- Evans M. 2020. Avoiding COVID-19: aerosol guidelines. medRxiv. https://www.medrxiv.org/content/10.1101/2020.05.21.20108894v1.full.pdf.
- Fazli T, Zeng Y, Stephens B. 2019. Fine and ultrafine particle removal efficiency of new residential HVAC filters. Indoor Air. 29:4. doi:10.1111/ina.12566
- Food and Drug Administration (FDA). 2004. Sterile drug products produced by aseptic processing – current good manufacturing practice. Docket No. FDA-2003-D-0145. https://www.fda.gov/media/71026/download.
- Gandhi M, Yokoe DS, Havlir DV. 2020. Asymptomatic transmission, the Achilles’ heel of current strategies to control Covid-19. N Engl J Med. 382(22):2158–2160. doi:10.1056/NEJMe2009758
- Grzelak L, Temmam S, Planchais C, Demeret C, Huon C, Guivel F, Staropoli I, Chazal M, Dufloo J, Planas D, et al. 2020. SARS-CoV-2 serological analysis of COVID-19 hospitalized patients, pauci-symptomatic individuals and blood donors. medRxiv. https://www.medrxiv.org/content/10.1101/2020.04.21.20068858v1.full.pdf.
- Guo Z-D, Wang Z-Y, Zhang S-F, Li X, Li L, Li C, Cui Y, Fu R-B, Dong Y-Z, Chi X-Y, et al. 2020. Aerosol and surface distribution of severe acute respiratory syndrome coronavirus 2 in hospital wards, Wuhan, China, 2020. Emerging Infect Dis. 26(7):1583–1591. doi:10.3201/eid2607.200885
- Hamner L, Dubbel P, Capron I, Ross A, Jordan A, Lee J, Lynn J, Ball A, Narwal S, Russell S, et al. 2020. Morbidity and mortality weekly report high SARS-CoV-2 attack rate following exposure at a choir practice—Skagit County, Washington, March 2020. Morbid Mortal Week Rep. 69:19.
- Jones TC, Mühlemann B, Veith T, Biele G, Zuchowski M, Hoffmann J, Stein A, Edelmann A, Corman VM, Drosten C. 2020. An analysis of SARS-CoV-2 viral load by patient age. medRxiv. https://www.medrxiv.org/content/10.1101/2020.06.08.20125484v1.full.pdf.
- Kim JM, Chung YS, Jo HJ, Lee NJ, Kim MS, Woo SH, Park S, Kim JW, Kim HM, Han MG. 2020. Identification of coronavirus isolated from a patient in Korea with covid-19. Osong Public Health Res Perspect. 11(1):3–7. doi:10.24171/j.phrp.2020.11.1.02
- Leung NHL, Chu DKW, Shiu EYC, Chan K-H, McDevitt JJ, Hau BJP, Yen H-L, Li Y, Ip DKM, Peiris JSM, et al. 2020. Respiratory virus shedding in exhaled breath and efficacy of face masks. Nat Med. 26(5):676–680. doi:10.1038/s41591-020-0843-2
- Li Y, Qian H, Hang J, Chen X, Hong L, Liang P, Li J, Xiao S, Wei J, Liu L, et al. 2020. Aerosol transmission of SARS-CoV-2 evidence for probable aerosol transmission of SARS-CoV-2 in a poorly ventilated restaurant. medRxiv. https://www.medrxiv.org/content/10.1101/2020.04.16.20067728v1.full.pdf.
- Liang M, Gao L, Cheng C, Zhou Q, Uy JP, Heiner K, Sun C. 2020. Efficacy of face mask in preventing respiratory virus transmission: a systematic review and meta-analysis. medRxiv. https://www.medrxiv.org/content/10.1101/2020.04.03.20051649v3.
- Liu Y, Ning Z, Chen Y, Guo M, Liu Y, Gali N. K, Sun L, Duan Y, Cai J, Westerdahl D, et al. 2020. Aerodynamic analysis of SARS-CoV-2 in two Wuhan hospitals. Nature. 582(7813):557–560. doi:10.1038/s41586-020-2271-3
- Lu J, Gu J, Li K, Xu C, Su W, Lai Z, Zhou D, Yu C, Xu B, Yang Z. 2020. COVID-19 outbreak associated with air conditioning in restaurant, Guangzhou, China, 2020. Emerging Infect Dis. 26(7):1628–1631. doi:10.3201/eid2607.200764
- Meselson M. 2020. Droplets and aerosols in the transmission of SARS-CoV-2. N Engl J Med. 382(21):2063–2063. doi:10.1056/NEJMc2009324
- Mittal R, Ni R, Seo J.-H. 2020. The flow physics of COVID-19. J Fluid Mech. 894:F2. doi:10.1017/jfm.2020.330
- Morawska L, Milton DK. 2020. It is time to address airborne transmission of COVID-19. Clin Infect Dis. ciaa939. doi:10.1093/cid/ciaa939
- Morono Y, Hoshino T, Terada T, Suzuki T, Sato T, Yuasa H, Kubota Y, Inagaki F. 2018. Assessment of capacity to capture DNA aerosols by clean filters for molecular biology experiments. Microbes Environ. 33(2):222–226. doi:10.1264/jsme2.ME18012
- Murphy SL, Kochanek KD, Xu J, Arias E. 2015. Mortality in the United States, 2014. NCHS data brief No. 229. https://www.cdc.gov/nchs/data/databriefs/db229.pdf.
- Naranbhai V, Chang CC, Beltran WFG, Miller TE, Astudillo MG, Villalba JA, Yang D, Gelfand J, Bernstein BE, Feldman J, et al. 2020. High seroprevalence of anti-SARS-CoV-2 antibodies in Chelsea, Massachusetts. J Infect Dis. doi:10.1093/infdis/jiaa579
- National Environmental Balancing Bureau (NEBB). 2009. Procedural standards for certified testing of cleanrooms. 3rd ed. Gaithersburg MD: NEBB.
- Noakes CJ, Sleigh PA. 2009. Mathematica models for assessing the role of airflow on the risk of airborne infection in hospital wards. J R Soc Interface. 6(suppl_6):S791–S800. doi:10.1098/rsif.2009.0305.focus
- Riley EC, Murphy G, Riley RL. 1978. Airborne spread of measles in a suburban elementary school. Am. J. Epidemiol. 107(5):421–432.
- Rinaldi G, Paradisi M. 2020. An empirical estimate of the infection fatality rate of COVID-19 from the first Italian outbreak. medRxiv. https://www.medrxiv.org/content/10.1101/2020.04.18.20070912v1.full.pdf.
- Singh N, Kaur M. 2020. On the airborne aspect of COVID-19 coronavirus. arXiv:2004.10082.
- Streeck H, Schulte B, Kümmerer BM, Richter E, Höller T, Fuhrmann C, Bartok E, Dolscheid R, Berger M, Wessendorf L, et al. 2020. Infection fatality rate of SARS-CoV-2 infection in a German community with a super-spreading event. medRxiv. https://www.medrxiv.org/content/10.1101/2020.05.04.20090076v2.full.pdf.
- Sze To GN, Chao CYH. 2010. Review and comparison between the Wells-Riley and dose-response approaches to risk assessment of infectious respiratory diseases. Indoor Air. 20(1):2–16. doi:10.1111/j.1600-0668.2009.00621.x
- To KK-W, Tsang OT-Y, Leung W-S, Tam AR, Wu T-C, Lung DC, Yip CC-Y, Cai J-P, Chan JM-C, Chik TS-H, et al. 2020. Temporal profiles of viral load in posterior oropharyngeal saliva samples and serum antibody responses during infection by SARS-CoV-2: an observational cohort study. The Lancet. 20:5.
- US Chemical Safety and Hazard Investigation Board. 2018. Laboratory incidents January 2001–July 2018. https://www.csb.gov/assets/1/6/csb_laboratory_incident_data.pdf.
- US Food and Drug Administration. 2020. Enforcement policy for sterilizers, disinfectant devices, and air purifiers during the coronavirus disease 2019 (COVID-19) public health emergency guidance for industry and food and drug administration staff preface public comment. Tech. Rep. https://www.fda.gov/media/136533/download.
- van den Hurk K, Merz E-M, Prinsze FJ, Spekman MLC, Quee FA, Ramondt S, Slot E, Vrielink H, Huis in 't Veld EMJ, Zaaijer HL, et al. 2020. Low awareness of past SARS-CoV-2 infection in healthy adults. medRxiv. https://www.medrxiv.org/content/10.1101/2020.08.10.20171561v1.full.pdf.
- van Doremalen N, Bushmaker T, Morris DH, Holbrook MG, Gamble A, Williamson BN, Tamin A, Harcourt JL, Thornburg NJ, Gerber SI, et al. 2020. Aerosol and surface stability of SARS-CoV-2 as compared with SARS-CoV-1. N Engl J Med. 382(16):1564–1567. doi:10.1056/NEJMc2004973
- Wang J, Du G. 2020. COVID-19 may transmit through aerosol. Irish J Med Sci. 1–2.
- Watanabe T, Bartrand TA, Omura T, Haas CN. 2012. Dose-response assessment for influenza a virus based on data sets of infection with its live attenuated reassortants. Risk Anal. 32(3):555–565. doi:10.1111/j.1539-6924.2011.01680.x
- Watanabe T, Bartrand TA, Weir MH, Omura T, Haas CN. 2010. Development of a dose-response model for SARS coronavirus. Risk Anal. 30(7):1129–1138. doi:10.1111/j.1539-6924.2010.01427.x
- Wells WF. 1955. Airborne contagion and air hygiene: an ecological study of droplet infections. Cambridge, MA: Harvard Univ. Press.
- Widener A. 2019. By the numbers: who’s going to chemistry and chemical engineering graduate school in the US. Chem Eng News. 96:9.
- Woelfel R, Corman V. M, Guggemos W, Seilmaier M, Zange S, Mueller M. A, Niemeyer D, Vollmar P, Rothe C, Hoelscher M, et al. 2020. Clinical presentation and virological assessment of hospitalized cases of coronavirus disease 2019 in a travel-associated transmission cluster. medRxiv. https://www.medrxiv.org/content/10.1101/2020.03.05.20030502v1
- World Health Organization (WHO). 2011. WHO technical report series no. 961 Annex 6. Geneva: WHO.
- Yan J, Grantham M, Pantelic J, Bueno de Mesquita PJ, Albert B, Liu F, Ehrman S, Milton DK, EMIT Consortium. 2018. Infectious virus in exhaled breath of symptomatic seasonal influenza cases from a college community. Proc Natl Acad Sci USA. 115(5):1081–1086. doi:10.1073/pnas.1716561115
- Zhang Z, Yi Y, Zhao M, Wang W, Qi J. 2014. A blunt sampling probe developed for an in situ leak test of HEPA filters in high-level biosafety laboratory. HVAC&R Res. 20(2):221–229. doi:10.1080/10789669.2013.855070