
Abstract
The main objective was to develop a wipe sampling test to measure surface contamination of the most frequently used antineoplastic drugs (ADs) in Swedish healthcare and, furthermore, to develop an analysis method sensitive enough to assess low levels of contamination. Two wipe sampling tests with separate sample processing methods assessing (i) cyclophosphamide (CP), ifosfamide (IF), 5-fluorouracil (5-FU), etoposide (ETO), gemcitabine (GEM) and cytarabine (CYT) (Wipe Test 1); and (ii) GEM, CYT and methotrexate (MTX) (Wipe Test 2), respectively, were developed by optimization of absorption and extraction efficiencies using different wipe tissue materials, tissue wetting solution, and extraction solvents. A fast liquid chromatography tandem mass spectrometry method was developed for simultaneous detection of the studied ADs. The limit of quantification for the method was between 0.04 to 2.4 ng/wipe sample (0.10 to 6.1 pg/cm2 for an area of 400 cm2) and at 50 ng/sample the within-day precision was between 1.3 and 15%, and the accuracy between 102 and 127%. Wipe Test 1 was applied in an assessment of cleaning efficiency of five different cleaning solutions (formic acid, water, sodium hydroxide, ethanol, and sodium dodecyl sulfate (SDS) for removal of ADs from surfaces made of stainless steel or plastic. For CP, IF, 5-FU, GEM, and CYT 92% of the AD were removed regardless of surface and cleaning solution. In conclusion, a user-friendly assessment method to measure low levels of seven ADs in the work environment was developed and validated. Assessment of the decontamination efficiency of cleaning solutions concerning removal of ADs from stainless steel showed that efficiencies differed depending on the AD with water being the least effective cleaning agent. The results suggests that a combination of different cleaning agents including detergent and a solution with an organic component would be optimal to efficiently remove the measured ADs from surfaces in the workplace.
Introduction
Antineoplastic drugs (ADs) are widely used within the healthcare, primarily for treatment of cancer but treatment of other diseases, such as arthritis is also common. However, these drugs can be mutagenic, carcinogenic, sensitizing, or teratogenic and it is therefore important to limit their presence in the work environment to prevent that groups other than patients receiving treatment are exposed. Knowledge and awareness of surface contamination of AD is a crucial factor to identify hazards, evaluate them, and then manage the risks. In workplaces where ADs are used, wipe sampling can be applied to measure the levels of ADs in the work environment, how effective cleaning routines are, and if handling routines work as planned thereby controlling and limiting the occupational exposure.
A number of ADs are classified by the International Agency for research on cancer as carcinogenic to humans (Group 1) and possibly carcinogenic to humans (Group 2A, Connor and McDiarmid Citation2006; Grosse et al. Citation2009; NIOSH Citation2016) and the occupational exposure should for this reason be as low as possible. Personnel that produce ADs, prepare solutions for infusions, administer infusions to patients, nurse patients treated with ADs (handling urine, washing the patient, and removing bed sheets), or clean contaminated areas may thus be exposed to all ADs used in the workplace via inhalation or skin contact (Kromhout et al. Citation2000; Fransman et al. Citation2005; Hedmer et al. Citation2008; Connor et al. Citation2010; Hon et al. Citation2015). Environmental contamination of ADs can be monitored by wipe sampling of surfaces to determine contamination levels in the workplace, which can be used for assessment of occupational exposure. Studies have shown that surfaces can be contaminated in areas where ADs are prepared or administered but contamination of floors in patient lavatories have also been observed (Hedmer et al. Citation2008; Hedmer and Wohlfart Citation2012; Kiffmeyer et al. Citation2013; Merger et al. Citation2014; Chauchat et al. Citation2019; Jeronimo et al. Citation2021). To protect the personnel, proper and optimized handling and cleaning routines are required as well as use of adequate personal protective equipment and effective safety equipment and devices for safe handling.
Seven frequently used ADs in Scania, in the south Sweden, are 5-fluorouracil (5-FU), cyclophosphamide (CP), ifosfamide (IF), etoposide (ETO), gemcitabine (GEM), cytarabine (CYT), and methotrexate (MTX). It is essential and required to perform measurements of ADs in situations where exposures are not restricted to a point source and direct interaction with the exposure source (Kromhout Citation2016). By measuring surface contamination it is possible to identify if the ADs are adequately controlled or not in the work environment and the awareness of how they are spread at a workplace may be increased. If guidance values based on exposure data from workplaces with good occupational hygiene practice from specific surfaces are derived, these can be applied for comparison of hygiene between workplaces. Increased levels of ADs on surfaces in the work environment, compared to such guidance values, indicate that the handling of AD is not adequately controlled, and this implies an increased risk for the personnel to become exposed. Follow-up studies of the impact of introducing safety measures to prevent ADs from spreading in the work environment have shown that wipe sampling can be an effective method in achieving such goals. In the Netherlands, for example, the introduction of mandatory guidelines to assess spreading of ADs by wipe sampling resulted in lower levels of contamination of ADs over time in hospital pharmacies (Crul and Simons-Sanders Citation2018).
There are several mass spectrometry-based methods described to measure surface contamination of ADs but none of the methods can be used for the simultaneous detection of 5-FU, CP, IF, ETO, GEM, CYT, and MTX at a sufficiently low detection limit (Hedmer et al. Citation2004; Tuerk et al. Citation2011; Nussbaumer et al. Citation2012; Pretty et al. Citation2012; Maeda and Miwa Citation2013; Jeronimo et al. Citation2015; Dal Bello et al. Citation2016; Hetzel et al. Citation2016; Colombo et al. Citation2017; Dugheri et al. Citation2018a, Citation2018b). Furthermore, today, no occupational exposure limits for ADs in work environments exist but in several countries hygienic guidance values have been derived that can be applied when assessing contamination levels of ADs at both pharmacy and hospital workplaces (Schierl et al. Citation2009; Hedmer and Wohlfart Citation2012; Kiffmeyer et al. Citation2013; Sottani et al. Citation2017; Dugheri et al. Citation2018a).
The aim of this study was to develop a robust, fast, specific, and sensitive wipe sampling method based on liquid chromatography tandem mass spectrometry (LC–MS/MS) to quantify surface contamination of several ADs common in healthcare in Sweden. Furthermore, the aim was to evaluate the decontamination efficacy of different standard cleaning solutions used for decontamination of ADs in healthcare environments.
Materials and methods
Chemicals and materials
Cyclophosphamide monohydrate (CP, CAS-nr 6055-19-2, purity 99.5%), 5-fluorouracil (5-FU, CAS-nr 51-21-8), 5-fluorouracil-15N2 (CAS-nr 68941-95-7), and formic acid (FA p.a. 98%, CAS-nr 64-18-6) were purchased from Sigma-Aldrich (St Louis, MO, USA) and cyclophosphamide-d6 (CP-D6; purity 97%) from Phychem (Bergisch Gladbach, Germany). Ifosfamide (IF, CAS-nr 3778-73-2, purity >98%, Holoxan) was purchased from Baxter Medical (Halle, Germany). Ifosfamide-d4 (CAS-nr 1189701-13-0, purity 98%), methotrexate (MTX, CAS-nr 59-05-2, purity 98%), methotrexate-d3 (CAS-nr 432545-63-6, purity 95%), gemcitabine hydrochloride (GEM, CAS-nr 122111-03-9, purity 98%), gemcitabine-13C1,15N2 hydrochloride (CAS-nr 1262897-74-4, purity 98%), cytarabine (CYT, CAS-nr 147-94-4, purity 98%), cytarabine-13C3 (purity 98%), etoposide (ETO, CAS-nr 33419-42-0, purity 98%), and etoposide-d4 (purity 97%) were purchased from Toronto research chemicals (Toronto, Canada). Ethyl acetate (CAS-nr 141-78-6, HPLC grade) and methanol (MeOH, CAS-nr 67-56-1, HPLC grade) were purchased from Lab-Scan (Dublin, Ireland). Acetic acid (CAS-nr 64-19-7, glacial, p.a. >99.8%) and ethanol (95%) came from CCS Healthcare AB (Borlänge, Sweden). Sodium dodecyl sulfate (SDS) was purchased from ICN Biomedicals Inc (Costa Mesa, CA, USA). Ultrapure water was obtained from the water purifier system Milli-Q Integral 5 from Merck Millipore (Billerica, MA, USA). Ashless filter papers (grade 42, D = 47 and D = 70 mm) were purchased from Whatman (GE Healthcare Life science, Amersham Place Little Chalfont, UK) and “non-woven” wipes series 300 (50 × 50 mm, 45% polyester/55% cellulose) came from Dastex (Muggensturm, Germany). Highly absorbent cleaning tissue, Easitex, came from Gunnar Engstrand AB (Stockholm, Sweden). Polypropylene (PP) 50 mL tubes were purchased from Sarstedt (Nümbrecht, Germany) and 12 mL borosilicate glass tubes with threaded end from Fisher Scientific (Hampton, NH, USA). Plates composed of stainless steel, a shelf that was laminated and plastic flooring material made of polyvinyl chloride were cut in-house into 25 × 25 cm units.
Preparation of stock and working solutions
Standard solution
Individual stock solutions were prepared by dissolving between 2 and 10 mg of each AD in either ultrapure water (5-FU, CP, IF, CYT, and GEM) or methanol (ETO and MTX). Two independent solutions per AD were prepared. A mixed stock solution containing all seven drugs was then prepared at 20 µg/mL and the mixed stock solution was further diluted in ultrapure water to working standards solutions at a concentration of 2,000, 1,000, 500, 100, 50, 10, 5, and 1 ng AD/mL. Two independent quality control samples were also prepared as described above, 500 ng/mL and 50 ng/mL. Stock and working solutions were stored at −20 °C. A working solution for spiking experiments was prepared by diluting the mixed stock solution with methanol to a final concentration of 500 ng/mL.
Internal standard (IS) solution
For each analyte an isotopically labeled compound was used as IS. A solution containing all IS was prepared by first dissolving each IS separately at a concentration of 1 mg/mL. The IS 5-fluorouracil-15N2, cyclophosphamide-d6, ifosfamide-d4, cytarabine-13C3, and gemcitabine-13C1,15N2 hydrochloride were all dissolved in ultrapure water and etoposide-d4 and methotrexate-d3 were dissolved in methanol. A mixture of all IS was prepared by dilution in ultrapure water at a final concentration of 0.5 µg/mL (cyclophosphamide-d6, ifosfamide-d4, gemcitabine-13C1,15N2 hydrochloride and methotrexate-d3); 1 µg/mL (cytarabine-13C3, etoposide-d4); and 3 µg/mL (5-fluorouracil-15N2), respectively.
Safety routines
Preparation of solutions containing ADs, wipe sampling experiments with spiked surfaces, as well as work-up procedures of samples were performed in a safety cabinet class II and double layers of gloves of nitrile and polychloroprene (BioClean, Suffolk, United Kingdom), safety goggles and lab coat were used. All decontamination wipe material was discarded in a Pactosafe waste sealing container (Paxxo, Malmö, Sweden).
Methods
The methods were based on sampling of ADs from a surface by wiping the surface using a moistened tissue that subsequently was treated to desorb the ADs from the tissue by extraction in a liquid. The ADs in the liquid were then analyzed by mass spectrometric detection. The wipe sampling step and the extraction of ADs from the wipes was optimized by testing one filter paper, two non-woven swabs and different extraction solutions in order to find the conditions that yielded the highest recovery of absorption from the surface and desorption from the wipe material during extraction, described in the supplemental information. With the tested parameters it was not possible to combine all seven ADs in the same wipe method and therefore two different procedures were validated in parallel, Wipe Tests 1 and 2 ().
Table 1. Overview of sampling methods and work-up procedure of Wipe Tests 1 and 2.
Equipment and method development of analytical method
Analyses were performed using a triple quadrupole (Q) mass spectrometer (MS) equipped with a TurboIonSpray source (API3000; Applied Biosystems/MDS Sciex, Framingham, MA, USA) connected to a LC-system (UFLCXR; Shimadzu Corporation, Kyoto, Japan) supplied with an autoinjector. An LC–MS/MS method was further developed from an in-house analysis method for CP (Hedmer et al. Citation2004). The developed method was based on multiple reaction monitoring (MRM) assays and developed for the simultaneous detection of 7 ADs and their corresponding isotope-labeled AD included as IS, in total 14 compounds (). The MS was operated in the positive ion mode. If possible, two MRMs for each AD were included to further increase the specificity of the analysis (analyte and control fragments). The Q1 and Q3 m/z fragments of the MRMs were selected and the MS-parameters optimized for each AD by flow injection analysis using acidified solutions of each AD (100 ng/mL in 0.5% acetic acid).
Table 2. MRMs of each m/z included in MS-method. Quadrupole 1 (Q1), quadrupole 3 (Q3), declustering potential (DP), collision energy (CE), retention time (tR).
Samples were injected (20 µL) and the compounds were separated on a reversed phase C18 column (Thermo Hypersil gold aqua C18, 3 µm, 50 × 2.1 mm, Thermo Fisher Scientific, Waltham, MA, USA) at a flowrate of 0.3 mL/min in a gradient elution of mobile phase A (0.5% acetic acid) and B (0.5% acetic acid in methanol); A:B 90:10 to A:B, 60:40 for 3.5 min, to A:B 5:95 for 1 min, isocratic at A:B 5:95 for 1.5 min and then back to A:B 90:10 for 0.1 min where it remained for 1.9 min.
Wipe Test 1
Sampling method
A final method was defined for surface sampling of CP, IF, 5-FU, ETO, GEM and CYT. A 400 cm2 surface, defined by a plastic frame (internal measures 20 × 20 cm), was wiped using a Dastex wipe (5 × 5 cm) moistened with 200 µL ultrapure water with S-formed motion back and forth forming approximately 3 to 4 S-formations covering the whole surface in one direction and then with a second wipe moistened with 200 µL ultrapure water in the other direction. Both wipes were placed in a 50 mL PP tube and stored at −20 °C until work-up.
Work-up procedure
Aliquots of 100 µL IS solution (mixture containing all IS) and 20 mL ethyl acetate were added to the sample. The tubes were vortexed for 20 min at minimum speed using a Multi-Tube Vortexer (2500 Multi-Tube Vortexer, VWR International, Radnor, PA, USA). Aliquots of 10 mL of the extract was transferred to 12 mL glass tubes which were evaporated to dryness (Genevac HT-4X, Genevac Sp Scientific, Ipswich, UK). Next, 150 µL of 0.5% acetic acid was added to each tube. Finally, samples were centrifuged at 1,000 ×g for 5 min and the solution was transferred to 1.5 mL glass vials with 200 µL inserts and shortly centrifuged once again at 1,000 ×g for 5 min before analysis.
Quality controls and standards were prepared by adding 100 µL of either quality control working solution or standard working solution to a 50 mL PP tube with two Dastex wipes, 400 µL ultrapure water, and 100 µL IS solution and then treated according to the sample work-up procedure (calibration points 0.1 to 200 ng/sample and weighted linear regression (1/x)).
Wipe Test 2
Sampling method
A final method was defined for surface sampling of GEM, CYT, and MTX. A volume of 200 µL ultrapure water was spread out over a 400 cm2 surface, defined by a plastic frame (internal measures 20 × 20 cm) and the surface was then wiped using a filter paper (Whatman, diameter 47 mm) moisten with 100 µL ultrapure water with S-formed motion forming approximately 3 to 4 S-formations in one direction and then with a second filter paper moisten with 100 µL ultrapure water in the other direction. Both filter papers were placed in a 50 mL PP tube and stored at −20 °C until work-up.
Work-up procedure
Aliquots of 100 µL IS solution (mixture containing all IS) and 5 mL 0.1% formic acid were added to the sample. The tubes were vortexed for 20 min at minimum speed using a Multi-Tube Vortexer. Aliquots of 2.7 mL of the extract was transferred to 12 mL glass tubes which were evaporated to dryness (SpeedVac). Next, 150 µL of 0.5% acetic acid was added to each tube. Finally, samples were centrifuged at 1,000 ×g for 5 min and the solution was transferred to 1.5 mL glass vials with 200 µL inserts and centrifuged once again at 1,000 ×g for 5 min before analysis. Quality controls and standards and were prepared by adding 100 µL of either quality control working solution or standard working solution to a 50 mL PP tube with Whatman filter paper (either one paper; D = 70 mm or two filters; D = 47 mm), 400 µL ultrapure water and 100 µL IS solution and then treated according to the sample work-up procedure (calibration points 0.1 to 200 ng/sample and weighted linear regression (1/x)).
Analytical validation
Matrix effects
Matrix effects were evaluated by assessing the signal of individual MRMs in calibration samples with known amounts of ADs and with and without wipe tissue which were then treated according to the sample work-up procedure. Furthermore, effects arising from cleaning agents were also evaluated by comparing the peak area of internal standards in samples from spiked, decontaminated, and wiped surfaces with spiked and wiped surfaces.
Specificity
The run time of each sample was 8 min and the compounds eluted in the following order; 5-FU, CYT, GEM, MTX, IF, CP, and ETO. Blank samples containing wipe tissue and IS were analyzed and no interfering peaks were detected at the retention time of the corresponding analyte.
Detection limit and linearity
The detection limit and the limit of quantification (LOQ) of each AD was determined by calculating the concentration corresponding to the mean ratio between the peak area of the analyte when integrating the background noise and the peak area of the corresponding IS plus three times and 10 times, respectively, the standard deviation of the ratio between the peak area of the analyte and the peak area of the corresponding IS of 10 blank samples prepared with wipe tissue and subjected to the sample work-up procedure.
Precision and accuracy
Within-day precision (coefficient of variation) was assessed by preparing and analyzing samples spiked with known amounts of all drugs at a high level (N = 10, 50 ng/sample) and a low level (N = 10, 1 ng/sample) at one occasion. The between-day precision was assessed by preparing and analyzing one sample spiked with known amounts of all drugs at a high level (N = 1, 50 ng/sample) and a low level (N = 1, 1 ng/sample) at five occasions over a period of 1 month. Accuracy was determined by relating the quantified amount to the nominal amount. Acceptable levels of precisions were: <20% (high level), <30% (low level), and acceptable level of accuracy was 70–130% (high and low level).
Stability
The stability of each compound was assessed at 4 °C and −20 °C for up to 2 months prepared according to Wipe Test 1 and 2. Samples (N = 6 per temperature and time-point) containing either two Dastex wipes or a Whatman filter paper (D = 70 mm) in a 50 mL PP-tube were spiked with 50 ng per drug (100 µL of a solution, C = 500 ng/mL in ultrapure water) and stored at 4 °C and −20 °C were prepared and analyzed according to method 1 and 2, respectively, at time-points 0, 1, 2, 7, 14, 28, and 56 days.
Recovery
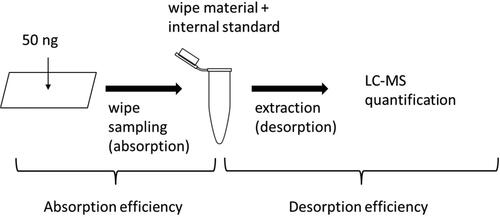
A defined area was spiked with known amounts of each AD (50 ng per substance, 100 µL of a solution containing all drugs with concentration 500 ng per substance/mL in methanol). Wipe sampling and sample work-up and analysis was performed according to Wipe Tests 1 and 2, respectively. For both methods, defined areas composed of three different surface materials were spiked (N = 10 per surface material): stainless steel, laminate, and plastic, i.e., in total 60 areas were spiked. Two recoveries were determined, total recovery and surface recovery. The total recovery was estimated to retrieve information of how efficiently the ADs were desorbed from the wipe material and was derived as the percentage (ratio) between the peak area of each AD in the spiked wipe sampled surfaces treated according to the work-up procedure and the peak area of each AD in a control sample with no tissue added, spiked with the same amount of ADs, evaporated to dryness and dissolved in 150 µL 0.5% acetic acid (extraction step excluded). The surface recovery of AD, i.e., the fraction absorbed to the wipe tissue was determined to estimate the amount of AD that is left on the surface during sampling (). The surface recovery was calculated as the percentage (ratio) between the concentration of spiked and wiped surface samples treated according the sample work-up procedure and the concentration of a quality control sample (containing either Dastex wipe or Whatman filter) spiked with the same amount of AD (subjected to the sample work-up procedure).
Figure 1. Overview of crucial steps in the sample work-up where potentially the substances could be lost either due to that they were not fully absorbed to the wipe tissue or that they were not fully desorbed at the extraction step and thus not leading to a 100% recovery.
Application of the Wipe Test evaluation of efficacy of cleaning solution for surface decontamination of AD
The efficiency of five solutions, with different chemical properties, representing constituents of commonly used detergents in healthcare were evaluated by spiking a defined area (20 × 20 cm) of either stainless steel or plastic with known amounts of the ADs, in total 50 ng of each AD (100 µL of 500 ng per substance/mL in methanol). After 5 min, 4 mL of either 0.1% FA, 70% ethanol, 10 mM SDS solution (in ultrapure water), or 30 mM sodium hydroxide or pure water, respectively, was evenly spread over the area (N = 5 per surface material and decontamination solution). The surfaces were then decontaminated by using high absorption cleaning tissues cut in half first by sweeping the area with S-shape movements in one direction and then with the other half in the opposite direction. The remaining levels of CP, IF, 5-FU, ETO, GEM, and CYT were determined by Wipe Test 1.
Positive control samples were also prepared by spiking surfaces (N = 5 per surface material) with 50 ng of each AD (100 µL of 500 ng per substance/mL in methanol) and after 5 min the surface was wiped according to method 1.
Statistics surface decontamination
The amount left on the surfaces following eliminations of ADs by cleaning (decontamination) was quantified and the average amount (N = 5) was determined for each surface and substance. Residuals were expressed as the percentage calculated between the amount left for each AD and surface (N = 5) and the corresponding positive control samples (for each AD and surface material (N = 5)). One-way analysis of variance (ANOVA) with 95% significance level was applied to assess any differences in AD removal between different solutions and surfaces. Post hoc tests were applied by pairwise sampling of the different cleaning solutions. Data were processed in the statistical software SPSS (IBM SPSS Statistics, version 24).
Results
Analytical validation
Matrix effects
The slope of the calibration curve obtained from 10 calibration samples between 0.1 and 200 ng/sample with and without wipe tissue added, respectively, was compared by correlating the peak area of the AD to the concentration for each AD (supplemental information). For CP and IF the slope of the curve differed less than 5% based on the slope derived from analyte peak areas. For GEM, 5-FU and ETO a clear suppression was seen as the slope differed 35, 26, and 10%, respectively. However, when the peak area from the internal standards were included and the slope calculated based on peak area ratios between the analyte and the internal standard the difference decreased to 3, 5, and 4%, respectively, showing that the application of IS compensated for matrix effects caused by the wipe material. Matrix effects were also observed for CYT and MTX that showed 32 and 38% reduction of signal when filter paper were added to the samples but when peak area ratios was applied the slope of the calibration curve differed 6 and 7%, respectively. The results thus showed that although matrix effects could be detected for some of the ADs the major part of the effect could be managed and the suppression compensated for by the addition of internal standards. Accordingly, since the calibration points were used to quantify the content of wiped surfaces addition of wipe materials to the standards was included in the method.
The potential signal suppression or enhancement originating from cleaning agents already added to the surface before wipe sampling was evaluated (supplemental information). Ratios ranging between 0.7 to 1.5 indicated that some cleaning agents may suppress or enhance the signal of some ADs. However, it is likely that the IS would compensate for the effects caused by the cleaning agents.
Detection limit and linearity
The detection limit of each AD was determined (). The slope of the calibration curve was obtained from calibration samples containing sample matrix, i.e., wipe material and that were treated according to the sample work-up procedure. Standards were included between 0 and 200 ng substance/sample and the calibration curves were linear in that range (R2≥0.99) for all compounds.
Table 3. Detection limits (LOD) and limit of quantification (LOQ) calculated for each antineoplastic drug (N = 10 samples).
Recovery
The surface recovery of AD at the wipe sampling step was determined (). The total recovery, i.e., without any compensation of losses during the work-up procedure, was also determined ().
Table 4. Results for wipe sampling test to assess the surface recovery, i.e., the fraction of sample recovered at the sampling step.
Table 5. Results for wipe sampling test to assess the total recovery.
Precision and accuracy
Within-day precision (coefficient of variation) was assessed at 50 and 1 ng/sample ( and ). The between-day precision was assessed at 50 and 1 ng/sample ( and ).
Table 6. Within-day precision and accuracy of Wipe Test 1 was determined at a high and low level.
Table 7. Within-day precision and accuracy of Wipe Test 2 was determined at a high and low level.
Table 8. Between-day precision and accuracy of Wipe Test 1 determined at a high and low level.
Table 9. Between-day precision and accuracy of Wipe Test 2 determined at a high and low level.
Within-day variation Wipe Test 1
All ADs except MTX were evaluated with method 1 since the total recovery of MTX was close to 0 when using method 1 and it could thus not be evaluated with acceptable precision. For CP, IF, 5-FU, ETO, and GEM, a low variation was found at 50 ng/sample, ranging between 1 and 8%, for CYT 14% and the accuracy (compared to the nominal amount), was between 102 and 116%. At the low level (1 ng/sample) the variation of CP, IF, 5-FU, and ETO was between 3 and 15%, for GEM 23% and for CYT it was 217%. However, one of the 10 samples were an extreme outlier and if excluded the accuracy was 77% and the relative standard deviation (RSD) 7%. The accuracy showed less than 30% deviance for all drugs evaluated in panel 1, with the exception of CYT.
Between-day variation Wipe Test 1
All ADs showed a low variation at 50 ng/sample, ranging between 3 and 8%, and the accuracy (compared to the nominal amount) was between 98 and 118%. At the low level (1 ng/sample) the relative standard deviation was below 20% for all ADs and the accuracy below 130% for CP, GEM, and CYT. For IF, 5-FU and ETO the levels were overestimated, with accuracies ranging between 137 and 148%.
Within-day variation Wipe Test 2
Due to the lower total recoveries of CP, IF, 5-FU, and ETO yielded in method 2 compared with Wipe Test 1 only parameters of CYT, GEM, and MTX were assessed when applying Wipe Test 2. A low variation was found at 50 ng/sample, ranging between 2 and 6%, and the accuracy (compared to the nominal amount) was between 109 and 127%. At the low level (1 ng/sample) the variation was 12–14% and the accuracy between 104 and 133%.
Between-day variation Wipe Test 2
The variation of CYT, GEM, and MTX at 50 ng/sample ranged between 12 and 17%, and the accuracy (compared to the nominal amount) was between 106 and 122%. At the low level (1 ng/sample) the precision was between 9 and 19% and the accuracy between 139 and 149%.
Stability
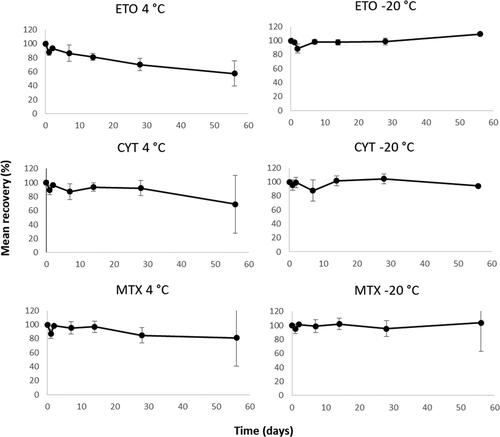
Samples prepared and analyzed by either Wipe Test method 1 or 2 showed no degradation at −20 °C exceeding 100 ± 10% ( and ). When stored at 4 °C degradation of ETO (method 1) and CYT, GEM and MTX (method 2) were observed ( and ). After 2 weeks the recovery of ETO was approximately 80% and after 2 months approximately 60%. The recoveries for CYT, GEM, and MTX was approximately 70–80% after storage for 2 months.
Figure 2. Assessment of long-term storage of CP, IF, 5-FU, and GEM in wipe samples spiked with 50 ng per drug and stored at 4 °C and -20 °C and then prepared and analyzed according to method 1. Mean recovery from six samples per temperature and time-point and error bars representing the relative standard deviation.
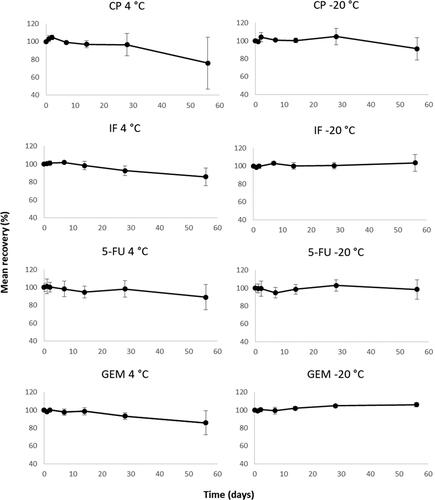
Figure 3. Assessment of long-term storage of spiked wipe samples containing ETO, CYT, and MTX stored at 4 °C and -20 °C and them prepared and analyzed according to method 1 (ETO) and 2 (CYT and MTX), respectively. Mean recovery from six samples per temperature and time-point and error bars representing the relative standard deviation.
Application of wipe sampling—assessment of decontamination solutions
A significant difference was observed between cleaning solutions for CP, IF, ETO, and CYT when residuals levels of CP, IF, 5-FU, ETO, GEM, and CYT on stainless steel tiles were evaluated ( and ). When residual levels of ADs on plastic tiles were determined a significant difference between the efficiency of different cleaning solutions was only observed for ETO ( and ).
Figure 4. Percentage of remaining residual of AD (%) determined from spiked, cleaned, and sampled tiles of stainless steel (N = 5). Error bars representing SD (%).
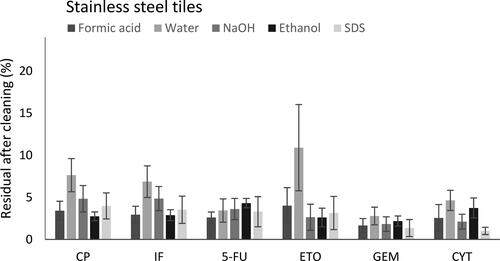
Figure 5. Percentage of remaining residual of AD (%) determined from spiked, cleaned, and sampled tiles of plastics (N = 5). Error bars representing SD (%).
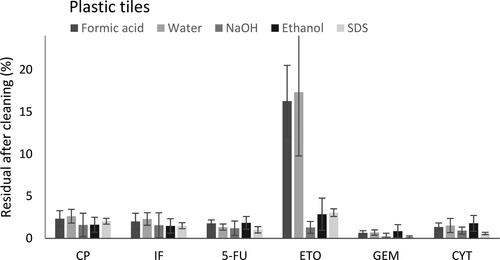
Table 10. Statistical analysis with one-way ANOVA of residuals of ADs following decontamination of a spiked surface of stainless steel (N = 5 per cleaning solution).
Table 11. Statistical analysis with one-way ANOVA of residuals of ADs following decontamination of a spiked surface of plastic surface (N = 5 per cleaning solution).
Cyclophosphamide
A statistically significant difference between five different cleaning solutions was observed when CP was decontaminated on stainless steel (p < 0.05). Post hoc statistical analysis showed that all cleaning solutions tested removed CP more efficiently than water and furthermore ethanol was more efficient than sodium hydroxide in removing CP (). There was no significant difference between cleaning solutions when CP was decontaminated on plastic material (p = 0.37).
Table 12. Post hoc statistical analysis, multiple comparisons between cleaning solution on stainless steel and plastics, respectively.
Ifosfamide
A statistically significant difference between cleaning solutions was observed when IF was decontaminated on stainless steel (p < 0.05) but not on a plastic surface. Pairwise tests showed that all cleaning solutions removed IF more efficiently than water and also that formic acid and 70% ethanol had higher cleaning efficiency that sodium hydroxide.
5-Fluorouracil
There was no statistical difference between cleaning solutions for 5-FU, neither on stainless steel (p = 0.32) nor on plastics (p = 0.15), when comparing the efficiency of removal of 5-FU. However, pairwise tests still showed that formic acid removed 5-FU from stainless steel with higher efficiency that ethanol (p < 0.05) and that SDS removed 5-FU from plastic surface more efficiently than ethanol (p < 0.05).
Etoposide
Statistically significant differences between cleaning solutions was observed when ETO was decontaminated on stainless steel (p < 0.05) as well as on plastic surface (p < 0.05). On stainless steel, all cleaning solutions removed ETO more efficiently than water. On plastics sodium hydroxide, ethanol and SDS removed ETO more efficiently than water or formic acid, leaving less than 3% of the AD on the surface after cleaning.
Gemcitabine
There was no statistical difference when comparing the efficiency of removal of GEM between five cleaning solutions, neither on stainless steel (p = 0.15) nor on plastics (p = 0.08).
Cytarabine
A statistically significant difference between cleaning solutions was observed when CYT was decontaminated on stainless steel (p < 0.05). Decontamination using a 10 mM SDS solution removed CYT more efficiently than formic acid, water, and ethanol. Sodium hydroxide removed CYT more efficiently than water and ethanol. No difference was observed between the efficiency of cleaning solutions to remove CYT from plastic surface (p = 0.35).
Discussion
Analytical validation
Due to inherently different properties of the seven included ADs two different methods were developed in this study: Wipe Test 1, applicable for CP, IF, 5-FU, ETO, GEM and CYT, and Wipe Test 2, for GEM, MTX, and CYT. Ideally, it would have been possible to analyze all seven ADs with one wipe method in order to monitor levels of contaminations, especially if all or several of the ADs available in the panels are to be analyzed. Now there will be a possible tradeoff between number of samples and number of different ADs included in surface monitoring. However, a selection of ADs could also be chosen for monitoring contamination of workplaces, since one of the ADs can work as a surrogate to monitor contamination of others. In those cases it is an advantage to offer as many ADs as possible for analysis regardless of they exist in one or several different wipe methods. Both methods were validated with regard to accuracy and precision at two different levels and stability at one level over a time-period of 2 months and proved to be sensitive enough to be used within industrial hygiene applications such as exposure assessments. As such, there is an advantage if the method manage to measure low levels of contaminations to control and adjust safety measures and cleaning routines but also not too complicated to prevent measurements to be made. In comparison to other existing Wipe Tests, these methods primarily hold two advantages. In both Wipe Tests the wipe tissue was moistened with water unlike several of other sampling procedure applying components of organic solvents (Jeronimo et al. Citation2015, Nussbaumer et al. Citation2012, Dugheri et al. Citation2018a) making this method more environmentally and user-friendly. Moreover, the limits of detection and quantification were low compared to previous methods (Rossignol et al. Citation2020, Dugheri et al. Citation2018a, Jeronimo et al. Citation2015, Bobin-Dubigeon et al. Citation2013, Tuerk et al. Citation2011, Pretty et al. Citation2012). A method that can measure low surface concentrations offers the possibility for work places to minimize contaminations to a high degree as even small amounts from spills or leakages can be detected and to optimize cleaning routines. The precision found at both tested levels (1 and 50 ng/sample) were found to be within the acceptance criteria set at below 20 and 30%, for the high and low level respectively, with exception for CYT that however showed a precision of 7% once an outlier was excluded from the average value. This was also supported by the between-day precision for CYT at the low level that was 19%. The within-day accuracies were less or close to 130% for all ADs but the between-day accuracies for IF, 5-FU, and ETO (Wipe Test 1) and all ADs in Wipe Test 2 were slightly biased outside the set acceptance criteria at 1 ng/sample possible due to variance in instrument response. The exposure risk is however larger at higher AD concentrations and therefore a larger deviance could be accepted when quantification of low levels of contaminations are made. The advantage to obtain an analytical value would conciliate the minor deviance in accuracy. And the between-day accuracies at 50 ng/sample were all within the set criteria.
It was important to assess the recovery of ADs at different steps of the sampling and sample work-up procedure. The surface recovery shows how efficiently the ADs are wiped from the surface and can be applied to adjust wipe quantifications if the surface material is known. The total recovery, i.e., the combination of sampling step and all losses occurring during the work-up procedure showed which of the drugs that could be measured in each method. Since the surface recovery were based on concentrations and the total recovery based on peak areas, the total recovery for each AD can theoretically be less than the surface recovery. For example, the total recovery for CYT analyzed with Wipe Test 1 was around 3%, likely due to strong adherence of the AD to the wipe material, and therefore the surface recovery of CYT for this method would in fact be 76–85% of the fraction obtained from the total recovery. The losses observed when determining the total recovery are, however, compensated for during quantification as the method applies the use of internal standards. For MTX, Wipe Test 1 yielded a total recovery close to zero meaning that the assay could not be applied for this compound. On the other hand, for CYT, that also yielded a low recovery with Wipe Test 1, the LC–MS/MS response was very high so although the recovery was low, it was still possible to quantify the compound although due to a lower detection limit obtained for CYT by using Wipe Test 2, this one would preferable be used.
The efficiency of wipe materials to absorb ADs was investigated by studying surface material of stainless steel, laminate, and plastic. ETO, a hydrophobic molecule with quite large molecular weight, had on average lower recovery (higher loss) on all three surface materials compared to the other compounds when sampled and analyzed using Wipe Test 1. CP and IF were both to a larger degree retained on stainless steel rather than plastic or laminate. When comparing GEM and CYT that both were evaluated using Wipe Tests 1 and 2, the relationship between recoveries on the different surface materials remain constant for GEM although the level of loss was higher when Wipe Test 2 was applied. For CYT the recoveries were similar regardless of method implying that the wipe material had similar impact on absorption for CYT.
The assessment of degradation of ADs when stored at −20 and 4 °C showed that the stability varies between the compounds. At −20 °C no degradation exceeding 100 ± 10% was observed for CP, IF, 5-FU, GEM, and ETO when measured with Wipe Test 1 and CYT, GEM, and MTX with Wipe Test 2. Since degradation was observed at 4 °C for CP, ETO CYT, GEM, and MTX samples should be frozen immediately following wipe sampling to prevent underestimation of contamination levels. It cannot be ruled out that the degradation pattern would look different at lower levels as the stability only was assessed at one level in this study. Overall, variation and loss of AD can depend on many factors such as adherence of ADs to surface and sample materials but also originating from wipe sampling technique that can vary between personnel. Such variation has been observed in other studies making it important to apply adequate training for any personnel before conducting sampling at workplaces (Tuerk et al. Citation2011; Jeronimo et al. Citation2015).
Evaluation of decontamination efficiency
In order to limit occupational exposure to ADs, one important measure is to optimize cleaning routines. However, ADs do not belong to a homogenous group of chemicals but rather span over a large variety of chemical and physical properties and therefore the decontamination efficiency of different cleaning solutions were investigated. A few studies have addressed this question by assessing the decontamination efficiency of disinfectants and detergents. In this study, single compound cleaning solutions instead of solutions of mixed components were selected for evaluation. There are also many cleaning products available that contain several components but such products were not tested in this study due to difficulty to associate results to their properties. The results showed that none of the cleaning solutions decontaminated the surfaces to 100% but for CP, IF, 5-FU, GEM, and CYT more than 92% of the ADs was decontaminated regardless of surface and cleaning solution. However, differences could be detected between the ADs which is not surprising since they have quite different chemical properties. Neither of the cleaning solution removed the ADs completely but in most cases only low amounts remained after cleaning. Water was shown to be the overall least effective cleaning solution leaving the highest residual amounts of not only the hydrophobic drug ETO on plastic surface but also CP and IF on stainless steel. The results of the present cleaning study is supported by earlier findings (Queruau Lamerie et al. Citation2013; Anastasi et al. Citation2015; Böhlandt et al. Citation2015). Böhlandt et al. showed that cleaning products with surfactant and alcohol removed GEM and 5-FU with high efficiency, more that 93% of the ADs were removed regardless of surface material (Böhlandt et al. Citation2015). Those results were also in agreement with the present study since our results showed that regardless of surface material, all drugs were removed with at least 95% efficiency by the surfactant (10 mM SDS), ethanol, or sodium hydroxide. Anastasi et al. assessed the decontamination efficiency of isopropyl alcohol (IPA) and a mixture of 10 mM SDS and 20% IPA for removal of 10 ADs (CYT, GEM, ETO, CP, IF, doxorubicin, epirubicin, irinotecan, metothrexate, and vincristine) and found that the solution with SDS content reduced AD levels to a larger extent (Anastasi et al. Citation2015). In a comprehensive study of decontamination efficiency of a range of different cleaning solutions it was shown that solutions containing anionic surfactant such as SDS removed 10 studied ADs (CYT, GEM, ETO, CP, IF, doxorubicin, epirubicin, irinotecan, metothrexate, and vincristine) with high efficiency (Queruau Lamerie et al. Citation2013). Furthermore, they found that sodium hypochlorite, an agent not tested in the present study, showed the highest AD decontamination efficiency (98%). Quaternary ammonium and sodium hypochlorite solutions were also tested by Adé et al. to remove cyclophosphamide from safety cabinet workbenches and the agents were found to efficiently remove the AD (>97%) (Adé et al. Citation2017). Likewise, Palamini and coworkers also reported high efficiency of water, quaternary ammonium, and sodium hypochlorite solutions for removal of IF, 5-FU, and MTX from stainless steel surfaces (Palamini et al Citation2021). The use of hypochlorite can, however, cause corrosive damage on surfaces of stainless steel and, furthermore, potentially form unknown AD degradation products (Barek et al. Citation1998) making it less suitable for decontamination of ADs. If destructive decontamination solutions like sodium hypochlorite will not be used it will likely be necessary to perform repeated cleaning sessions that will reduce the residuals of ADs. This is supported by Adé et al. who showed that five repeated cleaning sessions yielded total decontamination (Adé et al. Citation2017).
For several of the ADs it could be seen that regardless of cleaning solution it was easier to remove the compounds from plastic material than stainless steel. All levels determined after cleaning were above the detection limit and were thus reliable. When decontaminating plastic material is was observed in this study that for all compounds except ETO no significant difference was seen when comparing different decontamination solutions. For ETO that is a hydrophobic drug and thus likely were retained by the surface this study showed that decontamination with water or a weak acidic solution left a significantly higher amount of ETO on the surface.
Conclusions
Two wipe sampling tests were developed for surface contamination measurements of in total seven ADs. Validation showed precisions within the acceptance criteria of <20% (high level) and <30% (low level) and accuracies within the acceptable range at the high level. For the low level the accuracies were slightly above the acceptable range but still considered applicable for use. Surface recovery was assesses at three different materials and was in general above 70% except for MTX that ranges between 18 and 56%. Detection limits were lower than reported in previous publications eligible for assessment of occupational exposure in Swedish healthcare units. The wipe samples should be stored at −20 °C until analysis and no degradation could be observed for up to 2 months when stored at −20 °C.
Assessment of five different cleaning solutions (0.1% formic acid, water, 30 mM sodium hydroxide, 70% ethanol, and 10 mM SDS) for removal of ADs from surfaces made of stainless steel or plastic showed that depending on the AD different solution were optimal for decontamination but that for cyclophosphamide, ifosfamide, 5-fluorouracil, gemcitabine, and cytarabine 92% were removed regardless of surface material and solution. Water was the least effective cleaning agent of the ones studied when assessing removal of antineoplastic drugs on surface of stainless steel. If only one AD is handled the cleaning can be tailored for that use but if several ADs are used then a combination of different solutions including detergent and a solution with an organic component (e.g., an alcohol) would likely improve the efficiency to remove ADs from surfaces in the workplace.
Declaration of conflicting interests
The authors declare that there is no conflict of interest.
Supplemental Material
Download PDF (518.1 KB)Acknowledgments
The authors would like to thank Dr Anna Axmon, Lund University, for valuable assistance regarding statistical applications. The project was funded by the Department of Occupational and Environmental Medicine, Region Skåne.
Funding
The authors received no financial support for this research, authorship, or publication of this article.
Data availability
Additional data sets have been supplied as supporting information.
References
- Adé A, Chauchat L, Frève JO, Gagné S, Caron N, Bussières J-F. 2017. Comparison of decontamination efficacy of cleaning solutions on a biological safety cabinet workbench contaminated by cyclophosphamide. Can J Hosp Pharm. 70(6):407–414. doi:https://doi.org/10.4212/cjhp.v70i6.1708
- Anastasi M, Rudaz S, Queruau Lamerie T, Odou P, Bonnabry P, Fleury-Souverain S. 2015. Efficacy of two cleaning solutions for the decontamination of 10 antineoplastic agents in the biosafety cabinets of a hospital pharmacy. Ann Occup Hyg. 59(7):895–908. doi:https://doi.org/10.1093/annhyg/mev031
- Barek J, Cvacka J, de Méo M, Laget M, Michelon J, Castegnaro M. 1998. Chemical degradation of wastes of antineoplastic agents amsacrine, azathioprine, asparaginase and thiotepa. Ann Occup Hyg. 42(4):259–266. doi:https://doi.org/10.1016/s0003-4878(98)00023-4
- Bobin-Dubigeon C, Amiand M, Percheron C, Audeval C, Rochard S, Leynia P, Bard JM. 2013. A new, validated wipe-sampling procedure coupled to LC-MS analysis for the simultaneous determination of 5-fluorouracil, doxorubicin and cyclophosphamide in surface contamination. J Anal Toxicol. 37(7):433–439. doi:https://doi.org/10.1093/jat/bkt045
- Böhlandt A, Groeneveld S, Fischer E, Schierl R. 2015. Cleaning efficiencies of three cleaning agents on four different surfaces after contamination by gemcitabine and 5-fluorouracile. J Occup Environ Hyg. 12(6):384–392. doi:https://doi.org/10.1080/15459624.2015.1009985
- Chauchat L, Tanguay C, Caron NJ, Gagné S, Labrèche F, Bussières JF. 2019. Surface contamination with ten antineoplastic drugs in 83 Canadian centers. J Oncol Pharm Pract. 25(5):1089–1098. doi:https://doi.org/10.1177/1078155218773862
- Colombo M, Jeronimo M, Astrakianakis G, Apte C, Hon CY. 2017. Wipe sampling method and evaluation of environmental variables for assessing surface contamination of 10 AD by liquid chromatography/tandem mass spectrometry. Ann Work Expo Health. 61(8):1003–1014. doi:https://doi.org/10.1093/annweh/wxx070
- Connor TH, DeBord DG, Pretty JR, Oliver MS, Roth TS, Lees PS, Krieg EF, Jr, Rogers B, Escalante CP, Toennis CA, et al. 2010. Evaluation of antineoplastic drug exposure of health care workers at three university-based US cancer centers. J Occup Environ Med. 52(10):1019–1027. doi:https://doi.org/10.1097/JOM.0b013e3181f72b63
- Connor TH, McDiarmid MA. 2006. Preventing occupational exposures to antineoplastic drugs in health care settings. CA Cancer J Clin. 56(6):354–365. doi:https://doi.org/10.3322/canjclin.56.6.354
- Crul M, Simons-Sanders K. 2018. Carry-over of antineoplastic drug contamination in Dutch hospital pharmacies. J Oncol Pharm Pract. 24(7):483–489. doi:https://doi.org/10.1177/1078155217704990
- Dal Bello F, Santoro V, Scarpino V, Martano C, Aigotti R, Chiappa A, Davoli E, Medana C. 2016. Antineoplastic drug determination by HPLC-HRMS(n) to monitor occupational exposure. Drug Test Anal. 8(7):730–737. doi:https://doi.org/10.1002/dta.1827
- Dugheri S, Bonari A, Pompilio I, Boccalon P, Mucci N, Arcangeli G. 2018a. A new approach to assessing occupational exposure to antineoplastic drugs in hospital environments. Arh Hig Rada Toksikol. 69(3):226–237. doi:https://doi.org/10.2478/aiht-2018-69-3125
- Dugheri S, Bonari A, Pompilio I, Boccalon P, Tognoni D, Cecchi M, Ughi M, Mucci N, Arcangeli G. 2018b. Analytical strategies for assessing occupational exposure to antineoplastic drugs in healthcare workplaces. Med Pr. 69(6):589–604. doi:https://doi.org/10.13075/mp.5893.00724
- Fransman W, Vermeulen R, Kromhout H. 2005. Dermal exposure to cyclophosphamide in hospitals during preparation, nursing and cleaning activities. Int Arch Occup Environ Health. 78(5):403–412. doi:https://doi.org/10.1007/s00420-004-0595-1
- Grosse Y, Baan R, Straif K, Secretan B, El Ghissassi F, Bouvard V, Benbrahim-Tallaa L, Guha N, Galichet L, Cogliano V. 2009. A review of human carcinogens-part A: pharmaceuticals. WHO International Agency for Research on Cancer Monograph Working Group. Lancet Oncol. 10(1):13–14. doi:https://doi.org/10.1016/S1470-2045(08)70286-9
- Hedmer M, Jönsson BAG, Nygren O. 2004. Development and validation of methods for environmental monitoring of cyclophosphamide in workplaces. J Environ Monit. 6(12):979–984. doi:https://doi.org/10.1039/b409277e
- Hedmer M, Tinnerberg H, Axmon A, Jönsson BAG. 2008. Environmental and biological monitoring of AD in four workplaces in a Swedish hospital. Int Arch Occup Environ Health. 81(7):899–911. doi:https://doi.org/10.1007/s00420-007-0284-y
- Hedmer M, Wohlfart G. 2012. Hygienic guidance values for wipe sampling of AD in Swedish hospitals. J Environ Monit. 14(7):1968–1975. doi:https://doi.org/10.1039/c2em10704j
- Hetzel T, Vom Eyser C, Tuerk J, Teutenberg T, Schmidt TC. 2016. Micro-liquid chromatography mass spectrometry for the analysis of antineoplastic drugs from wipe samples. Anal Bioanal Chem. 408(28):8221–8229. doi:https://doi.org/10.1007/s00216-016-9932-y
- Hon CY, Teschke K, Shen H, Demers PA, Venners S. 2015. Antineoplastic drug contamination in the urine of Canadian healthcare workers. Int Arch Occup Environ Health. 88(7):933–941. doi:https://doi.org/10.1007/s00420-015-1026-1
- Jeronimo M, Colombo M, Astrakianakis G, Hon C-Y. 2015. A surface wipe sampling and LC-MS/MS method for the simultaneous detection of six AD commonly handled by healthcare workers. Anal Bioanal Chem. 407(23):7083–7092. doi:https://doi.org/10.1007/s00216-015-8868-y
- Jeronimo M, Arnold S, Astrakianakis G, Lyden G, Stewart Q, Petersen A, Chambers C, Malard Johnson D, Zimdars E, Kaup H, et al. 2021. Spatial and temporal variability in antineoplastic drug surface contamination in cancer care centers in Alberta and Minnesota. Ann Work Expo Health. 2021:1–15.
- Kiffmeyer TK, Tuerk J, Hahn M, Stuetzer H, Hadtstein C, Heinemann A, Eickmann U. 2013. Application and assessment of a regular environmental monitoring of the antineoplastic drug contamination level in pharmacies—the MEWIP project. Ann Occup Hyg. 57(4):444–455. doi:https://doi.org/10.1093/annhyg/mes081
- Kromhout H. 2016. Hygiene without numbers. Ann Occup Hyg. 60(4):403–404. doi:https://doi.org/10.1093/annhyg/mev096
- Kromhout H, Hoek F, Uitterhoeve R, Huijbers R, Overmars RF, Anzion R, Vermeulen R. 2000. Postulating a dermal pathway for exposure to anti-neoplastic drugs among hospital workers. Applying a conceptual model to the results of three workplace surveys. Ann Occup Hyg. 44(7):551–560. doi:https://doi.org/10.1016/s0003-4878(00)00050-8
- Maeda S, Miwa Y. 2013. Multicomponent high-performance liquid chromatography/tandem mass spectrometry analysis of ten chemotherapeutic drugs in wipe samples. J Chromatogr B Analyt Technol Biomed Life Sci. 921–922:43–48.
- Merger D, Tanguay C, Langlois E, Lefebvre M, Bussières JF. 2014. Multicenter study of environmental contamination with antineoplastic drugs in 33 Canadian hospitals. Int Arch Occup Environ Health. 87(3):307–313. doi:https://doi.org/10.1007/s00420-013-0862-0
- NIOSH. 2016. NIOSH list of antineoplastic and other hazardous drugs in healthcare settings, 2016. By Connor TH, MacKenzie BA, DeBord DG, Trout DB, O’Callaghan JP, Cincinnati OH. U.S. Department of Health and Human Services, Centers for Disease Control and Prevention, National Institute for Occupational Safety and Health, DHHS (NIOSH) Publication Number 2016–2161.
- Nussbaumer S, Geiser L, Sadeghipour F, Hochstrasser D, Bonnabry P, Veuthey J-L, Fleury-Souverain S. 2012. Wipe sampling procedure coupled to LC-MS/MS analysis for the simultaneous determination of 10 cytotoxic drugs on different surfaces. Anal Bioanal Chem. 402(8):2499–2509. doi:https://doi.org/10.1007/s00216-011-5157-2
- Palamini M, Floutier M, Gagné S, Caron N, Bussières JF. 2021. Evaluation of decontamination efficacy of four antineoplastics (ifosfamide, 5-fluorouracil, irinotecan, and methotrexate) after deliberate contamination. J Occup Environ Hyg. 18(2):43–50. doi:https://doi.org/10.1080/15459624.2020.1854458
- Pretty JR, Connor TH, Spasojevic I, Kurtz KS, McLaurin JL, B’Hymer C, Debord DG. 2012. Sampling and mass spectrometric analytical methods for five AD in the healthcare environment. J Oncol Pharm Pract. 18(1):23–36. doi:https://doi.org/10.1177/1078155210389215
- Queruau Lamerie T, Nussbaumer S, Décaudin B, Fleury-Souverain S, Goossens J-F, Bonnabry P, Odou P. 2013. Evaluation of decontamination efficacy of cleaning solutions on stainless steel and glass surfaces contaminated by 10 antineoplastic agents. Ann Occup Hyg. 57(4):456–469. doi:https://doi.org/10.1093/annhyg/mes087
- Rossignol E, Amiand MB, Sorrieul J, Bard JM, Bobin-Dubigeon C. 2020. A fully validated simple new method for environmental monitoring by surface sampling for cytotoxics. J Pharmacol Toxicol Methods. 101:106652. doi:https://doi.org/10.1016/j.vascn.2019.106652
- Schierl R, Böhlandt A, Nowak D. 2009. Guidance values for surface monitoring of AD in German pharmacies. Ann Occup Hyg. 53(7):703–711.
- Sottani C, Grignani E, Oddone E, Dezza B, Negri S, Villani S, Cottica D. 2017. Monitoring surface contamination by antineoplastic drugs in Italian hospitals: performance-based Hygienic Guidance Values (HGVs) project. Ann Work Expo Health. 61 (8):994–1002. doi:https://doi.org/10.1093/annweh/wxx065
- Tuerk J, Kiffmeyer TK, Hadtstein C, Heinemann A, Hahn M, Stuetzer H, Kuss HM, Eickmann U. 2011. Development and validation of an LC–MS/MS procedure for environmental monitoring of eight cytostatic drugs in pharmacies. Int J Environ Anal Chem. 91(12):1178–1190. doi:https://doi.org/10.1080/03067319.2010.494769