
Abstract
Dental procedures require patients to be unmasked throughout most of a dental visit, with some procedures generating both inhalable and respirable aerosols. Understanding aerosol generation and transport were important to developing protocols to protect both the patient and workers in dental environments early in the COVID pandemic. This study investigated the need, suitability, and effectiveness of using local exhaust ventilation units during patient procedures and examined the impact of patient density in a large, multi-chair dental clinic at an academic institution. Phase One measured respirable aerosol concentrations at the dental assistant’s breathing zone and in neighboring unoccupied patient operatories. Results were compared during four dental procedures with three local ventilation (LV) options, with a single faculty performing procedures on a simulated patient. Phase Two deployed LV in all active patient operatories during procedures on actual patients and examined the impact of clinic patient occupancy on respirable aerosol concentrations throughout the clinic. During Phase One, respirable aerosol concentrations in nearby operatories were significantly higher during ultrasonic scaling (mean = 3.8 and SD = 0.3 µg/m3) and lower during rubber cup polishing (mean = 0.8 and SD = 0.5 mg/m3) (p < 0.001). While the same trend was identified for the dental assistant, differences were not significant. There was no difference in respirable aerosol concentrations by LV type when measured at the dental assist (p = 0.51, task means 3 to 32. 5 µg/m3) or neighboring rooms (p = 0.93, task means 0.6 to 4.0 µg/m3), indicating no improved control for any device tested. For Phase Two, the clinic deployed the extraoral suction (EOS) system in each patient operatory. The background-adjusted aerosol concentrations were significantly reduced (F < 0.001) when the operatories were occupied at 50% compared to 25%, likely attributed to increased air filtration of the room with double the EOS systems in use. While this study provides only a single case investigation, findings confirming respirable aerosol concentrations by procedure and across days provided insights into patient scheduling, local exhaust ventilation selection, and operation, which could be useful to other open multi-chair dental clinics.
Introduction
At the start of the COVID-19 pandemic, dental clinics were closed except for emergency procedures, when N95 respirators and tools to screen patients for infection were limited. The early discussions from the ADA, CDC, and other advocacy groups have been replaced with web updates throughout the pandemic, but the CDC COCA presentations summarize the state of dentistry concerns during early Summer 2020 (CDC Citation2020). Since dental procedures require patients to be unmasked and since many procedures generate aerosols, understanding aerosol generation and transport were important to developing protocols to protect both the patient and workers in dental environments. The emergence of the SARS-CoV-2 (COVID-19) pandemic has forced dental care providers to evaluate their hygienic practices as dental services were put back into operations by state decrees (e.g., State of Iowa Citation2020), to reduce the chances of virus transmission between patients and dental workers. During dental procedures, the control of both the spread of splatter (particles >50 μm in diameter) and respirable aerosols (<10 μm, d50=4 µm) produced during aerosol-generating procedures (AGP) is a challenge, especially in open floor clinics with multiple chairs (Miller et al. Citation1971; Hinds Citation1999). Sources of aerosols in AGP include, but are not limited to, high-speed handpieces (HSH), air water syringes (AWS), and ultrasonic scalers (US) (Bentley et al. Citation1994; Harrel and Molinari Citation2004). Both splatter and respirable aerosols from AGP can be composed of saliva, nasopharyngeal secretions, plaque, blood, water, and other materials used in dental procedures (Harrel and Molinari Citation2004). Saliva’s role as a SARS-CoV-2 host makes control of splatter and respirable aerosols crucial in reducing virus transmission (Fini Citation2020).
Splatter particles settle quickly after being generated by AGP, due to their large size, and are almost entirely contained within operatories that have 1.5 m high divider walls in open multi-chair clinics (Holliday et al. Citation2020). Respirable aerosols created during AGP, being much smaller and lighter than splatter, can remain suspended in the air and have been reported to travel to operatories up to 11 m away from the nearest procedure (Grenier Citation1995). Since respirable aerosols may contain the SARS-CoV-2 virus, there is a great need to control these respirable aerosols in open multi-chair clinics to protect patients and staff (van Doremalen et al. Citation2020).
There are several common local ventilation control options available in dentistry for control of splatter and respirable particles including: intraoral high-volume evacuators (HVE), dental isolation adapters (DIA) such as Isovac (ISO), and extraoral suction units (EOS). The HVEs can effectively reduce the number of colony-forming units (CFU) grown on agar located around the AGP created during the procedure (Micik et al. Citation1969; Bentley et al. Citation1994). However, the use of an HVE requires that it be operated by a dental assistant. DIAs connect directly into HVEs and can be used for two-handed dentistry without a dental assistant. Use of a DIA was found to significantly reduce splatter on a simulated patient compared to an HVE during an HSH procedure (Dahlke et al. Citation2012). EOS units can offer high-volume aerosol evacuation during dental procedures while also being able to act as air purifiers throughout the day when AGPs are not being performed.
Previously cited aerosol studies in dentistry have used agar plates placed around the dental procedure to quantify the number of CFUs from splatter and settled respirable aerosols. Far fewer studies use particle counters to directly quantify respirable aerosol concentrations resulting from AGPs (Polednik Citation2014; Hong et al. Citation2015). Use of real-time optical particle counters allows an examination of concentration over time, some allowing datalogging of 1-sec (or longer) measurements to relate activity to changing concentrations, potentially providing a clearer clinical picture of respirable aerosol spread and allows for a more robust analysis of data taken over a longer duration, as AGPs can be time-stamped and correlated with the particle counters. Agar plates cannot provide this level of detail, however they can provide discrete measures of aerosols yielding information regarding potential disease transmission, where particle counters cannot identify particle composition.
This two-phase study used particle counters to record changes in respirable aerosol concentrations during procedures in a multi-chair dental clinic. Phase One of the study measured aerosol near the procedure and in adjacent operatories across four procedures and using local ventilation control devices. Phase Two measured respirable aerosols during three days at patient loading of the clinic while EOS units were on to examine whether the intensity and pattern of dental unit usage affected the average respirable aerosol concentration in an open clinic setting. The same LV control devices were used in both Phase One and Two. Our null hypothesis is that there will be no difference between the LV control devices in reducing aerosol concentrations.
Methods
This study was reviewed by the University of Iowa Humans Subjects Office, which determined it not human subjects research (IRB #202010242).
Site description
Both phases of this study contained were conducted in a large open clinic, approximately 575 m2 with 60 operatories measuring 3.0 × 2.4 m with 1.6 m high dividing walls between operatories ( and ). Distances between adjacent operatories measured from headrest center to headrest center were: 2.90 m side-to-side, 2.1 m back-to-back, and 4.2 m across the aisle. The clinic room was mechanically ventilated at six air exchanges per hour. Room air was provided through ceiling vents throughout the clinic, and air was exhausted through two return air grills in the hallway.
Figure 1. Local ventilation controls (A) High-Volume Evacuator (HVE), (B) ISOVAC Dental Isolator Adapter (ISO), and (C) Extraoral Suction Unit (EOS).
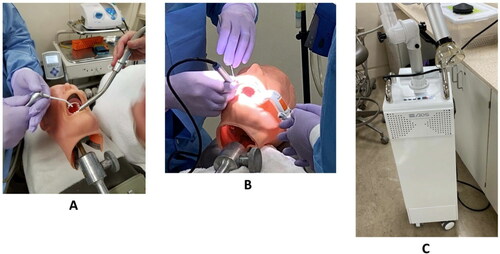
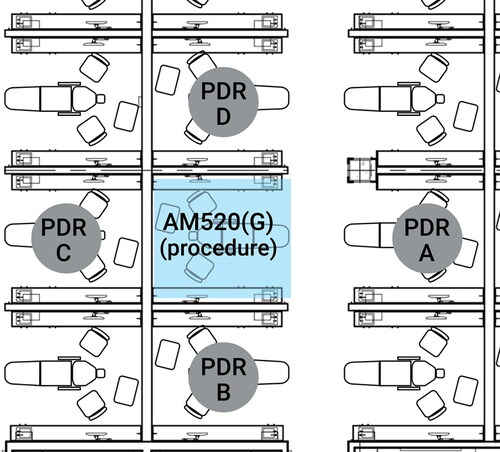
Figure 2. Room layout for Phase One, illustrating the centrally located procedure operatory (SidePak monitoring) and the neighboring four operatories (pDR monitoring).
Monitors and calibration
One SidePak AM520 (TSI Incorporated, Shoreview, MN, USA) with a respirable cyclone (10-mm Nylon Dorr-Oliver, 4 µm cut point, 1.7 LPM flowrate, TSI Incorporated) and four pDR-1500s (Thermo Scientific, Waltham, MA, USA) with a respirable cyclone (GK 2.05, 4 µm cut point, 2.65 LPM flowrate) were used to collect respirable aerosol concentrations (d50=4 µm). Respirable sampling was selected to characterize particles that may be emitted from the patient (breathing, dental procedure) and travel distances away from the source (patient mouth) to be available to potentially expose other un-masked patients in the clinic. Monitors were calibrated to zero air using HEPA filtration checks prior to sampling and used a 1-sec logging interval. To adjust readings to account for any drift in response, the pDRs were collocated pre-, midday, and post-sampling to datalog for at least 10 min, each. The response of each pDR was fitted to the mean response of all four during the collocation periods, using linear regression to find the slope and intercept of a linear regression to the mean of monitor responses. The slopes and intercepts were used to adjust each logged data point over each day, and analyses were performed using these adjusted data to ensure that differences in concentrations were real and not from sensor drift. Due to limited sample durations and COVID protocols, we did not calibrate direct reading monitor readings with filter samples, so the concentrations are used for comparisons but are not absolute reflections of respirable particle concentrations. In Phase Two, collocated adjusted aerosol concentrations during background and procedural periods were averaged for each monitor. Background-adjusted procedure concentrations were calculated by subtracting the mean background concentration (immediately before and after a given procedure period) for each of the clinic session (two sessions per day).
Study design
Phase One
One dentist performed the AGPs on a manikin typodont with prosthetic teeth (ASAN-200, Kilgore International Inc., Coldwater, MI, USA) with the aid of a dental assistant. The manikin head was in a supine position on the dental chair with the dentist sitting at the 11 o’clock position and the dental assistant in the 2 o’clock position. details the four procedures and the equipment they used (High Speed Handpiece (HSH), Air-water syringe (AWS), Ultra Sonic Scaler (US), Rubber Cup Prophy (RCP)) as well as the three ventilation controls (High-Volume Evacuators (HVE), Isovac (ISO), and Extra-oral Suction (EOS)) used in this phase. illustrates the three ventilation controls used in Phase One. Three rounds were conducted for each AGP in a single day. Each round consisted of one AGP paired with each of the ventilation options, with the AGP performed continuously for 10 min, followed by a 5-min break to change the ventilation system and allow aerosol concentrations locally to return to baseline. In each round, the LV control order with the AGP was randomized. For example, one round would be (HSH + HVE), (HSH + ISO), (HSH + EOS), (HSH + no control), taking at least 1 hr. This was repeated two more times, in a different ventilation order, to fully explore the HSH procedure. In Phase One, no other procedures were occurring in the clinic during these tests.
Table 1. Procedures and ventilation control devices evaluated in Phase One.
Phase One respirable aerosol levels within the procedure were measured in the breathing zone of the dental assistant using the SidePak. The photometer recorded respirable aerosol levels every second, which were downloaded and averaged over each 10-min task to compute the task-based time-weighted average (TWA) respirable dust concentration. At the same time, the four pDRs were placed in the center of headrests of dental chairs in adjacent operatories () to log 1-sec respirable aerosol concentrations in neighboring operatories.
Phase Two
Phase Two was designed to measure respirable aerosol concentrations throughout the clinic when two-handed dentistry practices occurred with real patients, with attention focusing on concentrations of transported particles rather than at the source. Sampling in Phase Two took place over three days during a single week. Targeted clinic occupancy was 25% on Day One, 50% on Day Two, and 100% on Day Three.
Each operatory used an EOS (VV-1000, Vector R&D Inc, University Place, WA, USA) running at the “green” power level (∼990 LPM) at all times unless an AGP was being completed and then the power level was raised to “orange” (1980 LPM) and the cone/hood of the EOS was positioned 3 inches from the patient’s mouth to achieve a 100 fpm capture velocity; see for face and capture velocity values for each LV. The change in EOS equipment from ADM (Phase One) to VV-1000 (Phase Two) was made for financial reasons. According to manufacturer specifications, both EOS models have the same maximum flow rates and similar suction power (20 kPa for VV; 23 kPa for ADS).
Dental students performed routine dental appointments and procedures on patients over approximately seven hours on each of the three study days. Appointments were representative of normal dental clinic conditions and took place in either morning (9 am–12 pm) or afternoon (1 pm–5 pm). Procedures performed included restorative dentistry procedures, periodontal/oral hygiene procedures (including ultrasonic scaling), and urgent/emergent care procedures. provides a schematic of clinic layout and occupancy during Phase Two. Students took approximately 30–45 min at the beginning of each appointment to collect health updates, review the patient’s treatment needs, and receive starting checks from faculty members. COVID precautions, including N95 respirator use, were followed by all students, faculty, and staff when in the clinic. Procedure times lasted approximately 1 to 3 hr depending on work needed. The procedures tested in Phase One (HSH, AWS, US, and RCP) represent those being used during the normal clinic operations used during Phase Two. The LV controls used for two-handed dentistry included HVE, ISO, and rubber dam in combination with the EOS. Students were allowed to use the appropriate LV controls for the dental procedures they were providing. For restorative treatment this could have included either a rubber dam or ISO, used in conjunction with an EOS. For ultrasonic scaling and rubber cup prophies, an EOS may have been the only LV control used.
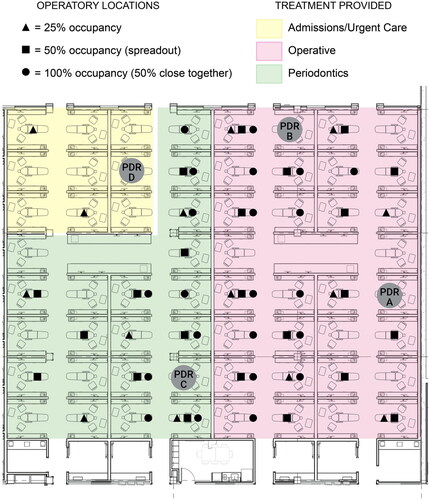
Figure 3. Clinic overview showing sampler deployment and room occupancy during Phase Two of the study.
Phase Two aerosol concentrations were measured in four dental operatories () using the same pDR monitors (A-D) as described in Phase One, which included patient consult and procedure time for each appointment. Background measurements of respirable aerosol concentrations were collected prior to patient arrival, during mid-day breaks, and after all procedures were completed.
Data analyses
Raw data were downloaded into Excel 2016 (Microsoft, Redmond, WA, USA) and processed (e.g., time-weighted averages, background, and drift adjustments). Statistical analyses used SAS V9.4 (SAS, Cary, NC, USA). Descriptive statistics for Phase One measurements compared average concentrations by procedure and ventilation type. ANOVA tests examined whether aerosol concentrations in the operatory and adjacent operatories differed based on ventilation type and procedure. In Phase Two, descriptive statistics were computed for time-weighted average background and procedure concentrations. ANOVA tests examined whether aerosol concentrations in the clinic differed between background and procedural periods. The same method determined differences between the three occupancy conditions. Tukey–Kramer post hoc analyses were used to identify where differences were significant between days or ventilation options. A significance threshold of p < 0.05 was established for all statistical tests.
Results
Phase One
Concentrations in AGP operatory
The mean respirable aerosol concentration in the procedure cubicle without using any additional LV controls (control), using the SidePak AM520 (attached to the dental assistant), was 20.0 µg/m3, averaged over all procedures. The mean AGP lasted 10.0 min (SD = 0.66 min). summarizes the time-weighted average concentrations by procedure and LV. A significant difference in concentrations was identified between the four simulated procedures (ANOVA p < 0.001; Kruskal–Wallis p < 0.001) in pairwise comparisons (95% CI = [−12.6; 4.1] to [−6.3; 10.4] µg/m3). Pairwise comparisons revealed that RCP concentrations were significantly lower than all other procedures (pairwise 95% CI ranged from [4.4; 21.0] to [8.6; 25.3] µg/m3). The post-hoc Tukey–Kramer multiple comparison test confirmed this finding.
Table 2. Concentrations, in µg/m3 using SidePak AM520, and significance test results for concentrations measured near the dental assistant during simulated procedures, for the four local exhaust methods and four dental procedures.
Aerosol concentrations within LV controls were log-normally distributed (Shapiro–Wilk p > 0.095). ANOVA testing using ln-transformed data yielded no significant difference between LV control types (mean 10.8–14.7; SD = 6.6–13.8 µg/m3) and control (mean = 20.0, SD = 14.7 µg/m3) (p = 0.510) for the breathing zone concentrations of the dental assistant.
Concentrations in operatories adjacent to AGP
Time-weighted mean respirable aerosol concentrations were computed for each procedure and intervention combination. Concentrations by dental procedure and intervention type are in . The mean respirable aerosol concentrations did not differ significantly across the four adjacent operatories (ANOVA, p = 0.945, pairwise 95% CI of concentration differences ranged from [−0.39, 0.68] to [−0.59, 0.48] µg/m3). However, the aerosol concentrations significantly differed by simulated dental procedure (ANOVA, p < 0.001). From the ANOVA analysis, the 95% CI for pairwise comparisons of concentration differences during AWS compared to HSH and US was [−0.1; 1.9] µg/m3. The 95% CI for HSH vs. US showed significantly higher differences in US [−2.2; −1.9] µg/m3 and for RCP to all other procedures showed significant differences [0.8; 1.15] to [2.9; 3.2] µg/m3. Since not every set of data were normally distributed (Shapiro-Wilk), nonparametric tests were run and confirmed the same finding (Kruskal–Wallis p < 0.001). The Tukey–Kramer post-hoc analysis indicated that while concentrations of respirable particles in neighboring units from both the HSH and AWS procedures were no different from each other (mean = 1.84 µg/m3), the RCP generated significantly lower (mean = 0.78 µg/m3) concentrations, and the US generated significantly higher (mean = 3.8 µg/m3) concentrations, regardless of the local exhaust intervention being used in the procedure unit.
Table 3. Summary of time-weighted average respirable aerosol concentration in areas adjacent to simulated dental procedures.
In these short Phase One tests, no difference in aerosol concentrations outside of the AGP operatory were found between the LV controls (ANOVA p = 0.926; pairwise 95% CI of concentration differences ranged from [−0.48, 0.59] to [−0.38, 0.69] µg/m3). This means that any of the LV controls, when positioned and operated as used in this study, helped reduce the respirable aerosol concentrations in operatories adjacent to the AGP procedure. These differences were also confirmed with nonparametric tests. The Kruskal–Wallis test identified non-significant differences between the LV controls (“no ventilation control” condition ranked sum score 108.9 vs. 91.9–93.2 for other LV options).
Phase Two
Patient care monitoring comparisons
Targeted occupancy rates for Phase Two of the study were 25% (Day One), 50% (Day Two), and 100% (Day Three). Actual occupancy rates on Day One and Day Two ended up being 22% and 33%, respectively, due to the number of patients who showed up for appointments. During Day One and Day Two, patients were distributed evenly throughout the clinic (). On Day Three, again due to a limited number of patients, 100% occupancy was simulated by repeating the 50% occupancy from Day Two, but patients were located closer together, in adjacent operatories with empty locations between patients. On Day Three, the actual simulated occupancy rate ended up being 63%. The background-adjusted morning and background-adjusted afternoon data were used as repeat samples of the same test condition.
Aerosol concentrations on each day significantly differed from other days. presents the daily average concentrations of the background (no procedures) and procedure time periods (see Supplement for time series data). A clear increase in concentration was detected over the week for both background and procedures. Tukey–Kramer post-hoc tests identified that the differences in both unadjusted and background adjusted concentrations during procedure activities differed by day. Concentrations were highest during procedures on the first day, with only 25% of the patient operatories occupied. On this day, not only were fewer patients in the clinic, but, importantly, fewer EOS units were running on the floor as well. These data may indicate that running EOS units may be helpful to minimize respirable aerosol concentrations throughout the clinic. See Supplemental Figure 1 for time series data for monitor locations (A–D) for Phase Two and occupancy levels.
Table 4. Time-weighted averages of respirable aerosol concentrations (µg/m3), by occupancy, during Phase Two sampling, using pDRs.
Discussion
Phase One results quantified the aerosol concentrations produced at the AGP operatory and adjacent operatories. US produced significantly higher respirable aerosol in adjacent operatories, and similar amounts of aerosols compared to the HSH and AWS in the AGP operatory. For aerosol concentrations in all operatories (AGP and Adjacent), RCP produced less respirable aerosols compared to all other AGPs. US producing high levels of aerosols relative to the other procedures is consistent with previous studies that did not use direct reading equipment (Miller Citation1995; Harrel and Molinari Citation2004). RCP is not currently considered an AGP by the Center of Disease Control and poses less of a risk compared to AGPs (U.S. Centers for Disease Control and Prevention 2020a). When using AGPs, the results of the current study support that one or more LV control be used to control the spread of respirable aerosols.
All ventilation options used in this study were found to be equally effective at reducing respirable aerosols in the AGP operatory or adjacent operatories. Findings from the current study suggest that both the ISO and EOS used individually are at least equal to HVE. The benefit to using ISO and EOS devices are two-fold: (1) they do not require a dental assistant to be used effectively and can be useful for times when no assistant is available, such as in a dental school setting; and (2) these self-operating devices reduce the total number of people in the dental clinic and thus could lower the chance of disease transmission between dental workers and patients.
However, in Phase Two, background adjusted procedure respirable aerosol concentrations were higher when 25% of the clinic’s operatories were in use compared to 50% operatory usage. Finding lower aerosol concentrations while more operatories were in use indicates that the operation of EOS, which were equipped with HEPA filters and exhausted in the room, contributed substantially to cleaning the air both during the AGP and in general without AGP underway. There were 13 EOS units in operation when the clinic was at 25% capacity (Day 1) and 20 when operating at 50% capacity (Day 2). Thus, a greater number of EOS units in the clinic seem to reduce ambient aerosol concentrations throughout the multi-chair clinic. This contrasts with previous studies of open floorplan clinics that found the concentration of bacteria and fungi (CFU) in the air increases significantly during dental procedures, when studies focused on larger droplets compared to the respirable particles studied here (Maghlouth et al. Citation2004; Kobza et al. Citation2018). Further research is needed to test whether the EOS units can reduce both the concentration of respirable aerosols and of microorganisms in the air, requiring the use of agar plates.
At the time of this study, there was little data on the effectiveness of EOS units at reducing respirable aerosols in open floorplan dental clinics. Hallier et al. (Citation2010) used an air cleaning system similar to an EOS unit and found that bioaerosol levels were significantly reduced when the system was in operation during some AGPs compared to baseline levels. However, the bioaerosol levels were assessed via CFUs on blood agar plates located 20 cm from the procedure location and the location of the system relative to the procedure was never stated. Drawing comparison with the current study is difficult since the range of aerosol spread being studied in each differed.
Background adjusted procedure respirable aerosol concentrations were found to be higher when patients were grouped closely together with no open operatories between them, compared to when they were spread out (Day 3 of the study vs. Day 2 configurations). Again, there was little to guide recommendations for distributing patients based on aerosol transport open dental clinics. Most studies about dental aerosols and splatter use a single patient procedure to examine the range of contamination (Micik et al. Citation1969; Bentley et al. Citation1994; Holliday et al. Citation2020). This study points to the benefit of spacing out procedures, where possible, to maximize physical distance between all parties and is consistent with the Center of Disease Control’s best practices for social distancing (U.S. Centers for Disease Control and Prevention 2020b).
One limitation of the current study was the range of aerosol concentrations being recorded in the clinics. The concentration of respirable aerosols in the clinic, during both background and procedural periods, was extremely low. The average aerosol concentrations in Phase Two of the study during procedures ranged from 0.13 to 2.62 µg/m3, and backgrounds ranged from 0.06 to 2.97 ug/m3. Operating in a relatively clean environment like a dental clinic can make photometric monitors like the pDR’s prone to error and record negative values because they are operating close to their detection limit. Additionally, spikes in the data can be caused by simply having people walk near the monitors and re-suspending settled aerosols. Another limitation is that the current study only examined respirable aerosol concentrations and did not look specifically at the spread of viral particles or other microorganisms. Further research in this area is needed.
This study demonstrated the ability of local ventilation options to reduce respirable aerosols produced from AGPs in open dental clinics. While significant reductions in aerosol concentrations were observed when using the LV controls, one must ask “what amount of reduction is clinically significant?” The greatest reduction of respirable aerosol concentrations in Phase Two of −0.61 µg/m3 below background was when 50% of the operatories were occupied and procedures were spread out while EOS were used. This supports the ability of the EOS units to keep aerosol concentrations near baseline levels while the clinic is at greater capacity, which is a desirable outcome. The goal, consistent with findings from Szymanska (Citation2007), is to reduce or eliminate the generated aerosols, thus protecting patients and providers.
Conclusions
Local control options such as HVE, ISO, and EOS units were equally as effective at preventing respirable aerosol spread during AGPs during short-term tests thus we accept our null hypothesis. The use of EOS units in addition to other LV controls were found to be beneficial to reduce respirable aerosol concentrations throughout a multi-chair open dental clinic. Aerosol concentrations were lower when procedures were spread out throughout the clinic. While this case study represents only one example of respirable particle distribution in an open multi-chair dental clinic, its findings provide a method for examining aerosol transport and general recommendations on patient spacing and impact of continuous operation of local EOS on aerosol concentration reductions in similar dental clinics.
Supplemental Material
Download PDF (376.8 KB)Data availability
Field data are available upon reasonable request to T. R. Anthony.
Additional information
Funding
References
- Bentley C, Burkhart N, Crawford J. 1994. Evaluating spatter and aerosol contamination during dental procedures. J Am Dent Assoc. 125(5):579–584. doi:10.14219/jada.archive.1994.0093
- CDC. 2020. Guidance for dental settings during the COVID-19 response, recorded June 3, 2020; [accessed 2022 Jan 26]. https://emergency.cdc.gov/coca/calls/2020/callinfo_060320.asp.
- Dahlke W, Cottam M, Herring M, Leavitt J, Ditmyer M, Walker R. 2012. Evaluation of the spatter-reduction effectiveness of two dry-field isolation techniques. J Am Dent Assoc. 143(11):1199–1204. doi:10.14219/jada.archive.2012.0064
- Fini MB. 2020. Oral saliva and COVID-19. Oral Oncol. 108:104821. doi:10.1016/j.oraloncology.2020.104821
- Grenier D. 1995. Quantitative analysis of bacterial aerosols in two different dental clinic environments. Appl Environ Microbiol. 61(8):3165–3168. doi:10.1128/aem.61.8.3165-3168.1995
- Hallier C, Williams DW, Potts AJC, Lewis MAO. 2010. A pilot study of bioaerosol reduction using an air cleaning system during dental procedures. Br Dent J. 209(8):E14. doi:10.1038/sj.bdj.2010.975
- Harrel SK, Molinari J. 2004. Aerosols and splatter in dentistry: a brief review of the literature and infection control implications. J Am Dent Assoc. 135(4):429–437. doi:10.14219/jada.archive.2004.0207
- Hinds WC. 1999. Aerosol technology: properties, behavior, and measurement of airborne particles. New York (NY): Wiley; p. 9.
- Hong Y, Huang Y, Lee I, Chiang C, Lin C, Jeng H. 2015. Assessment of volatile organic compounds and particulate matter in a dental clinic and health risks to clinic personnel. J Environ Sci Health A Tox Hazard Subst Environ Eng. 50(12):1205–1214. doi:10.1080/10934529.2015.1055129
- Holliday R, Allison J, Currie C, Edwards DC, Bowes C, Pickering K, Reay S, Durham J, Lumb J, Rostami N, et al. 2020. Evaluating dental aerosol and splatter in an open plan clinic environment: implications for the COVID-19 pandemic. J Dent. 105:103565. doi:10.31219/osf.io/md49f
- Kobza J, Pastuszka JS, Bragoszewska E. 2018. Do exposures to aerosols pose a risk to dental professionals? Occup Med (Lond). 68(7):454–458. doi:10.1093/occmed/kqy095
- Maghlouth A, Yousef Y, Bagieh N. 2004. Qualitative and quantitative analysis of bacterial aerosols. J Contemp Dent Pract. 5(4):91–100. doi:10.5005/jcdp-5-4-91
- Micik RE, Miller RL, Mazzarella MA, Ryge G. 1969. Studies on dental aerobiology. I. Bacterial aerosols generated during dental procedures. J Dent Res. 48(1):49–56. doi:10.1177/00220345690480012401
- Miller RL. 1995. Characteristics of blood-containing aerosols generated by common powered dental instruments. Am Ind Hyg Assoc J. 56(7):670–676. doi:10.1080/15428119591016683
- Miller RL, Micik RE, Abel C, Ryge G. 1971. Studies on dental aerobiology. II. Microbial splatter discharged from the oral cavity of dental patients. J Dent Res. 50(3):621–625. doi:10.1177/00220345710500031701
- Polednik B. 2014. Aerosol and bioaerosol particles in a dental office. Environ Res. 134:405–409. doi:10.1016/j.envres.2014.06.027
- State of Iowa. 2020. Executive Department, Proclamation of Disaster Emergency, May 6; [accessed 2022 Jan 26]. https://governor.iowa.gov/sites/default/files/documents/Proclamation%20of%20Disaster%20Emergency%20-%202020.05.06.pdf?utm_medium=email&utm_source=govdelivery.
- Szymanska J. 2007. Dental bioaerosol as an occupational hazard in a dentist’s workplace. Ann Agric Environ Med. 14(2):203–207.
- U.S. Centers for Disease Control and Prevention. 2020a. Coronavirus Disease 2019 (COVID-19); [accessed 2020 Oct 14]. https://www.cdc.gov/coronavirus/2019-ncov/hcp/dental-settings.html.
- U.S. Centers for Disease Control and Prevention. 2020b. Coronavirus Disease 2019. (COVID-19)—prevention & treatment; [accessed 2020 Sep 25]. https://www.cdc.gov/coronavirus/2019-ncov/prevent-getting-sick/prevention.html.
- van Doremalen N, Bushmaker T, Morris DH, Holbrook MG, Gamble A, Williamson BN, Tamin A, Harcourt JL, Thornburg NJ, Gerber SI, et al. 2020. Aerosol and surface stability of SARS-CoV-2 as compared with SARS-CoV-1. N Engl J Med. 382(16):1564–1567. doi:10.1056/nejmc2004973