
 ?Mathematical formulae have been encoded as MathML and are displayed in this HTML version using MathJax in order to improve their display. Uncheck the box to turn MathJax off. This feature requires Javascript. Click on a formula to zoom.
Abstract
The particle filtration efficiency (PFE) of a respirator or face mask is one of its key properties. While the physics of particle filtration results in the PFE being size-dependent, measurement standards are specified using a single, integrated PFE, for simplicity. This integrated PFE is commonly defined concerning either the number (NPFE) or mass (MPFE) distribution of particles as a function of size. This relationship is non-trivial; it is influenced by both the shape of the particle distribution and the fact that multiple practical definitions of particle size are used. This manuscript discusses the relationship between NPFE and MPFE in detail, providing a guide to practitioners. Our discussion begins with a description of the theory underlying different variants of PFE. We then present experimental results for a database of size-resolved PFE (SPFE) measurements for several thousand candidate respirators and filter media, including filter media with systematically varied properties and commercial samples that span 20%–99.8% MPFE. The observed relationships between NPFE and MPFE are discussed in terms of the most-penetrating particle size (MPPS) and charge state of the media. For the sodium chloride particles used here, we observed that the MPFE was greater than NPFE for charged materials and vice versa for uncharged materials. This relationship is observed because a shift from NPFE to MPFE weights the distribution toward larger sizes, while charged materials shift the MPPS to smaller sizes. Results are validated by comparing the output of a pair of automated filter testers, which are used in gauging standards compliance, to that of MPFE computed from a system capable of measuring SPFE over the 20 nm–500 nm range.
Introduction
Respirators, face masks, and face coverings are critical to curbing respiratory disease transmission and providing personal protection against many forms of harmful aerosols, such as smoke, dust, and other pathogens. Their utility has been highlighted by the ongoing COVID-19 pandemic, where masks have significant utility as part of larger mitigation strategies (Hendrix Citation2020; Lyu and Wehby Citation2020; Stutt et al. Citation2020; Abboah-Offei et al. Citation2021; Bazant and Bush Citation2021; Gettings et al. Citation2021). The pandemic has also renewed interest in assessing the effectiveness of masks, including extensive consideration of common materials for use by the general public (Zangmeister et al. Citation2020; Zhao et al. Citation2020; Bagheri et al. Citation2021; Radney et al. Citation2021; Rogak et al. Citation2021; Zangmeister et al. Citation2021); the reuse of high performing masks (Lu et al. Citation2020; Ma et al. Citation2020; Rubio-Romero et al. Citation2020); the environmental impact of discarded masks (Fadare and Okoffo Citation2020; Dharmaraj et al. Citation2021; Hartanto and Mayasari Citation2021); and the testing methods and standards associated with various types of masks (Rengasamy et al. Citation2017; Corbin et al. Citation2021; LaRue et al. Citation2021; Zoller et al. Citation2021).
This study is concerned with the material properties of candidate respirators or reference filtration media, chiefly the particle filtration efficiency (PFE), rather than consideration of fit. While fit is a very significant factor in mask performance (Rengasamy and Eimer Citation2011; Lei et al. Citation2013; Grima-Olmedo et al. Citation2014; Duncan et al. Citation2021), it is also challenging to measure effectively for the general populace. This is due, in part at least, to differences in the shape and features of individual faces and complex testing procedures (e.g., that require physical modifications to the mask, as in the OSHA test method (OSHA Citation2004), and a bivariate panel of volunteers). The accuracy of quantitative fit testing relies on how representative the test subjects are of the populace. Qualitative measures are often used as a practical alternative. Further, the upper limit of effectiveness is governed by the material properties, requiring that standards continue to address material PFE testing in addition to fit.
There are different variants of PFE. The NIOSH TEB-APR-STP-0059 test method (NIOSH Citation2007), used for the certification of N95 respirators and hereafter referred to as the NIOSH N95 test method, uses the ratio (downstream/upstream of the mask) of light scattering measured from the aerosol to determine PFE. In doing so, this test method inherently targets scattering-based filtration efficiency, which is considered roughly proportional to mass-based filtration efficiency (MPFE). Thus, while commercial instruments available to gauge mask compliance (including the TSI 8130A, which features prominently in North America due to it being explicitly identified in the NIOSH N95 test method, paragraph 3.1.1, and is used as a surrogate for commercial instruments in this work; ATI 100X; Gester GT-RA09; and Palas PMFT 1000) measure total light scattering from aerosol particles, these measurements must be correlated to an MPFE via calibration against gravimetric filter mass. These instruments can also be used in conjunction with other international standards that have similar requirements (Corbin et al. Citation2021). By contrast, the ASTM F2299/F2100 test method, which employs polystyrene latex (PSL) spheres, and methods based on the PortaCount (e.g., Rengasamy et al. Citation2012) measure particle counts and thereby target count- or number-based filtration efficiencies (NPFE). Academic/research studies often use systems composed of size-resolved particle counting instruments, such as scanning mobility particle sizers (SMPSs) (Li et al. Citation2012; Tang et al. Citation2018; Lu et al. Citation2020; Zangmeister et al. Citation2020; Corbin et al. Citation2021) and optical particle sizers (OPSs) (Tang et al. Citation2018; Rogak et al. Citation2021; Bement et al. Citation2022). The counting nature of these sizing instruments is well suited to compute NPFE. However, the instruments also provide information on the size-resolved PFE (SPFE), which can be used to convert between NPFE and MPFE. Further, relating these two quantities is non-trivial, and the extent of the differences will depend on the size distribution, the shape of the SPFE curve (i.e., the relationship between SPFE and particle size), and the most penetrating particle size (MPPS). While noted as important (Zoller et al. Citation2021), this relationship has not seen much dedicated, experimental study, particularly across such a wide range of samples and into the sub-90% MPFE range.
Within this work, we investigate the differences between these various quantities. We start by providing a detailed, theoretical discussion of particle size and the principles differentiating NPFE and MPFE. We then consider a research system—the Particle Filtration Efficiency Measurement System (PFEMS) (Smallwood et al. Citation2020; Corbin et al. Citation2021), composed of condensation particle counters and SMPSs—and report on measurements taken over more than a year, spanning a wide range of respirators and filtration media consisting of several thousand samples. We compute both NPFE and MPFE for this data and examine the relationship between the two quantities across the full range of samples. Of the materials tested, we also include a set of candidate reference filter media composed of melt-blown polypropylene where the charge state and basis weight are controlled. This allows for qualitative statements about the effect of the most common parameters that are adjusted in mask construction and their relation to the NPFE and MPFE. Overall, differences between NPFE and MPFE depend significantly on the charge state of the material. Finally, we compare the mass-based outputs from the size-resolved system to the output of two TSI 8130As, to assess the equivalence of these two characterization methods.
Background
A single aerosol size distribution can be described in different ways (Hinds Citation1999b). This has confused the discussion of particle filtration efficiency (PFE) in the literature, with inconsistent reporting in some cases, which has reduced the utility of comparisons across studies. Aerosol particle size is a complex topic, for two reasons. First, particle transport in a gas is described by different equivalent sizes, depending on the context. Second, particles are often measured or described by reference to all particle sizes present in a given sample “distribution.” These two points are expanded upon in the following sections.
Metrics for particle size
Particle filtration is achieved through mechanical—including diffusion, impaction, and interception—and electrostatic mechanisms (Hinds Citation1999a; Tcharkhtchi et al. Citation2021). The mechanical mechanisms depend largely upon the particle’s aerodynamic size (a function of volume, shape, and density) and face velocity, as well as fiber size (related to basis weight). By contrast, the electrostatic mechanism is almost solely dependent on the charge state of the filtration media (e.g., high-performance melt-blown polypropylene materials are electrets, which enables them to typically achieve high filtration and low pressure drop). These different mechanisms, in combination with available instruments, have motivated making measurements concerning different metrics for particle sizes.
In the context of electrostatic capture by filters, particles behave according to their equivalent mobility diameter, dm (technically concerning their electrical mobility, with the mobility diameter being a surrogate in length units). The mobility diameter depends on the aerodynamic drag between the particle and the gas (DeCarlo et al. Citation2004). Mobility diameter distributions are measured by the SMPSs within the PFEMS system used in this study (Corbin et al. Citation2021) and many others, e.g., Bałazy et al. Citation2006; Lu et al. Citation2020; Zangmeister et al. Citation2020; Hao et al. Citation2021). The mobility diameter is often similar to the volume-equivalent diameter (it is larger by a factor that depends on the additional drag experienced by aspherical particles (Hinds Citation1999b; DeCarlo et al. Citation2004), see EquationEquation (2)(2)
(2) for reference) and is a physical measure of diameter related to diffusion.
In the context of inertial motion or terminal velocity, as is relevant to the impaction and interception mechanisms, particles behave according to aerodynamic diameter. The aerodynamic diameter depends on the particle density and, inversely, on the aerodynamic drag. The precise relationship is given by DeCarlo et al. (Citation2004). Some instruments, which make measurements using inertial techniques (e.g., impactors), provide size distributions directly in terms of aerodynamic diameter. It can also be measured by accelerating particles to their terminal velocity and either measuring their velocity directly, as in laser-based aerodynamic particle sizers (TSI APS 3321) and various mass spectrometers (Pratt and Prather Citation2012), or by separating particles according to their time-of-flight, as in the Aerodynamic Aerosol Classifier (Issman et al. Citation2021; Payne et al. Citation2021) or Aerosizer (Qian et al. Citation1998). Larger, heavier particles are captured by filters and the human respiratory system according to their aerodynamic diameters (Kulkarni et al. Citation2011). The conversion from mobility to aerodynamic diameter is given by (Hinds Citation1999b; DeCarlo et al. Citation2004),
(1)
(1)
where
(2)
(2)
is the volume-equivalent diameter, Cc denotes the Cunningham slip correction, χ is the dynamic shape factor, and ρeff and ρ0 = 1,000 kg/m3 are the effective density of the particle and the density of water. We note that respiratory particles often have densities similar to water and thus have similar aerodynamic and mobility diameters. The same does not hold for sodium chloride, which is much denser than water, such that aerodynamic diameters s are often double the mobility diameter for the same particle.
Particle size distributions and distribution moments
A population of particles may be described in terms of its number and mass concentrations, among other properties (e.g., the amount of light-scattering). More commonly, these same properties may be divided into contributions from bins of different sizes, resulting in particle size distribution. For example, a mass distribution maps out how particles of different sizes contribute to the mass concentration in the aerosol. In aerosol science, distributions are typically denoted using a differential, with the number of particles (e.g., count, mass, scattering intensity) in the numerator and a measure of the particle size in the denominator. For example, dN/dlogdm is used to denote the number distribution resolved with respect to mobility diameter. The distribution for the same population of particles changes depending on the chosen parameters.
In the case of the numerator, the contribution of larger particles to the overall number concentration is much smaller than the contribution of those particles to the overall mass concentration. Consequently, mass distributions (e.g., dM/dlogdm) typically peak at larger sizes than number-based distributions for the same aerosol. Scattering distributions often weigh larger particles even more heavily, resulting in a peak at larger sizes yet (see ). We also note that the dN/dlnm (where m is the single-particle mass) and dM/dlnd distributions are not the same, the former being the number distribution resolved concerning single-particle mass (as measured using a particle mass analyzer, e.g., Payne et al. (Citation2021)) and the latter being the mass distribution resolved relative to some particle diameter. In terms of defining different kinds of PFE in a later section, we consider the conversion from dN/dlnd to dM/dlnd.
Figure 1. Schematic demonstrating the different particle sizes and types of size distributions for the same population of sodium chloride particles, assumed spherical with dg = 75 nm and σg = 1.86 (with respect to mobility diameter, i.e., the upper limit in the NIOSH TEB-APR-STP-0059 test method). Count and mass distributions are lognormal, such that they appear normal on the logarithmic scale here. The second horizontal axis shows the equivalent values for aerodynamic diameter (e.g., a mobility diameter particle of 75 nm has an aerodynamic diameter of 137 nm), which involves a transformation of the horizontal axis. The aerodynamic diameter is determined from the mobility diameter by solving EquationEquations (1)(1)
(1) and Equation(2)
(2)
(2) iteratively, assuming the dynamic shape factor is unity, χ = 1. The geometric standard deviation (GSD) is specific to the chosen metric for particle size (i.e., differs for distributions defined with respect to the mobility and aerodynamic diameters), but will be the same for the count- and mass-distributions, provided a power law relationship, EquationEquation (3)
(3)
(3) , holds. For the same CMD, wider distributions will result in a larger MMD and MMAD. Also shown is the scattering-weighted distribution for spherical NaCl particles at a forward scattering angle of 45° and a wavelength of λ = 532 nm, as computed using Mie theory (Mätzler Citation2002). The nonlinear nature of the model causes deviations from the lognormal shape of the other two distributions.
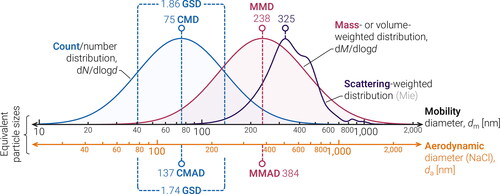
Size distributions are often specified using a range of distribution moments, including the count median mobility diameter (CMD) for number distributions and mass median mobility diameter (MMD) for mass distributions (the median of a lognormal distribution is equivalent to the geometric mean diameter (GMD)). The distribution moments can themselves be in terms of different particle size metrics (when the denominator of the distribution is changed). For instance, the CMD and MMD also be expressed as aerodynamic diameters, resulting in the count median aerodynamic diameter (CMAD) and mass median aerodynamic diameter (MMAD), respectively, using the conversions in the preceding section. Similar statements hold for the geometric standard deviation (GSD), which is specific to a distribution of a given metric for particle size. Thus, while changing the denominator only influences the value of the distribution by way of bin widths, a change in the metric used for particle size has implicit effects: changing the GMD and GSD in addition to the bin edges or values.
In the context of this work, we note that the scaling of single-particle mass with diameter can typically be formulated using a power law concerning diameter
(3)
(3)
where d is some particle size, ζ is a power applied to the count-based diameter to achieve the desired output, and k is a pre-factor. When d is the mobility diameter, d = dm, this expression is called the mass-mobility relation, and ζ typically ranges from 2 to 3 (ζ = 2.97 for sodium chloride, see the Supplemental Information). For the mass of spheres, ζ = 3 and k = πρ/6, where ρ is the particle’s material density. When d is the volume-equivalent diameter, d = dve, ζ = 3, and k = πρeff/6, by definition. When d is the aerodynamic diameter, d = dae, and the relationship is similar to that for mobility diameter, with k adjusted based on the particle density (the Cunningham slip correction contributions cause further deviations).
This has implications for the distribution moments. For EquationEquation (3)(3)
(3) and lognormal distributions, the mass median (e.g., MMD and MMAD) is related to the count median (e.g., CMD and CMAD, respectively) by the Hatch-Choate relation (Heintzenberg Citation1994; Hinds Citation1999b), which we generalize here in terms of ζ,
(4)
(4)
where dg is the count median, dζ is the corresponding mass median, and σg is the GSD, all concerning the chosen particle size d. Our generalization of the Hatch–Choate relation from its traditional representation of distribution moments (ζ = 1, 2, 3) to fractal scaling exponents (0 < ζ < 3) allows EquationEquation (4)
(4)
(4) to be used in more contexts, such as with agglomerated particles. Note that the mass median does not depend on the pre-factor (i.e., is independent of the particle density) but does depend on the distribution width. For infinitesimally narrow distributions, σg = 1 (i.e., the target of testing with PSL particles), the count median and mass median diameters are identical, an indication that the number and mass distributions are also identical. Note that, provided the mass is related to the diameter via a power law, it can be shown that the number and mass distribution widths are identical, only differing in terms of the center of the distribution.
demonstrates the equivalences of these properties for sodium chloride with a CMD of dg = 75 nm and σg = 1.86 (concerning mobility diameter, which is typical of these measurements and close to the upper limit of the NIOSH N95 test method). Changes to the denominator (e.g., changing from mobility to aerodynamic diameter) alter the values on the x-axis, which, in turn, results in a different GMD and GSD. Changes to the numerator shift the distribution (on either x-axis), a consequence of reweighting the importance of the particle contributions to a given total. In contrast, polystyrene latex (PSL) spheres are theoretically monodisperse (σg = 1.0) and have densities approximately equivalent to that of water, such that the CMD, MMD, CMAD, and MMAD are all identical (around 100 nm for the ASTM F2299/F2100 test method).
Different variants of particle filtration efficiency
Based on these concepts, we distinguish between three different variants of particle filtration efficiency (PFE): size-resolved filtration efficiency (SPFE), number-based filtration efficiency (NPFE), and mass-based filtration efficiency (MPFE).
The SPFE is the filtration efficiency for a specific size, which can be combined to map out a filtration efficiency curve. Measurement requires a pair of size-resolved measurements. Then, the size-resolved penetration, Pi, and SPFE, ηi, at the ith particle size, di, are computed by
(5)
(5)
where N(up,i) and N(down,i) are the number concentrations upstream and downstream of the respirator at standard temperature and pressure, respectively. (This quantity may need to be corrected for additional losses between the upstream and downstream detectors, as necessary.)
The NPFE, by contrast, corresponds to a total number of particles captured by the filter. As such, the NPFE has a single value for a given filtration media and a specific challenge aerosol. This can be realized in one of two ways. First, one can integrate the size-resolved upstream and downstream number distributions, that is computing the total upstream particle concentration as
(6)
(6)
where l is the number of size bins, with an analogous expression downstream. Note that d can be any measure of particle size, so long as the distribution is integrated concerning the diameter in the denominator, and the output should be identical, provided the underlying size distribution is the same. (For the sodium chloride challenge aerosol specified in the NIOSH N95 test method, a distribution with a CMD of 75 nm and a GSD of 1.86 for mobility diameter would have a CMAD of 137 nm and a corresponding GSD of 1.74 for aerodynamic diameter, as demonstrated in .) Then, analogous to EquationEquation (5)
(5)
(5) but using total particle concentration measurements,
(7)
(7)
where the “n” subscript is used to denote number-based quantities. Alternatively, to avoid the losses and limited particle-size range associated with many size classifiers, one can measure the total number concentrations using an instrument that directly integrates the number distribution—for example using a pair of CPCs, as is available in the PFEMS—and compute the NPFE directly without the need to integrate as a post-processing step.
The MPFE, which is necessary as the most direct comparison to the TSI 8130A system output, is analogous to the NPFE but prescribes the mass of aerosol captured by a filter. As such, the MPFE corresponds to averaging over the mass distribution instead of the number distribution. Specifically,
(8)
(8)
where
(9)
(9)
and an analogous expression downstream. The latter form uses the power law from EquationEquation (3)
(3)
(3) . Like the NPFE, the MPFE has a single value for a given filtration media and challenge aerosol. There are multiple ways to convert between NPFE and MPFE (Corbin et al. Citation2021; Sipkens et al. Submitted). For instance, one can numerically integrate EquationEquation (9)
(9)
(9) directly, e.g., Zoller et al. (Citation2021). Here, MPFE for the PFEMS is instead computed using a variant of Hatch–Choate analysis in conjunction with EquationEquation (3)
(3)
(3) . In this case, the upstream and downstream distributions are assumed to be lognormal, and the overall mass concentration of particulate is given by (Sipkens et al. Submitted)
(10)
(10)
where dg,up and σg,up are the upstream GMD and GSD, each given by an instance of EquationEquation (4)
(4)
(4) . (Relative to EquationEquation (4)
(4)
(4) , the output of EquationEquation (10)
(10)
(10) defines an integrated quantity instead of a distribution moment.) Using ζ = 3, k = πρ/6, and
(11)
(11)
where ρ is taken here as the density of sodium chloride (2,160 kg/m3). An analogous conversion applies downstream. Then,
(12)
(12)
Note that, since k contributes identically for Mup and Mdown, the mass-based penetration and filtration efficiency are independent of k (and thus, for spheres, are independent of the particle density). Here, (dg,up, σg,up) and (dg,down, σg,down) are computed from the upstream and downstream number distributions, respectively, via their statistical definitions (Hinds Citation1999b), that is
(13)
(13)
(14)
(14)
and the corresponding expressions for the downstream quantities. This analysis is expected to be valid when the input particle size distribution and size-resolved penetration curve are approximately lognormal. One can also correct for ζ ≠ 3 in post-processing, provided that the distribution widths are available (see the Supplemental Information). For sodium chloride, effective densities are nearly constant with particle size (ζ = 2.97) for the sizes considered here (Zieger et al. Citation2017), with small changes inducing errors in the mass-based penetration of less than 3% for the samples in this study (which are largest for the smallest penetrations). The effective densities are plotted in the Supplemental Information.
Overall, converting from NPFE to MPFE effectively changes the reported PFE from a measurement at 75 nm mobility diameter to a measurement around 211 and 238 nm mobility diameter (or 344 and 384 nm MMAD) for σg = 1.8 (more typical value) and 1.86, respectively. This occurs because the distribution is reweighted toward larger particle sizes for mass-based distributions relative to number-based.
One can also define a range of other PFEs, by weighting with different distributions. For example, one can define a scattering-based PFE, such as that defined by Biermann and Bergman (Citation1988). This involves integrating over the size-dependent scattering kernel. In the Rayleigh limit (which requires small particles relative to the wavelength of light), this reweights the particles by d6 (Bohren and Huffman Citation2008; Moosmüller and Arnott Citation2009), further shifting consideration to larger particles than MPFE. The shift to larger particles also makes the Rayleigh approximation less viable (instead resulting in the weighting in ), but the effect is the same: larger particles contribute more to the upstream and downstream signals. Photometers, including those in the TSI 8130A, technically measure scattering-based PFE. However, in practice, the response of the photometers is calibrated against external mass measurements, such that instruments like the TSI 8130A effectively report MPFE.
The distributions in correspond to that specified in the NIOSH N95 test method. One could also weigh by the size distribution for a specific use case, such as targeting a specific kind of bioaerosol, requiring information on the SPFE and an update to the accompanying integration step.
Theoretical results for the NPFE to MPFE conversion
The preceding statements allow for some theoretical discussion of the conversion from NPFE to MPFE (discussed only briefly elsewhere, e.g., Qian et al. Citation1998), which is demonstrated schematically in . Universally, mass-based distributions are centered on a larger size than number-based distributions. Now, also consider penetration curves centered on a most penetrating particle size (MPPS). When the MPPS is smaller than the CMD (), more particles penetrate the filtration media around the center of the number-based distribution, which translates to MPFE > NPFE. Conversely, if the MPPS is larger than the MMD (), more large particles pass through the filtration media, coinciding better with the center of the mass-based distribution, thus NPFE > MPFE. For the intermediate range (not shown in ), where the MPPS is between the CMD and MMD, there is a transition between these two conditions, with NPFE = MPFE when the MPPS is around the midpoint between CMD and MMD.
Figure 2. Three scenarios comparing NPFE and MPFE relative to the underlying size-resolved penetration, Pi, curves. The number- (Pn) and mass-based (Pm) penetrations result from integrating the product of the corresponding distribution and the size-resolved penetration curve, corresponding to the blue and red shaded regions, respectively. A size-independent penetration (a) results in NPFE = MPFE (the blue- and red-shaded regions are identical), while size-resolved Pi (b and c) can yield differences between NPFE and MPFE.
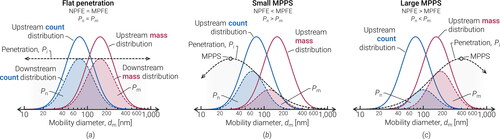
The magnitude of the difference between the NPFE and MPFE depends on quantities other than MPPS, such as the size dependence of the penetration curve and the challenge aerosol size distribution width. Generally, strongly size-dependent filtration media (size-dependent penetrations) will result in larger differences between the NPFE and MPFE (), while media with flat (size-independent) penetrations across the distribution width will yield nearly identical NPFE and MPFE (). Similarly, if the particle size distributions are narrow, number and mass distributions become nearly coincident, requiring a very strong size-dependent penetration to result in a difference between the NPFE and MPFE (culminating in NPFE and MPFE necessarily being the same for monodisperse particles).
Experimental details
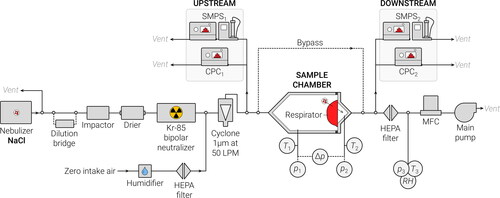
PFEMS (number-based, size-resolved)
shows a schematic of the number-based PFEMS (Smallwood et al. Citation2020) at the National Research Council Canada. Due to the range of dates associated with this data (extending over a year and a half), some instruments were exchanged throughout these measurements, depending on availability. Despite this, the overall function remained constant, with comparison to a reference respirator showing consistency across the changes. The PFEMS contains an upstream nebulizer (TSI Collison 3076) used to generate a sodium chloride aerosol approximating that specified for the NIOSH N95 test method, typically with a CMD of dg,up ∼ 75 nm and a geometric standard deviation (GSD) that varied between σg,up ∼ 1.65 and 1.85 (earlier experiments excluded the impactor, resulting in GSDs closer to the upper end of this range). The challenge aerosol is dried with a counterflow membrane dryer (PermaPure MD-700-48S-3) and passed through an impactor to remove large particles, then a bipolar 85Kr neutralizer, before being mixed with dilution air and passing through a sample chamber containing a respirator or filtration media. (Some of the data presented for candidate N95 respirators was taken without the dryer.) A pair of scanning mobility particle sizers (SMPSs; composed of a subset of TSI model 3080, 3082, 3750, and 3752 differential mobility analyzers) and a pair of concentration particle counters (CPCs; composed of a subset of TSI models 3025A, 3082, 3776, and 3788), which were used to measure total number concentrations without size classification, are placed before and after the sample, chamber to make measurements of the aerosol concentration upstream and downstream of the filters, respectively. Data was inverted using the instrument’s built-in software to correct for multiple charging and diffusion effects.
Figure 3. Schematic of the PFEMS system, composed of a pair of SMPSs and a pair of CPCs. The p, T, and RH circles refer to pressure, temperature, and relative humidity sensors. Pressure sensors p1 and p2 were replaced by a differential pressure sensor, measuring Δp directly, prior to measuring the candidate reference materials.
The PFEMS measurements are used to compute SPFE curves over the 20 nm–500 nm range (e.g., Figure 5 or Figure 2 in Corbin et al. (Citation2021)), NPFE, and MPFE. We report NPFE values from the PFEMS using EquationEquation (7)(7)
(7) , based on CPC data. NPFE from integrated SMPS measurements (from a combination of EquationEquations (6)
(6)
(6) and Equation(7)
(7)
(7) ) were consistent with the CPC results across the whole range of observed values (different by 1.2% of Pn on average). We converted the PFEMS NPFE to MPFE using EquationEquation (12)
(12)
(12) , with size distribution statistics (dg,up, dg,down, σg,up, and σg,down) computed from the SMPS data and Pn computed from the CPC data.
Uncertainties for the PFEMS follow from linear error propagation (Corbin et al. Citation2021; Sipkens et al. Submitted). For SPFE, this establishes that uncertainties rapidly expand in the tails of the challenge aerosol’s particle size distribution. Overall, upstream number concentrations measured by the CPC are typically on the order of 5 × 10⁴ counts, theoretically allowing measurements of NPFE up to 99.99% (before two standard deviations exceed 100% of the penetration). For NPFE and MPFE, since the input number concentrations are relatively constant at this value, uncertainties in the penetration generally scale with the penetration itself and are thus uniform on a log-penetration scale. Typically, samples were tested for 5 min, averaging the measured quantities over this period, and resulting in total loading on the order of 0.01 to 0.3 mg, depending on the NPFE and the upstream aerosol properties (in particular, the GSD and number concentration). Such loadings are well below that specified in the NIOSH N95 test method.
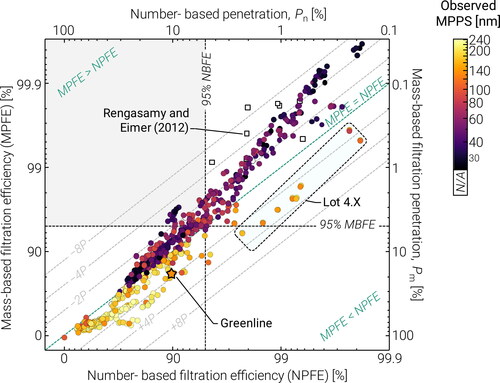
Filtration efficiencies are complemented by efforts to compute the most-penetrating particle size (MPPS) for each sample, computed from the measured SPFE curve and shown as a point color in . We estimate the MPPS using a probabilistic approach described in the Supplemental Information. Simulations employing a lognormal input challenge aerosol and lognormal penetration curve show that this method can predict the true MPPS within the stated uncertainties. Note that the MPPS was not always well-resolved. For example, in some instances, the SPFE curve steadily declines over the entire observable range, such that the MPPS is at the edge of the distribution where uncertainties mask any ability to resolve the MPPS beyond the edge of the distribution. These points are denoted as such in subsequent figures (e.g., white-filled circles in ).
Figure 4. Mapping the relationship between NPFE and MPFE for PFEMS data taken on a wide range of filtration media and candidate N95 respirators; colors correspond to the observed most-penetrating particle size (MPPS). White-filled circles indicate cases where estimates of the MPPS failed or were considered outside of a valid range. The challenge aerosol is sodium chloride with an approximate CMD of 75 nm and GSD between 1.65 and 1.86. Both the horizontal and vertical scales are logarithmic with respect to penetration. Faint, dashed lines correspond to multiples of the penetration (e.g., +8P, corresponds to when the penetration with respect to mass is eight times higher than the number-based quantity). Lot 4.X was a lot of particularly high pressure drop and basis weight filter media (dashed rectangle). Shaded region in the upper-left corner corresponds to materials that have 95% MPFE (would pass by the corresponding test method), but not 95% NPFE. Open squares are historical data from Rengasamy and Eimer (Citation2012) for a set of candidate N95, N99, and N100 respirators, with NPFE from a pair of CPCs and MPFE from a TSI 8130.
TSI 8130A
The TSI 8130A employs upstream and downstream photometers to determine PFE. The photometers measure light scattering from the particles (see , the surrounding discussion, and Biermann and Bergman (Citation1988)), which can be correlated to the overall mass concentration (Görner et al. Citation1995), which, in this case, is determined empirically using a comparison to gravimetric measurements. In effect, the instrument actually measures a scattering-based filtration efficiency, which is correlated with the MPFE. In practice, users are not presented with scattering information but with MPFE reported by the instrument’s embedded software based on the manufacturer’s calibration. We report these values without modification, and compare them with the equivalent MPFE computed from the PFEMS. We report uncertainties in the TSI 8130A outputs from repeated measurements over time; standard filters, when available; or differences between two TSI 8130As, which we hereafter denote as TSI-1 and TSI-2 (see the Supplemental Information for a comparison). Data reported here correspond to initial filtration efficiency, that is, the filtration after 1 min of loading. Even these loadings are higher than that observed in the PFEMS system, which may result in differences between the measurements depending on the type of material (Barrett and Rousseau Citation1998). For the mass concentrations employed in this study, this resulted in an average minimum loading of 1.5 mg of sodium chloride for a volumetric flow of 85 liters per minute (lpm). For higher MPFE, the filters will collect more particles and the initial loading will be larger, and vice versa.
Figure S1 in the Supplemental Information compares the MPFE computed from the two TSI 8130A instruments. In the vast majority of cases, TSI-1 and TSI-2 agree within 25% of Pm. Note that, since these plots are logarithmic concerning penetration, the results indicate that the MPFE are in better absolute agreement for higher performing filtration media, consistent with expected trends (Sipkens et al. Submitted). Penetration measured by TSI-2 was 7% higher than TSI-1 on average, with a standard deviation in the difference between the penetrations of 15%.
Results
Measurements were made with the PFEMS and TSI 8130A systems across a range of materials. Data were roughly divided into three sets: (i) a range of N95 candidate respirators and filtration media for which the underlying material properties are not known but that encompass more than 500 samples spanning 20%–99.8% NPFE; (ii) a subset of N95 candidate respirators from the previous category, for which dedicated measurements were made on both the PFEMS and a TSI 8130A for the same lots; and (iii) a set of candidate reference materials composed of melt-blown polypropylene manufactured by Roswell Downhole Technologies that were controlled concerning their basis weight (the mass per unit area of the material, typically expressed in g/m2 or GSM) and degree of charging (by subjecting the material to electric fields of different voltages). The final category allows for some investigation of qualitative trends in PFE as a function of the underlying material parameters. Our measurements also include both as-received (unconditioned) and environmentally conditioned (85% ± 5% RH, 38 °C ± 2.5 °C for 25 hr ± 1 hr) samples. We refer the reader to Corbin et al. (Citation2021) for a discussion of a subset of this data within that context, as well as a discussion of differences between the NIOSH N95 and ASTM F2299/F2100 test methods.
PFEMS number-to-mass conversion
shows the relationship between NPFE and MPFE for experimental data across roughly 800 samples, with points colored based on the observed MPPS. Note that the horizontal and vertical scales are logarithmic concerning penetration but reversed such that filtration efficiency increases toward the upper-right corner. This scale was chosen for multiple reasons, including that it better reflects trends in uncertainties, which are roughly proportional to the penetration for much of the domain (Sipkens et al. Submitted); that it better distributes the data across the plot area, which are clustered at high filtration efficiencies; and that it maintains an increasing filtration efficiency in moving toward the top-right. Four observations are evident in .
First, there are many instances in which NPFE does not equal MPFE. This is indicative of significant variations in the SPFE curve, resulting from the fact that a size-independent SPFE curve would necessarily yield NPFE = MPFE, as demonstrated schematically in . Note that NPFE = MPFE can also be achieved when the SPFE curve has a MPPS between the CMD and MMD, such that the opposite (that is the SPFE curve is necessarily flat when NPFE = MPFE) does not hold. This observation matches the inspection of the SPFE curves, with curves qualitative similar to trends in total filtration efficiency models (Hinds Citation1999a).
Second, and related to the former, the MPPS has a significant impact on the difference between the NPFE and MPFE. Generally, MPPS > 80 nm (CMD of the challenge aerosol) results in a decrease when converting from NPFE to MPFE, while the converse is true for MPPS < 80 nm. This is supported by the theoretical discussion in the Methods section and . The difference between the NPFE and MPFE and the MPPS remains sufficiently scattered that a simple correlation is not possible.
Third, for the whole range of materials, there was a persistent relationship wherein high NPFE was associated with a smaller MPPS and thus yielded an increase in the filtration efficiency when converting to MPFE (upper-right sector of ). Conversely, low NPFE materials often had a larger MPPS and thus saw a decline in the conversion from NPFE to MPFE (lower-left sector of ). In other words, the slope of a line through the data is steeper than the line of parity in and the relationship between MPFE and NPFE is inversely proportional to MPPS. The consistency of the trend across conditioned and unconditioned masks, a large range of NPFE, and a large number of lots is interesting. The materials in this study are typically non-wovens (such as melt-blown polypropylene), suggesting this trend may hold for this class of materials. Caution remains to extrapolate such a trend more generally to all materials, particularly to materials for face coverings worn by the general public and across materials with various levels of electrostatic charge (Zangmeister et al. Citation2020; Rogak et al. Citation2021). However, most materials wherein MPFE > NPFE have an MPPS ∼ 50 nm, which is consistent with previous observations (Eninger et al. Citation2008) and theoretical predictions of a shift downward in the MPPS (Huang et al. Citation2013; Wang and Otani Citation2013) for electret materials. As such, likely, the higher filtration materials often employ electrostatic capture to increase the PFE. Alternatively, the shift to lower MPPS could stem from thinner fibers with a finer mesh (Podgorski et al. Citation2006), though such differences may be more relevant in the sub-90% NPFE range.
Fourth, indicates the presence of a set of outliers in the 97–99.8% NPFE level where MPFE < NPFE. These samples correspond to a single set of melt-blown polypropylene media (denoted here as Lot 4.X) with high PFE, abnormally large MPPS, and exceptionally high-pressure drops (breathing resistance of 200–500 Pa). Collectively, this suggests that Lot 4.X was a higher basis weight material, which relied more on mechanical filtration to achieve higher filtration efficiencies than the other materials in this NPFE range.
Overall, the results in demonstrate that there is a significant number of samples from these respirators and filtration materials that exceed the 95% threshold for MPFE but have lower NPFE values, mostly in the 90–95% range. These are shown as a shaded region in the upper, left corner of , and would pass the corresponding test method for MPFE, despite having a lower NPFE. This strengthens the position that standards should explicitly state whether quantities are to be mass- or number-based, as there are sufficient instances where a mask may pass by mass but not by number, particularly for electret materials. These observations are consistent with the electret materials considered by Rengasamy and Eimer (Citation2012), with that data set included in for reference (the conversion from NPFE to MPFE was not explicitly considered in that work). We also note that the converse, where NPFE > 95% but the MPFE was not, was very rare for the range of samples considered in this work. While this region may be relevant if the high-performing candidate respirators are sanitized for reuse and lose their electret properties (though the performance of respirators under these conditions is an active area of research, e.g., Carrillo et al. Citation2020; Czubryt et al. Citation2020; Everts et al. Citation2021; Jatta et al. Citation2021), this may reduce the filtration properties sufficiently that both the NPFE and MPFE will be below 95%. Further, samples in this quadrant are likely to be uncharged, instead relying on mechanical filtration to achieve high filtration. As a result, these materials are likely to be associated with higher pressure drops that make these materials poor candidates for respirators and likely to fail pressure resistance requirements in many standards. As such, NPFE would remain a reasonable surrogate for gauging compliance under most circumstances.
further examines the impact of the properties of the filtration media by considering the candidate reference material subset of the data, for which the charge state and basis weight of the material are controlled. Here, the uncharged materials correspond (i) to the lower NPFE cases and (ii) to the cases where the MPPS is large, such that MPFE is less than NPFE. Examination of size-resolved filtration curves (cf. ) affirms this, with the uncharged materials exhibiting a distinctly different SPFE profile relative to the charged materials. Within each cluster in (or the shaded regions in ), higher basis weights yield higher quality filtration media within the given charge state data cloud (higher in the shaded regions), consistent with an increase in solidity, fiber size, and/or media thickness. For the uncharged samples, this results in an increasing gap between the NPFE and MPFE. Greenline media (a commercial sample used by the TSI 8130A instrument as an internal reference) are uncharged and have a much higher MPPS, resulting in a decrease in the conversion from NPFE to MPFE. The resultant position in is consistent with an uncharged media with higher mechanical filtration than most of the candidate reference materials considered in this study. This affirms statements made in connection with , where the higher performing materials were hypothesized to be electret materials.
Figure 5. Examination of the SPFE, NPFE, and MPFE for a range of candidate reference filtration media where material the charge state and basis weight have been controlled. (a) NPFE vs. MPFE for PFEMS data across a series of candidate reference materials, colored by charge state and with shapes corresponding to different basis weights. Shaded, dashed boxes group common charge states, while “H” and “L” mark the high and low basis weight points for the medium charge state. The lines from Li et al. denote electret and uncharged fiberglass samples (Li et al. Citation2012). (b) SPFE from the PFEMS for a range of candidate reference materials, stated as the mean and 5–95% percentiles (shaded regions) of the materials for each charge state. Percentiles are excluded for the medium charge state in (b) for clarity. Also shown are single-layer Greenline media (thick, black, solid line) and the averages across all of the materials from with an MPPS below 63 nm or above 125 nm (black, dashed lines). Upper axis shows the size distributions from , for reference. The observed decrease at the upper diameter end of the medium charge state case in (b) corresponds to a region of expanding uncertainties for those curves and is nonphysical. Charge state refers to the voltage applied to the material during manufacture.
Such results are also largely consistent with Li et al. (Citation2012), where MPFE was measured using a TSI 8130 and NPFE using a pair of CPCs. In that study, researchers had varied input distributions across the range of NPFE, varying the CMD from 36–68 nm and the GSD from 1.5–1.93 to realize a broader range of PFE. This limits the comparison to the present study, where the aerosol size distribution was more consistent and a broader range of materials was considered. Nevertheless, Li et al. (Citation2012) considered two types of materials: electret and uncharged, fiberglass (akin, in terms of material class, to Greenline media) materials, which had MPPSs of ∼50 nm and 160 nm, respectively. In all cases, they observed that fiberglass samples had MPFE < NPFE, consistent with the MPPS being much larger than the CMD of the challenge aerosol. Conversely, their electret material saw MPFE ≫ NPFE, consistent with the MPPS being smaller than the CMD. The trend observed in the uncharged fiberglass samples measured by Li et al. (Citation2012) is also consistent with the outlier Lot 4.X in . These trends are also consistent with earlier studies that did not discuss NPFE or MPFE but showed that electrostatic capture is least efficient for smaller particles (≈ 100 nm aerodynamic diameter) under the conditions relevant to respirator testing (Corbin et al. Citation2021).
Brief discussion of other variants of PFE
Briefly, the size-resolved measurements also allow for a limited comparison against other metrics for PFE. For example, the SPFE at a 100 nm mobility diameter, shown in , is the size targeted by the current ASTM F2299/F2100 test method. Results indicate that, provided that the testing was otherwise identical, the SPFE at 100 nm is often similar to the MPFE. The former statement is an important caveat, however, given the common practice of using an unneutralized challenge aerosol (associated with ASTM and FDA (Food and Drug Administration Citation2004) recommendations to medical mask premarket submissions). When the aerosol is not neutralized, the filter media can capture particles much more effectively, resulting in a much weaker challenge (Corbin et al. Citation2021) that will result in much higher filtration efficiencies and cannot be compared to the MPFE reported here in any meaningful way. Similar statements hold true for using a different face velocity (Corbin et al. Citation2021). Nevertheless, migration of standards from using the SPFE at 100 nm to an MPFE should not eliminate very many products, given the aforementioned caveats are satisfied.
Figure 6. The relationship between the MPFE and (a) the SPFE at a 100 nm mobility diameter and (b) the scattering-based PFE. Presentation is otherwise analogous to . Note that particles are neutralized before characterization for this data.
Technically, photometers measure scattering-based PFE, which is largely considered equivalent to the MPFE. examines the relationship between the MPFE and the scattering-based PFE (Biermann and Bergman Citation1988), weighting using the distribution shown in (which uses Mie theory, assuming spheres; a refractive index of m = 1.5442 + 0i; a wavelength of λ = 532 nm; and a forward scattering angle of 45°). Overall, MPFE and scattering-based PFE are more correlated than NPFE and MPFE, even if scatter in the results remains. The higher degree of correlation is most notable for samples where MPBE < 95%, where any structured errors that existed in the NPFE to MPFE are no longer present. Structure relative to the underlying MPPS has also disappeared, in particular for lower MPFE media. Overall, while a single correlation factor to convert between a scattering-based PFE from the photometers and the MPFE is reasonable for much of the range, it is not a precise conversion and could result in expanded uncertainties, particularly for MPFE >95%.
Experimental validation of the count-based system and TSI 8130A MPFE
indicates the relationship between the PFEMS MPFE computed using the aforementioned method and the TSI 8130A MPFE. Note that, as before, both axes are on a logarithmic scale concerning penetration, to space out the high filtration cases. On this scale, relative uncertainties in the penetration are roughly constant across the entire domain (which is equivalent to lower absolute uncertainties in the high MPFE points, i.e., absolute uncertainties are lower at 99% than they are at 30% MPFE).
Figure 7. Parity plot and histogram showing the relationship between the MPFE computed using the PFEMS number-based systems vs. the MPFE output of two TSI 8130As (i.e., TSI-1 and TSI-2) for the candidate reference materials (denoted ref. matl.). Error bounds correspond to the standard deviation across multiple (typically three) repeats for the PFEMS and are excluded from the comparison to TSI-2 for clarity. The symbols for TSI-1 refer to whether the data corresponds to (circles) a candidate reference material (cf. ) or (squares) a set of candidate N95 respirators. Inset shows a histogram of the relative errors in the TSI 8130A measurements relative to the PFEMS.
Overall, the MPFE is highly correlated between all three instruments (the Pearson correlation coefficient between the PFEMS and the combined TSI-1 and TSI-2 is R = 0.978), indicating consistency between these two types of instruments and the conversion of the PFEMS data to MPFE removes structure in the error between the two classes of systems. The histogram of the ratio of the TSI 8130A MPFE to that derived from the PFEMS generally affirms this observation but also shows some difference between the two TSI 8130As, which typically results in outliers in the tails of the different histograms. As a result, the PFEMS MPFE often exists between the MPFE output by the TSI 8130As, suggesting that the PFEMS may be more consistent and that much of the scatter here results from variability between the TSI 8130A instruments. This may stem from insensitivities of the photometer output to the small particles present in the challenge aerosol (Eninger et al. Citation2008), limiting the accuracy of the calibration procedures, particularly when the size distribution is not lognormal, or to small shifts in the nebulizer output from the TSI 8130As. A majority of samples yielded similar results between all three devices, yielding inter-device errors on the order of 25% (one standard deviation) of the mass-based penetration.
Greenline media MPFE, in particular, showed excellent agreement between the PFEMS and the TSI 8130As, which may support the above hypothesis that inaccuracy due to small particles plays a role in the scatter of and may support improvements to the calibration procedures associated with these measurements.
Conclusions
This work presents data mined from several thousand filtration testing samples examining the relationship between the NPFE and MPFE. We have demonstrated consistencies between the output of a number-based system (PFEMS) and the mass-based filtration efficiency (MPFE) output by the TSI 8130A, the instrument most often used in conjunction with the NIOSH N95 test method. This provides a nearly complete explanation of previously-noted differences between count- and mass-based measurements observed for a much smaller number of samples (e.g., Rengasamy and Eimer Citation2012). We complement this by noting some correlation between the SPFE at 100 nm mobility diameter and MPFE.
Empirical observations suggest a common scenario in which high NPFE materials are often associated with (i) electret materials, as expected; (ii) a smaller MPPS; and (iii) an increase when converting from NPFE to MPFE (a consequence of the smaller MPPS). Data in which MPFE > 95% but NPFE < 95%, were sufficiently common to indicate that documentary standards should explicitly state whether filtration efficiencies are mass-based. Cases where NPFE > 95% but MPFE < 95% were infrequent, suggesting that the NPFE may be used to assess performance for mass-based standards under many conditions. While uncharged materials may disrupt this simple interpretation, these materials are more likely to fail pressure drop requirements, due to the reliance on mechanical filtration.
Absolute differences between the output of the number-based system (PFEMS) and that of the TSI 8130A decrease as the PFE increases. Relative errors in the penetration were approximately constant across a wide range of PFE. Larger variations appear to be present between two TSI 8130A systems than between the TSI 8130As and the number-based system. Generally, consistencies between all three instruments were within 25% (one standard deviation) of the measured mass-based penetration.
We also demonstrate the equivalence of SMPS-based and calibrated photometer systems, when both are expressed as MPFE. We emphasize the different particle metrics and how size-resolved filtration efficiencies must be used to convert between the quantities, as they are not generally equivalent.
Recommendations
Individuals involved in regulating, developing standards for, or making measurements of respiratory protection need to be aware of the nuances and consequences of size distributions, their link to instrumentation, and the variants of particle filtration efficiency that can be measured. Standards should be clear about what quantities are being measured, as a number- and mass-based filtration efficiencies are not always the same. Number-based filtration efficiencies may provide more conservative measures of particle filtration, in particular for electret materials. The mass-based filtration efficiency also acts as a suitable replacement of the SPFE at 100 nm mobility diameter, currently targeted by the ASTM F2299/F2100 standards, provided the experimental parameters are otherwise appropriately constrained.
| CMAD | = | Count median aerodynamic diameter |
| CMD | = | Count median mobility diameter (equal to GMD for number-based lognormal distributions). Also denoted by dg. |
| CPC | = | Condensation particle counter |
| GMD | = | Geometric mean diameter |
| GSD | = | Geometric standard deviation |
| GSM | = | Grams per square meter, in reference to basis weight |
| MPFE | = | Mass-based PFE, integrated for a specific particle size distribution |
| MMAD | = | Mass median aerodynamic diameter |
| MMD | = | Mass median mobility diameter (equal to GMD for mass-based lognormal distributions) |
| MPPS | = | Most penetrating particle size |
| NPFE | = | Number-based (or count-based) PFE, integrated for a specific particle size distribution |
| PFE | = | Particle filtration efficiency, as a summary term for SPFE, NPFE, and MPFE |
| PFEMS | = | The National Research Council Canada’s Particle Filtration Efficiency Measurement System (Smallwood et al. Citation2020) |
| PSL | = | Polystyrene latex |
| SMPS | = | Scanning mobility particle sizer |
| SPFE | = | Size-resolved PFE, that is the PFE resolved as a function of particle size. Independent of particle size distribution used for evaluation. |
| UQ | = | Uncertainty quantification |
Supplemental Material
Download MS Word (719.9 KB)Acknowledgments
We thank the entire NRC COVID-19 Respirator Testing Team for their contribution to the measurements discussed here, including: Adam Willes, Adrian Simon, Aiden Korycki-Striegler, Ali Ghaemi, Allison Sibley, Amor Duric, Amr Said, Anabelle Bourgeois, Andason Cen, Andre Cantin, Andrew Oldershaw, Apoorv Shah, Brett Smith, Bryan Muir, Cam Lebrun, Cindy Jiang, Chantal Prévost, Christina Brophy, Dan Clavel, Dave Angelo, David Kennedy, Deval Patel, Doug Mackenzie, Douglas McIntyre, Erhan Dikel, Flamur Canaj, Gang Nong, Garnet McRae, Getho Eliodor, Greg Nilsson, Harold Parks, Isabelle Rajotte, James Renaud, James Saragosa, Jason Brown, Jean Dessureault, Jeff Tomkins, Jeremy Macra, Joshua Marleau-Gillette, Kari McGuire, Kimberly Moore, Krystal Davis, Laura Forero, Lyne St-Cyre, Marilyn Azichoba, Mario Carrière, Mark Vuotari, Michel Levesque, Michael Ryan, Mladen Jankovic, Nicholas Wise, Nikolas Angelo, Ovi Mihai, Peter Hanes, Richard Agbeve, Samuel Camiré, Simon-Alexandre Lussier, Sonia Mutombo, Stacey Lee, Stephane Lapointe, Stephanie Gagné, Steve Kruithof, Thierry Lavoie, Tomi Schebywolok, Tyler Hunter, Vicki Wang, Xigeng Zhao, and Yanen Guo. We also wish to acknowledge Kyle Fiolka and Travis Klassen of Roswell Downhole Technologies for their contributions. We also wish to thank Rebecca Lau for insightful feedback on the contents of the manuscript.
Data availability
The data that support the findings of this study are available in the supplemental information and in a public repository at https://github.com/tsipkens/nrc-mask-data.
Additional information
Funding
References
- Abboah-Offei M, Salifu Y, Adewale B, Bayuo J, Ofosu-Poku R, Opare-Lokko EBA. 2021. A rapid review of the use of face mask in preventing the spread of COVID-19. Int J Nurs Stud Adv. 3:100013. doi:10.1016/j.ijnsa.2020.100013
- Bagheri MH, Khalaji I, Azizi A, Loibl RT, Basualdo N, Manzo S, Gorrepati ML, Mehendale S, Mohr C, Schiffres SN. 2021. Filtration efficiency, breathability, and reusability of improvised materials for face masks. Aerosol Sci Technol. 55(7):817–827. doi:10.1080/02786826.2021.1898537
- Bałazy A, Toivola M, Adhikari A, Sivasubramani SK, Reponen T, Grinshpun SA. 2006. Do N95 respirators provide 95% protection level against airborne viruses, and how adequate are surgical masks? Am J Infect Control. 34(2):51–57. doi:10.1016/j.ajic.2005.08.018
- Barrett LW, Rousseau AD. 1998. Aerosol loading performance of electret filter media. Am Ind Hyg Assoc J. 59(8):532–539. doi:10.1080/15428119891010703
- Bazant MZ, Bush JWM. 2021. A guideline to limit indoor airborne transmission of COVID-19. Proc Natl Acad Sci USA. 118(17):e2018995118. doi:10.1073/pnas.2018995118
- Bement TW, Downey DJ, Mitros A, Lau R, Sipkens TA, Songer J, Alexander H, Ostrom D, Nikookar H, Rogak SN. 2022. Filtration and breathability of nonwoven fabrics used in washable masks. Aerosol Air Qual. Res. 22:220044. doi:10.4209/aaqr.220044
- Biermann A, Bergman W. 1988. Filter penetration measurements using a condensation nuclei counter and an aerosol photometer. J Aerosol Sci. 19(4):471–483. doi:10.1016/0021-8502(88)90022-5
- Bohren CF, Huffman DR. 2008. Absorption and scattering of light by small particles. Weinheim, Germany: John Wiley & Sons.
- Carrillo IO, Floyd AC, Valverde CM, Tingle TN, Zabaneh FR. 2020. Immediate-use steam sterilization sterilizes N95 masks without mask damage. Infect Control Hosp Epidemiol. 41(9):1104–1105. doi:10.1017/ice.2020.145
- Corbin JC, Smallwood GJ, Leroux I, Oliaee JN, Liu F, Sipkens TA, Green RG, Murnaghan NF, Koukoulas T, Lobo P. 2021. Systematic experimental comparison of particle filtration efficiency test methods for commercial respirators and face masks. Sci Rep. 11(1):21979.
- Czubryt M, Stecy T, Popke E, Aitken R, Jabusch K, Pound R, Lawes P, Ramjiawan B, Pierce G. 2020. N95 mask reuse in a major urban hospital: COVID-19 response process and procedure. J Hosp Infect. 106(2):277–282. doi:10.1016/j.jhin.2020.07.035
- DeCarlo PF, Slowik JG, Worsnop DR, Davidovits P, Jimenez JL. 2004. Particle morphology and density characterization by combined mobility and aerodynamic diameter measurements. Part 1: theory. Aerosol Sci Technol. 38(12):1185–1205.
- Dharmaraj S, Ashokkumar V, Hariharan S, Manibharathi A, Show PL, Chong CT, Ngamcharussrivichai C. 2021. The COVID-19 pandemic face mask waste: a blooming threat to the marine environment. Chemosphere. 272:129601. doi:10.1016/j.chemosphere.2021.129601
- Duncan S, Bodurtha P, Naqvi S. 2021. The protective performance of reusable cloth face masks, disposable procedure masks, KN95 masks and N95 respirators: filtration and total inward leakage. PLoS One. 16(10):e0258191. doi:10.1371/journal.pone.0258191
- Eninger RM, Honda T, Reponen T, McKay R, Grinshpun SA. 2008. What does respirator certification tell us about filtration of ultrafine particles? J Occup Environ Hyg. 5(5):286–295. doi:10.1080/15459620801960153
- Everts RJ, Al Ghusaini S, Telfar-Barnard L, Barclay E, Tan S, Jekel S, Jennings L, Choi DH, Hilson D, Gibson B. 2021. Liquid-immersion reprocessing effects on filtration efficiency of ‘single-use’ commercial medical face masks. Ann Work Exposures Health. 66(2):246–259.
- Fadare OO, Okoffo ED. 2020. Covid-19 face masks: a potential source of microplastic fibers in the environment. Sci Total Environ. 737:140279. doi:10.1016/j.scitotenv.2020.140279
- Food and Drug Administration. 2004. Guidance for industry and FDA staff: surgical masks—Premarket Notification.
- Gettings J, Czarnik M, Morris E, Haller E, Thompson-Paul AM, Rasberry C, Lanzieri TM, Smith-Grant J, Aholou TM, Thomas E, et al. 2021. Mask use and ventilation improvements to reduce COVID-19 incidence in elementary schools—Georgia, November 16–December 11, 2020. MMWR Morb Mortal Wkly Rep. 70(21):779–784. doi:10.15585/mmwr.mm7021e1
- Görner P, Bemer D, Fabries J. 1995. Photometer measurement of polydisperse aerosols. J Aerosol Sci. 26(8):1281–1302. doi:10.1016/0021-8502(95)00049-6
- Grima-Olmedo C, Ramírez-Gómez Á, Medic-Pejic L, García-Torrent J. 2014. The penetration of respiratory protective devices by respirable solid particles. J Aerosol Sci. 74:36–41. doi:10.1016/j.jaerosci.2014.03.008
- Hao W, Xu G, Wang Y. 2021. Factors influencing the filtration performance of homemade face masks. J Occup Environ Hyg. 18(3):128–138. doi:10.1080/15459624.2020.1868482
- Hartanto BW, Mayasari DS. 2021. Environmentally friendly non-medical mask: an attempt to reduce the environmental impact from used masks during COVID 19 pandemic. Sci Total Environ. 760:144143. doi:10.1016/j.scitotenv.2020.144143
- Heintzenberg J. 1994. Properties of the log-normal particle size distribution. Aerosol Sci Technol. 21(1):46–48. doi:10.1080/02786829408959695
- Hendrix MJ. 2020, May. Absence of apparent transmission of SARS-CoV-2 from two stylists after exposure at a hair salon with a universal face covering policy—Springfield, Missouri, MMWR Morbidity and mortality weekly report. p. 69.
- Hinds WC. 1999a. 9 Filtration. In: Hinds WC, editor. Aerosol technology: properties, behavior, and measurement of airborne particles. Hoboken, NJ: John Wiley & Sons. p. 182–206.
- Hinds WC. 1999b. Aerosol technology: properties, behavior, and measurement of airborne particles. Hoboken, NJ: John Wiley & Sons.
- Huang S-H, Chen C-W, Kuo Y-M, Lai C-Y, McKay R, Chen C-C. 2013. Factors affecting filter penetration and quality factor of particulate respirators. Aerosol Air Qual Res. 13(1):162–171. doi:10.4209/aaqr.2012.07.0179
- Issman L, Graves B, Terrones J, Hosmillo M, Qiao R, Glerum M, Yeshurun S, Pick M, Goodfellow I, Elliott J, et al. 2021. Filtration of viral aerosols via a hybrid carbon nanotube active filter. Carbon. 183:232–242. doi:10.1016/j.carbon.2021.07.004
- Jatta M, Kiefer C, Patolia H, Pan J, Harb C, Marr LC, Baffoe-Bonnie A. 2021. N95 reprocessing by low temperature sterilization with 59% vaporized hydrogen peroxide during the 2020 COVID-19 pandemic. Am J Infect Control. 49(1):8–14. doi:10.1016/j.ajic.2020.06.194
- Kulkarni P, Baron PA, Willeke K. 2011. Aerosol measurement: principles, techniques, and applications. Hoboken, NJ: John Wiley & Sons.
- LaRue RJ, Morkus P, Laengert S, Rassenberg S, Halali MA, Colenbrander JW, Clase CM, Latulippe DR, de Lannoy CF. 2021. Navigating performance standards for face mask materials: a custom‐built apparatus for measuring particle filtration efficiency. Global Chall. 5(11):2100052.
- Lei Z, Yang J, Zhuang Z, Roberge R. 2013. Simulation and evaluation of respirator faceseal leaks using computational fluid dynamics and infrared imaging. Ann Occup Hyg. 57(4):493–506. doi:10.1093/annhyg/mes085
- Li L, Zuo Z, Japuntich DA, Pui DYH. 2012. Evaluation of filter media for particle number, surface area and mass penetrations. Ann Occup Hyg. 56(5):581–594.
- Lu HX, Yao DW Yip J, Kan C-W, Guo H. 2020. Addressing COVID-19 spread: development of reliable testing system for mask reuse. Aerosol Air Qual Res. 20(11):2309–2317.
- Lyu W, Wehby GL. 2020. Community use of face masks and COVID-19: evidence from a natural experiment of state mandates in the US: study examines impact on COVID-19 growth rates associated with state government mandates requiring face mask use in public. Health Affairs. 39(8):1419–1425. doi:10.1377/hlthaff.2020.00818
- Ma QX, Shan H, Zhang CM, Zhang HL, Li GM, Yang RM, Chen JM. 2020. Decontamination of face masks with steam for mask reuse in fighting the pandemic COVID‐19: experimental supports. J Med Virol. 92(10):1971–1974. doi:10.1002/jmv.25921
- Mätzler C. 2002. MATLAB functions for Mie scattering and absorption. Report number: 2002-08. Institute of Applied Physics, University of Bern.
- Moosmüller H, Arnott WP. 2009. Particle optics in the Rayleigh regime. J Air Waste Manag Assoc. 59(9):1028–1031. doi:10.3155/1047-3289.59.9.1028
- NIOSH. 2007. Determination of 116 particulate filter efficiency level for N95 series filters against solid particulates 117 for non-powered, air purifying respirators standard testing procedure (STP).
- OSHA. 2004. 1910.134 App A—fit testing procedures (mandatory). Measurement of the size-resolved filtration efficiency of various face mask materials up to 5 micrometres using the Aerodynamic Aerosol Classifier. European Aerosol Conference 2021, UK.
- Payne SD, Johnson TJ, Symonds JPR. 2021. Measurement of the size-resolved filtration efficiency of various face mask materials up to 5 micrometres using the Aerodynamic Aerosol Classifier. In: European Aerosol Conference, United Kingdom.
- Podgorski A, Bałazy A, Gradoń L. 2006. Application of nanofibers to improve the filtration efficiency of the most penetrating aerosol particles in fibrous filters. Chem Eng Sci. 61(20):6804–6815. doi:10.1016/j.ces.2006.07.022
- Pratt KA, Prather KA. 2012. Mass spectrometry of atmospheric aerosols—recent developments and applications. Part II: on‐line mass spectrometry techniques. Mass Spectrom Rev. 31(1):17–48. doi:10.1002/mas.20330
- Qian Y, Willeke K, Grinshpun SA, Donnelly J, Coffey CC. 1998. Performance of N95 respirators: filtration efficiency for airborne microbial and inert particles. Am Ind Hyg Assoc J. 59(2):128–132. doi:10.1080/15428119891010389
- Radney JG, Weaver JL, Vicenzi EP, Staymates ME, Zangmeister CD. 2021. Filter inserts impact cloth mask performance against nano-to micro-sized particles. ACS Nano. 15(8):12860–12868. doi:10.1021/acsnano.1c05182
- Rengasamy S, Eimer BC. 2011. Total inward leakage of nanoparticles through filtering facepiece respirators. Ann Occup Hyg. 55(3):253–263.
- Rengasamy S, Eimer BC. 2012. Nanoparticle filtration performance of NIOSH-certified particulate air-purifying filtering facepiece respirators: evaluation by light scattering photometric and particle number-based test methods. J Occup Environ Hyg. 9(2):99–109. doi:10.1080/15459624.2011.642703
- Rengasamy S, Eimer BC, Shaffer RE. 2012. Evaluation of the performance of the N95-companion: effects of filter penetration and comparison with other aerosol instruments. J Occup Environ Hyg. 9(7):417–426. doi:10.1080/15459624.2012.685838
- Rengasamy S, Shaffer R, Williams B, Smit S. 2017. A comparison of facemask and respirator filtration test methods. J Occup Environ Hyg. 14(2):92–103. doi:10.1080/15459624.2016.1225157
- Rogak SN, Sipkens TA, Guan M, Nikookar H, Figueroa DV, Wang J. 2021. Properties of materials considered for improvised masks. Aerosol Sci Technol. 55(4):398–413. doi:10.1080/02786826.2020.1855321
- Rubio-Romero JC, Pardo-Ferreira MDC, Torrecilla-García JA, Calero-Castro S. 2020. Disposable masks: disinfection and sterilization for reuse, and non-certified manufacturing, in the face of shortages during the COVID-19 pandemic. Saf Sci. 129:104830.
- Sipkens TA, Corbin JC, Smallwood G. Submitted. Tutorial: a guide to forward error propagation for particle counting instruments. J Aerosol Sci.
- Smallwood GJ, Corbin JC, Gagné S, Leroux I, Lussier S-A, Liu F, Oliaee JN, Lobo P. 2020. A research-grade N95 respirator particle filtration efficiency measurement procedure. Report number: NR16-326/2020E. https://publications.gc.ca/collections/collection_2020/cnrc-nrc/NR16-326-2020-eng.pdf
- Stutt RO, Retkute R, Bradley M, Gilligan CA, Colvin J. 2020. A modelling framework to assess the likely effectiveness of facemasks in combination with ‘lock-down’ in managing the COVID-19 pandemic. Proc R Soc A Math Phys Eng Sci. 476(2238):20200376.
- Tang M, Chen S-C, Chang D-Q, Xie X, Sun J, Pui DY. 2018. Filtration efficiency and loading characteristics of PM2.5 through composite filter media consisting of commercial HVAC electret media and nanofiber layer. Sep Purif Technol. 198:137–145. doi:10.1016/j.seppur.2017.03.040
- Tcharkhtchi A, Abbasnezhad N, Seydani MZ, Zirak N, Farzaneh S, Shirinbayan M. 2021. An overview of filtration efficiency through the masks: mechanisms of the aerosols penetration. Bioact Mater. 6(1):106–122.
- Wang C-s, Otani Y. 2013. Removal of nanoparticles from gas streams by fibrous filters: a review. Ind Eng Chem Res. 52(1):5–17. doi:10.1021/ie300574m
- Zangmeister CD, Radney JG, Staymates ME, Vicenzi EP, Weaver JL. 2021. Hydration of hydrophilic cloth face masks enhances the filtration of nanoparticles. ACS Appl Nano Mater. 4(3):2694–2701. doi:10.1021/acsanm.0c03319
- Zangmeister CD, Radney JG, Vicenzi EP, Weaver JL. 2020. Filtration efficiencies of nanoscale aerosol by cloth mask materials used to slow the spread of SARS-CoV-2. ACS Nano. 14(7):9188–9200. doi:10.1021/acsnano.0c05025
- Zhao M, Liao L, Xiao W, Yu X, Wang H, Wang Q, Lin YL, Kilinc-Balci FS, Price A, Chu L, et al. 2020. Household materials selection for homemade cloth face coverings and their filtration efficiency enhancement with triboelectric charging. Nano Lett. 20(7):5544–5552. doi:10.1021/acs.nanolett.0c02211
- Zieger P, Väisänen O, Corbin JC, Partridge DG, Bastelberger S, Mousavi-Fard M, Rosati B, Gysel M, Krieger UK, Leck C, et al. 2017. Revising the hygroscopicity of inorganic sea salt particles. Nat Commun. 8(1):1–10. doi:10.1038/ncomms15883
- Zoller J, Meyer J, Dittler A. 2021. A critical note on filtering-face-piece filtration efficiency determination applying EN 149. J Aerosol Sci. 158:105830. doi:10.1016/j.jaerosci.2021.105830