
Abstract
Sensors and sensor systems for monitoring fine particles with aerodynamic diameters smaller than 2.5 µm can provide real-time feedback on indoor air quality and thus can help guide actions to manage indoor air pollutant concentrations. Standardized verification of the performance and accuracy of sensors and sensor systems is crucial for predicting the efficacy of such monitoring. A new ASTM International standard test method (ASTM D8405) was created for this need and is the most exacting laboratory protocol published to date for evaluating indoor air quality sensors and sensor systems measuring particles smaller than 2.5 µm in diameter. ASTM D8405 subjects sensors and sensor systems to five test phases: (1) an initial particle concentration ramp; (2) exposure to various temperature and humidity conditions; (3) exposure to interfering particles; (4) temperature cycling; and (5) a final particle concentration ramp to assess drift. This paper discusses the development of the standard test method, key aspects of the testing process, example evaluation results, and a comparison of this standard test method against peer evaluation protocols.
Introduction
The indoor air environment presents many pathways and sources for exposure to airborne particles, such as infiltration from outdoors (Choi and Kang Citation2017; Barkjohn et al. Citation2020; Citation2021); cooking, smoking, and incense burning (Singer and Delp Citation2018; Wang et al. Citation2020); and floor dust resuspension and clothing fiber release (Licina et al. Citation2017). Occupational settings can also expose occupants to high levels of indoor particles, such as those from machining/grinding, welding, and spray painting. Exposure to particles can negatively impact human health and is linked to respiratory and cardiovascular problems such as asthma, lung cancer, and heart disease (McCormack et al. Citation2009; Hoek et al. Citation2013; Pun et al. Citation2017; McDuffie et al. Citation2021), while growing evidence associates particle exposure to cognitive issues such as dementia and Alzheimer’s disease (Underwood Citation2017). Since people spend about 86% of their time in enclosed buildings (Klepeis et al. Citation2001), exposure to airborne particles in indoor environments is an occupational and environmental concern.
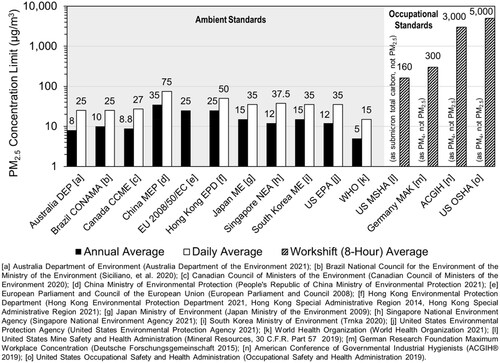
Currently, air quality standards for particles exist as size-fractionated mass concentration (hereafter “mass concentration” is just referred to as “concentration” for brevity) limits, i.e., particulate matter (PM) mass per volume of air for particles with aerodynamic diameters smaller than 10 µm (PM10), 4 µm (PM4), and 2.5 µm (PM2.5). Of these fractions, PM2.5 poses the greatest risk to health since smaller particles reach the deepest regions of the lungs, and through various clearing mechanisms can end up in other organs such as kidneys and livers (Li et al. Citation2019). shows ambient PM2.5 and occupational PM air quality standards by various authorities. Note that indoor or occupational PM2.5 air quality standards currently do not exist.
Figure 1. Overview of current PM2.5 concentration limits from a variety of governmental, non-governmental, and occupational environmental and health authorities. Note that: China MEP values shown in this figure are for “urban” areas; EU 2008/50/EC does not have a daily average standard; occupational standards are not expressed in terms of PM2.5; US MSHA limits are for total carbon in the submicron fraction of particles as determined by NIOSH Method 5040, while other occupational standards are for the “respirable” fraction of particles, also known as PM4.
While passive infiltration is always present at various rates (higher rates in older buildings), natural ventilation by opening windows could be employed if outdoor PM2.5 concentrations are lower than indoor concentrations, and active air filtration systems can be used if outdoor PM2.5 concentrations are elevated. While some government agencies measure outdoor PM2.5 concentrations using reference-grade PM monitors (∼$20,000–40,000 plus requiring highly skilled operators), indoor PM2.5 concentrations are not commonly measured. Such measurements could optimize building air quality by: (1) triggering manual ventilation/filtration; (2) providing feedback to automated building systems to activate ventilation/filtration systems; (3) assessing whether ventilation/filtration is resulting in acceptable indoor PM2.5 reductions; and/or (4) determining whether systems need maintenance. Recently, inexpensive (∼$10–$5,000) PM2.5 sensors and sensor systems (S&SS; here we differentiate “sensor” which refers to a sensing module [typically an optical-electrical] component, from “sensor system” which refers to one or more sensors integrated with other components such as power, data storage/transmittance, and user interface) have proliferated in the consumer market (Zhang and Srinivasan Citation2020; South Coast AQMD AQ-SPEC Citation2021). While PM2.5 S&SS are well suited for indoor PM2.5 monitoring due to their low cost/power/noise, compact form factor, ease of operation and maintenance, numerous design and esthetic choices for consumers, and the ability to integrate with smart home devices, data quality and interpretation are significant concerns (Snyder et al. Citation2013; Lewis and Edwards Citation2016). Among manufacturer decisions that impact PM2.5 S&SS performance are measurement principle, laser power and wavelength, optical-scattering angle, sensor calibration procedure (if any), calibrant particle composition, sampling mechanism, flow path design, temperature (T) and relative humidity (RH) conditioning/compensation techniques (if any), sensor housing design, product quality control, and algorithmic post-processing of raw data.
Performance evaluation of PM2.5 S&SS for indoor environment deployment may be assessed from controlled-chamber testing, in which indoor climate and particle pollution conditions can be simulated. In 2017, the Air Quality Sensor Performance Evaluation Center (AQ-SPEC) at the South Coast Air Quality Management District (South Coast AQMD) partnered with Newport Partners, LLC through a collaborative agreement with the U.S. Department of Energy to develop a comprehensive ASTM International standard test method for indoor PM2.5 S&SS, based on the AQ-SPEC laboratory chamber testing methodologies for air quality sensors measuring criteria pollutants (Papapostolou et al. Citation2017).
In September 2021, this new standard test method was approved as ASTM D8405 (ASTM International Citation2021) (for a copy of this standard, visit the ASTM website at www.astm.org). The development of this standard test method (hereinafter “test method”) and anonymized S&SS evaluation data are presented in this paper. This manuscript and its Supplemental Information are not intended to be and should not be used as a substitute for the ASTM D8405 test method document published by ASTM International. Therefore, textual explanations and descriptions of calculations are provided in the Supplemental Information, but actual equations are omitted and instead can be found in ASTM D8405.
Methods
Test equipment
Supplemental Tables S1–S4 summarize the test method requirements for equipment, including the chamber, clean air generator, particle generators, and reference monitor (RM). The equipment used to develop this test method is shown in , and is the chamber detailed in Papapostolou et al. (Citation2017) with the addition of a particle neutralizer. This equipment met all requirements except for: (1) the use of potassium chloride instead of sodium chloride for inorganic particle generation and (2) no testing specific to organic particles (Table S3), as these requirements were added to ASTM D8405 after the method development activities concluded.
Figure 2. Diagram of test equipment. Third S&SS not depicted in this diagram. White arrows indicate particle-free air flows, while hatched arrows indicate particle-laden air flows. Principal components described in the main text are in bold font, while other components are described in the Supplemental Information.
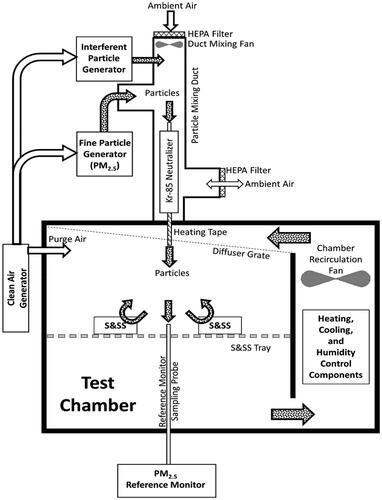
Table 1. Summary of requirements for this test method: S&SS devices. Detailed requirements, procedures, and calculations are in the published test method.
Table 4. Test equipment performance during PMc interferent tests in Phase 3 (Interferent Testing).
The test chamber (G-Series Elite, model GD-32-3-AC, Russells, Holland, MI) was a rectangular-shaped enclosure with 1.3 m3 volume, stainless-steel interior walls, T and RH controls, and a recirculation fan. A PALAS AGK 2000 nebulizer was used to produce a monodisperse population of PM2.5 from a 10% v/v potassium chloride (Sigma-Aldrich) in a deionized water solution. A TOPAS SAG 410/U dust disperser was used to produce interferent PM from ISO 12103-1 A4 Coarse Test Dust (Powder Technology Inc.). The PM2.5 RM employed was a GRIMM EDM 180 particle spectrometer, which is designated as a US EPA Class III Federal Equivalent Method (EQPM-0311-195) for measuring ambient PM2.5. This monitor also reported PM10 as well as particle size mass distributions (PSMD) and particle size count distributions (PSCD) from 0.25 to 30 µm. More details on testing system components can be found in the Supplemental Information.
summarizes the suitability criteria for evaluating S&SS using this test method. Four models of PM2.5 S&SS meeting these criteria were tested in triplicate. All S&SS were supplied external power and means of transmitting data, and vendor-supplied instructions were followed for each S&SS with respect to configuration, data transmission, and data retrieval. Details for each model, including the original equipment manufacturer (OEM) sensor, are provided in . All OEM PM2.5 sensors within the sensor systems evaluated employed optical scattering as the working principle. Since this study focused on the development of a test method and not the performance of any particular PM2.5 S&SS model, the S&SS model names are anonymized.
Table 2. Summary specifications of PM2.5 sensor system models evaluated.
Test procedures
Test system components were configured, and the test chamber was cleaned with isopropyl alcohol before and after each test. Table S5 lists the verification requirements of the PM2.5 RM before the commencement of testing; all verification requirements were carried out in this study except for the gravimetric verification and organic PM2.5 calibration aspects since these requirements were added to ASTM D8405 after method development activities had concluded. All PM2.5 values from the RM in this study were corrected as described in Table S6.
S&SS were subjected to five test phases to probe different performance aspects (). Additional discussion regarding each test phase and evaluation metric can also be found in the Supplemental Information. S&SS were placed on a wire rack testing tray (), equidistant from the RM sampling probe such that S&SS and the RM encountered equivalent pollutant concentrations. Table S7 lists the evaluation parameters calculated for each test phase.
Figure 3. Summary of test phases. Detailed testing criteria can be found in the Supplemental Information. RSD = relative standard deviation. LOD = limit of detection. PMc = coarse particulate matter. Detailed requirements, procedures, and calculations are in the published test method.
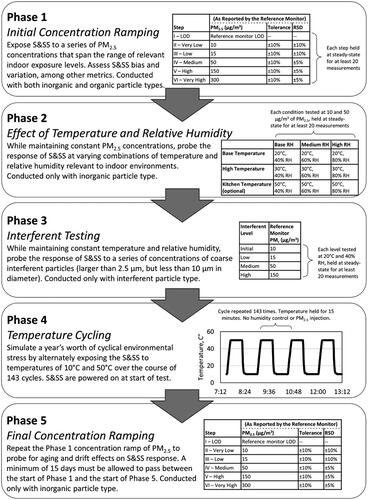
Phase 1: Initial concentration ramping
The first phase of testing exposed S&SS to increasing concentration steps of PM2.5 in the test chamber at T = 20 °C and RH = 40%: Step I – RM limit of detection (LOD; 0.1 µg/m3); Step II – Very Low (10 µg/m3); Step III – Low (15 µg/m3); Step IV – Medium (50 µg/m3); Step V – High (150 µg/m3); and Step VI – Very High (300 µg/m3). For each step change, RM concentrations were tracked to determine when “steady-state” tolerance and relative standard deviation (RSD) requirements shown in the Phase 1 inset table () were achieved with 20 consecutive measurements; then testing conditions were held at this steady state for at least 20 measurements by the RM or S&SS, whichever took longer, before proceeding to the next step.
Phase 1 also investigated the S&SS response to the loss of power by remotely activating S&SS when the RM reached steady-state conditions at Step II (10 µg/m3). S&SS capable of remote activation () did not collect data during Step I (LOD) and were held at Step II (10 µg/m3) for an additional amount of time (20 min) to allow for S&SS warmup.
Phase 2: Effect of temperature and relative humidity
The second phase exposed S&SS to steady-state conditions at 2 PM2.5 concentrations (10 and 50 µg/m3), 3 different T (20 °C, 30 °C, and 50 °C), and three different RH (40%, 60%, and 80%) conditions, as shown in the Phase 2 inset table (), for a total of 18 test conditions. Steady-state was achieved when 20 consecutive measurements from the RM satisfied Phase 1’s (Initial Concentration Ramping) accuracy and RSD requirements for the 10 and 50 µg/m3 concentrations; then testing conditions were held at this steady state for at least 20 measurements by the RM or S&SS, whichever took longer. Due to moisture condensing in and flooding the RM at 80% RH test conditions, a diffusion dryer column was integrated into the RM sampling probe without affecting the location or height of the RM sampling probe inlet.
Phase 3: Interferent testing
The third phase exposed S&SS to interferent particles, having aerodynamic diameters of 2.5–10 µm which are defined as “coarse PM” (PMc), at T = 20 °C and RH = 40%, at concentrations shown in the Phase 3 inset table (). PMc concentrations are the difference between the RM PM10 and RM PM2.5 concentrations (PMc = PM10 - PM2.5); the RM also collected PSMD data. Conditions were held at a steady state for at least 20 measurements by the RM or S&SS, whichever took longer.
Phase 4: Temperature cycling
The fourth phase exposed S&SS to alternating T between 10 and 50 °C for 143 cycles to mimic one year of thermal stress (see Supplemental Information for the basis of the test). Following a change in T setpoint, the chamber T was monitored until it was within ±10% of the T setpoint, and then held for 15 min before switching to the other T setpoint. No RM or S&SS data was collected during Phase 4. The S&SS were not powered on at the start of Phase 4, but a requirement that S&SS be powered on at the start of this test phase was added to ASTM D8405 after laboratory activities concluded.
Phase 5: Final concentration ramping
The final phase of testing repeated Phase 1 (Initial Concentration Ramping) to determine S&SS drift since the start of the evaluation. A minimum of 15 days duration for Phases 1–4 is required by the test method before conducting Phase 5 testing. This final phase was conducted in an identical manner to Phase 1.
Results
Test equipment
RM measurements collected while purging the chamber with clean air showed both a mean PM2.5 concentration and standard deviation (SD) of 0.1 µg/m3. The RM PM2.5 LOD (estimated as 3 times the SD added to the mean (Definition and Procedure for the Determination of the Method Detection Limit, 40 C.F.R. Part 136 App. B Citation2017) was 0.4 µg/m3. details the RM steady-state PM2.5 measurements for each concentration steady-state period (n = 20) in Phases 1 (Initial Concentration Ramping) and 5 (Final Concentration Ramping). All Phase 1 and 5 steady-state periods satisfied PM2.5 tolerance and RSD requirements (Phase 1 and 5 inset tables in ), but Steps IV (50 µg/m3) and V (150 µg/m3) exceeded the prescribed ±10% relative error limits (see Discussion Section for detailed information).
Table 3. Test equipment performance during the PM2.5 concentration ramp in Phase 1 (Initial Concentration Ramping) (and Phase 5 (Final Concentration Ramping) in parentheses).
The temperature (T) values under steady-state conditions recorded by the RM were within ±1 °C of the target T setpoint for all phases. Following each change in T for Phase 4 (Temperature Cycling), the chamber required 45 min to stabilize to the new T setpoint, requiring approximately 9 days to complete all 143 cycles.
The RH values at steady-state conditions were typically within the range of 40 ± 2% for Phase 1 (Initial Concentration Ramping), 2 (Effect of T and RH), 3 (Interferent Testing), and 5 (Final Concentration Ramping) tests that required RH to be 40%. Phase 2 testing also had additional RH setpoints at 60% and 80% and observed RH values at steady-state conditions were typically 60 ± 5% and 80 ± 10%, respectively.
summarizes test equipment performance during Phase 3 (Interferent Testing). For all interferent conditions, the PMc concentrations did not exceed a relative error of ±10% from the target concentrations, except for the “Medium” concentration condition (50 µg/m3) which had a relative error of −13%. RSD values were less than 10% for all concentration levels, except for the Low concentration condition (15 µg/m3) with an RSD of 15.1%. For the Initial and Low PMc concentration conditions (10 and 15 µg/m3, respectively), the PM2.5:PMc concentration ratio was ∼ 6:1, but when particle generator duty cycle settings were changed to increase PMc for the Medium and High concentration conditions (50 and 150 µg/m3, respectively), the PM2.5:PMc concentration ratio decreased to ∼2:1.
PM2.5 S&SS
Select results and evaluation metrics are presented in the following subsections. More results and evaluation metrics can be found in the Supplemental Information.
Phase 1: Initial concentration ramping
shows the Phase 1 test results for all 4 S&SS models. Overall, the S&SS models tested tracked the PM2.5 concentration increases, showed a very strong correlation with the RM (R2 > 0.99, intercept within ±6 µg/m3), and had 100% data recovery rates. Additionally, all models capable of remote activation started transmitting data within 5 min.
Figure 4. Phase 1 (Initial Concentration Ramping) evaluation results for: (a) Model A; (b) Model B; (c) Model C; and (d) Model D PM2.5 S&SS. Timeseries insets show each S&SS of the triplicate compared to the RM; Roman numerals indicate the concentration step; the dashed line indicates moment of S&SS remote activation, if applicable. Table insets list the relative error (compared to the RM) and RSD of the triplicate-averaged signal at each concentration step steady-state. Scatterplot insets show the correlation between the triplicate-averaged and the RM signal during the entirety of Phase 1; the thick gray line indicates the best-fit relationship; the dashed line indicates a one-to-one relationship.
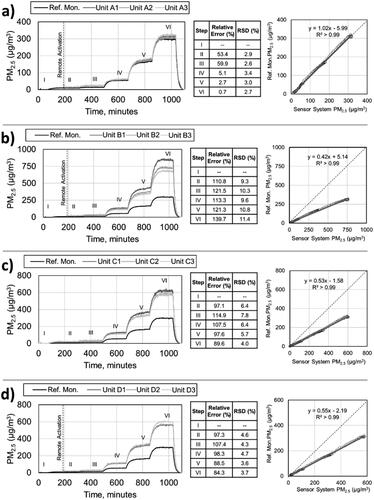
Model A () was the most accurate of the models tested, achieving a regression slope of near-unity, and possessing among the lowest relative error and RSD values for each concentration step. In contrast, Model B () had the highest relative errors (least accurate) and RSD values (least precise during steady-state) at each concentration step. Model B greatly overreported PM2.5 concentrations, by a factor of up to 2.7. Additionally, Model B showed the greatest intra-model variability between the triplicate devices. Models C and D () performed similarly in terms of relative errors and RSD at steady-state, as well as regression slopes (both models overreported PM2.5 by a factor of ∼2) and intercepts (about −2 µg/m3).
Phase 2: Effect of temperature and relative humidity
shows all S&SS models had increased relative errors in PM2.5 concentrations (compared to the RM) when T was increased from 20 °C to 30 °C, regardless of RH and PM2.5 concentration. Relative errors were greater at the 10 µg/m3 than at the 50 µg/m3 PM2.5 concentration condition, regardless of the S&SS model, T, and RH. Both Models A and D () showed no further increase in PM2.5 relative error when T was further elevated to 50 °C, with Model D overreporting (compared to the RM) by a factor of up to ∼3, while Model A overreported only by a factor of up to ∼2, at the highest RH condition. Model B () showed an additional increase in PM2.5 relative error when T was further elevated to 50 °C only for the 10 µg/m3 concentration, reaching as high as a factor of ∼7 compared to the RM at the highest RH condition. Model C () only showed an additional increase in PM2.5 relative error (up to a factor of ∼3.5) when T was increased to 50 °C at the 10 µg/m3 concentration and the highest RH (there were no Model C measurements during the T = 50 °C and PM2.5 = 50 µg/m3 experiments since Model C units powered off on their own during these experiments).
Figure 5. Phase 2 (Effect of T and RH) steady state, triplicate-averaged PM2.5 relative error compared to the RM, shown as a function of (a–d) temperature and (e–h) relative humidity, for Models A, B, C, and D, respectively. Connecting lines are to guide the eye. Note that all Model C S&SS powered off on their own during the T = 50 °C, PM2.5 = 50 µg/m3 experiments.
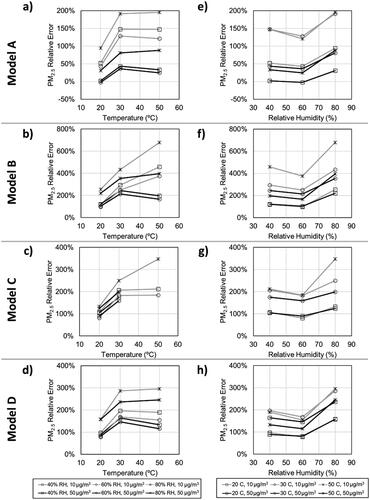
shows that all S&SS models did not show increased PM2.5 relative errors when RH was increased from 40% to 60%. However, when RH was increased from 60% to 80%, the PM2.5 relative error increased for all S&SS models regardless of T and PM2.5 concentration. Model A had among the lowest PM2.5 relative errors at 80% RH, followed by Model D, Model C, and Model B (overestimation of the RM concentrations up to a factor of ∼2, ∼3, ∼3.5, and ∼7, respectively).
Phase 3: Interferent testing
The RM was capable of distinguishing between PM10 and PM2.5, allowing for the determination of the PMc concentration (the difference between PM10 and PM2.5). However, reported PM2.5 concentrations from the S&SS may be influenced by the presence of PMc particles.
The relationship between PM2.5 concentration reported by an S&SS and that reported by the RM was previously established from the results of Phase 1 (Initial Concentration Ramping) testing using a PM2.5 particle generator (). In Phase 3, S&SS were exposed to a particle population that included both PM2.5 and PMc. To quantify the interference effect of PMc on PM2.5 values reported by the S&SS: first, the apparent PM2.5 concentration from the S&SS (PM2.5,app) was recorded at different PMc concentrations (Phase 3 inset table in ); next, the RM PM2.5 concentration at a given PMc concentration was used in concert with the RM vs. S&SS relationship from Phase 1 – Initial Concentration Ramping ( inset scatterplots) to calculate the PM2.5 concentration the S&SS would have reported in the absence of PMc particles, based on the RM PM2.5 concentration (PM2.5,calc); and finally, the PMc interference was calculated as the difference between an S&SS’s apparent PM2.5 concentration and the PM2.5 concentration that would have been reported in the absence of PMc (Interference = PM2.5,app - PM2.5,calc).
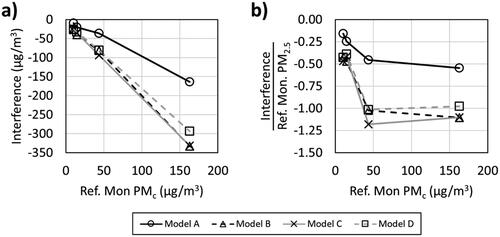
shows the PMc interference for the S&SS models as a function of PMc, while illustrates the PMc interference normalized by the RM PM2.5 concentration. All interference results were negative, meaning that in the presence of PMc, all S&SS models reported a lower PM2.5 concentration than they would have in the absence of PMc particles. Both the absolute (up to −164 µg/m3 at PMc ≈ 150 µg/m3) and the normalized (up to −0.55 at PMc ≈ 150 µg/m3) interference results were the lowest in magnitude for Model A. Models B, C, and D had similar interference values (these 3 S&SS models had absolute interferences up to about −300 µg/m3 and normalized interferences up to about −1 at PMc ≈ 150 µg/m3). All S&SS models demonstrated similar trends in PMc interference as a function of PMc – that is, absolute PMc interference monotonically increased in magnitude with PMc concentration (), while normalized PMc interference increased in magnitude up to PMc ≈ 50 µg/m3 but did not change much at higher PMc concentrations.
Figure 6. Phase 3 (Interferent Testing) steady-state, triplicate-averaged PMc interference on S&SS reported PM2.5 concentrations (Interference = PM2.5,app – PM2.5,calc). Interference is expressed in (a) absolute terms (µg/m3) and (b) normalized by the RM PM2.5 concentration (unitless). Connecting lines are to guide the eye.
Phase 5: Final concentration ramping
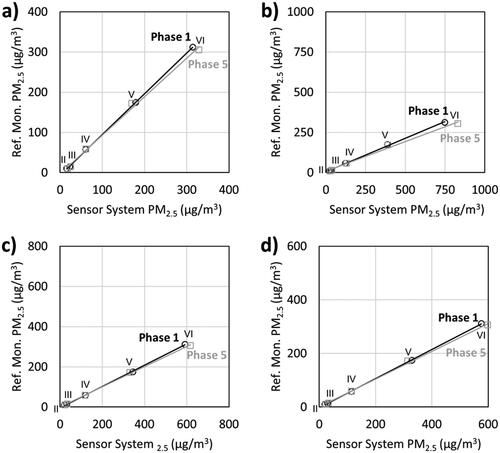
After the required minimum of at least 15 days since Phase 1 testing, Phase 5 was conducted to observe S&SS aging/drift. shows the steady-state PM2.5 concentration reported by each S&SS model plotted against the RM, for each steady-state period of Phase 1 and Phase 5 concentration ramps. For all S&SS models, the drift appeared to be negligible at PM2.5 < ∼150 µg/m3. At concentration Step V (nominally 150 µg/m3), S&SS Model B still showed some negligible drift in Phase 5, while Models A, C, and D reported 10–16 µg/m3 less than observed in Phase 1 (∼5% lower than their Phase 1 measurement). However, at concentration Step VI (nominally ∼300 µg/m3), Models A, B, C, and D reported 15, 83, 26, and 23 µg/m3 more than observed in Phase 1, respectively (∼5% higher than their Phase 1 measurement for Models A, C, and D, but ∼10% higher than the Phase 1 measurement for Model B).
Figure 7. Phase 1 (Initial Concentration Ramping; black circles) and Phase 5 (Final Concentration Ramping; gray squares) triplicate-averaged S&SS PM2.5 observations compared to RM PM2.5 measurements during each steady-state concentration. Black and gray solid lines indicate lines of best-fit of the steady-state points for Phase 1 and Phase 5, respectively; Roman numerals indicate the concentration step (note that Step I is not labeled either because (1) the sensor system was capable of remote activation and was not running at Step I or (2) for clarity in the case of Model C).
Discussion
Test equipment
The test equipment successfully subjected the S&SS to nearly all the prescribed conditions in . It should be noted that nominal Phase 1/5 (Initial/Final Concentration Ramping) PM2.5 concentrations and tolerances for ASTM D8405 ( inset tables) were selected and finalized after laboratory method development activities concluded, so it appears that the RM relative error during concentration Steps IV and V (nominally 50 and 150 µg/m3, respectively) exceeded the prescribed ±10% tolerance limits (). Subsequent experiments not related to this study confirm that the particle generator is indeed able to produce 50 and 150 µg/m3 concentrations in the chamber within ±10% tolerances using slightly different duty cycle settings.
PM2.5 S&SS
The method’s test phases revealed important performance aspects for each S&SS model. Since the RM and the S&SS devices tested used optical scattering as the working principle, it was expected there would be a high degree of correlation between the RM and the S&SS in Phase 1 – Initial Concentration Ramping (). However, Phase 1 also showed that many S&SS devices on the market (such as Models B, C, and D) show a factor of ∼2 overestimation of PM2.5 concentrations. In addition, even S&SS devices that are generally accurate across most of the PM2.5 concentration range (such as Model A) can still overestimate concentrations by ∼50% at PM2.5 < 15 µg/m3. Despite the accuracy shortcomings, S&SS subjected to this test method demonstrated a high correlation to the RM which would, in principle, allow for the development of a correction algorithm to be applied to their output signal, allowing them to be used for monitoring and management of indoor air quality.
Phase 2 (Effect of T and RH) results provide critical information on T and RH influence on S&SS performance. All S&SS tested were sensitive to temperature changes from 20 °C to 30 °C when RH was held constant, with relative errors typically doubling in magnitude across this temperature range, but beyond 30 °C relative errors did not usually appreciably increase (). It is currently unknown why temperature changes impact relative errors in this way, but one possible cause may be proprietary, sensor-specific, internal algorithms that adjust the PM2.5 concentration based on a manufacturer’s temperature-PM2.5 calibration relationships. Additionally, there was a noticeable increase in relative errors by about a factor of 1.5 when increasing RH from 60% to 80% (). This is expected since particles, especially those composed of inorganic salts, can physically enlarge through moisture uptake, and therefore increase the apparent PM2.5 concentrations. The high RH PM2.5 overestimation observed in S&SS devices has been corroborated by several studies (Di Antonio et al. Citation2018; Jayaratne et al. Citation2018; Malings et al. Citation2020). Thus, it could be important that if such devices are used for indoor air quality monitoring and feedback control then building air conditioning systems should hold T and RH conditions as constant as possible to avoid false changes in PM2.5 concentrations from indoor climate fluctuations unless correction algorithms are applied.
Similarly, Phase 3 (Interferent Testing) revealed that all S&SS models tested were susceptible to interference in their PM2.5 signal due to the presence of coarse particles (). Interestingly, coarse particles in air resulted in a lower reported PM2.5 concentration by all S&SS models compared to what they would have reported in the absence of PMc. Previous studies have also found that PSMD/PMCD affects particle sensor response (Li and Biswas Citation2017; Hagan and Kroll Citation2020). It is not entirely clear why this can happen, but it should be noted that all the S&SS in this study also output a PM10 concentration signal, although analysis of that parameter is outside the scope of this test method. Some possible explanations for why generally coarse particles can have a negative interference effect on S&SS PM2.5 concentration could be (1) a result of internal sensor algorithms that distribute a total optical-scattering signal among a distribution of particle sizes, (2) saturation of the optical sensing system, (3) fine particle agglomeration with larger particles, and (4) the reduced light scattering per unit mass of supermicron particles compared to submicron particles as documented by aerosol instrument manufacturers (TSI Inc Citation2012). The findings from this test method indicate building air control systems should be maintained such that levels of large dust particles are minimized so that they do not interfere with the PM2.5 signals from S&SS devices used for indoor air monitoring and control, such as by installing S&SS downstream of coarse particle filters.
The simulated aging/drift testing phases of this test method indicated that for the S&SS models evaluated, there is a negligible effect from simulated one-year usage on the performance of these devices, at least for PM2.5 concentrations < ∼150 µg/m3, which applies to most indoor environments. Even at concentrations > ∼150 µg/m3 only about a 5–10% change in their reported PM2.5 signal was observed. These results suggest that the S&SS models tested have the potential to provide consistent indoor performance for at least one year.
Limitations
Although the test method presented in this study is the most comprehensive procedure known to date for evaluating PM2.5 S&SS for indoor air monitoring, some limitations prevent all aspects of performance from being gauged.
For a given particle diameter, different chemical compositions can cause different optical-scattering intensities and could therefore cause different responses from optical-scattering S&SS when measuring different particle types. It would be infeasible to test S&SS against all particle types that could exist in an indoor environment (Singer and Delp Citation2018; Wang et al. Citation2020), but a refinement to also expose S&SS in Phase 1 (Initial Concentration Ramping) to an organic polymeric particle type (1 µm polystyrene latex; PSL) was added to this test method after the conclusion of laboratory method development activities. Still, it is recognized that the single inorganic and organic PM2.5 particle types in ASTM D8405 are not representative of all indoor particles. It is also known that S&SS response can be dependent on the particle size distribution (Li and Biswas Citation2017; Hagan and Kroll Citation2020) and thus the specification of monodisperse aerosol populations for PM2.5 evaluation can also be considered a limitation of the method. Additionally, although reducing exposure to submicron particles is critical to improving health outcomes, optical-scattering particle detection techniques are generally insensitive to the fraction of PM2.5 that is smaller than ∼0.3 µm in diameter.
Another limitation is the Phase 3 (Interferent Testing) coarse particle material’s polydispersity. This is due to the PSMD of A4 Coarse Test Dust being broad and still containing a fraction of particles smaller than 2.5 µm in diameter (up to about 5% by volume) per ISO 12103-1. Early attempts at performing Phase 3 (Interferent Testing) using PSL of 5, 7, and 10 µm diameters resulted in the RM not detecting appreciable amounts of particles in the test chamber. The search for other certified, standard reference materials with appreciable amounts of particles larger than 2.5 µm in diameter resulted in ISO 12103-1 A4 Coarse Test Dust being chosen. Should a certified standard reference material with monodisperse (a narrow PSMD/PMCD) particles with a diameter between 2.5 and 10 µm be identified in the future, an update to the test method may be initiated.
Comparison to other protocols
summarizes aspects of ASTM D8405 against those of previously developed protocols for laboratory evaluation of PM2.5 S&SS. Although several academic groups have published studies in which S&SS were tested in chambers and detailed procedures documented (Wang et al. Citation2015; Manikonda et al. Citation2016; Sousan et al. Citation2016; Citation2017; He et al. Citation2020; Li et al. Citation2020; Salimifard et al. Citation2020; Tryner et al. Citation2020), only compares ASTM D8405 against protocols published by testing organizations. There are also S&SS testing protocols for outdoor ambient performance evaluation, but these methods are specifically designed to evaluate S&SS under larger ranges of parameters such as temperature and RH experienced by outdoor sensors; hence, ambient testing protocols are not appropriate for comparison to a test method intended for indoor S&SS.
Table 5. Comparison summary of published protocols specific to laboratory testing of PM2.5 S&SS devices.
AQ-SPEC staff at South Coast AQMD contributed to the development and validation of ASTM D8405, especially as this test method was based on the AQ-SPEC laboratory chamber testing methodologies for air quality sensors measuring criteria pollutants (Polidori et al. Citation2016; Papapostolou et al. Citation2017). This ASTM test method is different from other existing protocols due to the rigorous specifications placed on the testing equipment, such as clearly defined criteria for minimum chamber size, PM2.5 concentration homogeneity, PM2.5 concentration stability, standardized PM source materials, and air purity. While the testing equipment criteria are strict, they help ensure reproducibility across different organizations performing tests. Other laboratory S&SS test protocols do not specify many criteria for testing equipment used.
The testing conditions (such as using a US EPA FEM Class III RM for PM2.5, though it should be noted that the RM is not necessarily used in a manner consistent with FEM requirements; testing S&SS in triplicate; T = 20 °C and RH = 40% base climate conditions; 0-300 µg/m3 concentrations; and testing S&SS in different climate conditions) presented in the ASTM test method are close to those of other protocols (). However, the RESET test procedure (RESET Citation2018) differs significantly from most other protocols in that it does not use a certified RM, requires 5 S&SS replicates, tests S&SS at slightly higher T and RH base conditions, and does not test S&SS at different climate conditions.
The ASTM test method is the only process for evaluating particle size effects on S&SS performance due to the presence of coarse particles, as well as the only procedure that subjects S&SS to power loss and recovery tests. The total testing duration is comparable to other protocols. Both EPA (Duvall et al. Citation2018) and ASTM test methods probe S&SS drift due to aging effects, but the ASTM test method is faster than the EPA method since S&SS aging is rapidly simulated using chamber-induced temperature cycling.
It is important to note that the ASTM test method only evaluates S&SS performance, and neither specifies S&SS performance targets/standards/criteria nor is there any scoring or grading system for S&SS devices. The laboratory component of the MCERTS testing procedure (United Kingdom Environment Agency Citation2017) only assigns a pass/fail grade for device flow rate constancy and leak tightness. The RESET test procedure assigns a letter grade of A/B/C to an S&SS, yet the RESET test procedure is only applicable to S&SS devices receiving their “B” grade. In addition, their method does not probe for performance aspects such as climate, aging/drift, and recovery from power loss, and there is uncertainty as to whether the RESET test procedure results are reproducible since strict requirements on testing equipment and particle sources are not specified.
Conclusions
This paper describes the development of the new and comprehensive ASTM D8405 laboratory test method for PM2.5 S&SS intended for indoor air applications. Compared to other laboratory protocols, ASTM D8405 has stricter specifications and procedures intended to maximize reproducibility across testing bodies and investigates more performance aspects such as interference from coarse particles and recovery in performance from power loss. Sample results from testing anonymized S&SS devices during method development show that ASTM D8405 can reveal important performance characteristics of various models of S&SS devices.
Supplemental Material
Download MS Word (476.1 KB)Acknowledgments
The authors would like to thank the many ASTM D22.05 subcommittee members and their colleagues for valuable comments during the balloting process that resulted in a refined and clear test method: Mike Brisson, Andrea Clements, Ian Cull, Rachelle Duvall, Richard Fox, Martin Harper, Geoff Henshaw, Al Hodgson, Sue Kimbrough, Paul Kremer, Hal Levin, Xiaoyu Liu, Stephany Mason, William Mills, Bud Offerman, Andy Persily, Dustin Poppendieck, John Saffell, Brett Singer, and Ashley Wiand. Additional appreciation is extended to South Coast AQMD Executive Management (Wayne Nastri and Jason Low) for the internal support to pursue this work. Joe Nebbia of Newport Partners, LLC and Mike Moore of Stator, LLC (formerly also at Newport Partners, LLC) are thanked for their significant contributions as test method reviewers and intermediaries between the ASTM D22.05 subcommittee and the laboratory activities. This work was conducted with Newport Partners, LLC through a collaborative agreement with the U.S. Department of Energy.
Data availability statement
The authors confirm that the data supporting the findings of this study are available within the article [and/or] its supplementary materials.
Additional information
Funding
References
- ACGIH®. 2019. 2019 TLVs® and BEIs based on the documentation of the threshold limit values for chemical substances and physical agents & biological exposure indices. Cincinnati, (OH): ACGIH Signature Publications.
- ASTM International. 2021. Standard Test Method for Evaluating PM2.5 Sensors or Sensor Systems Used in Indoor Air Applications. West Conshohocken (PA): ASTM International Press.
- Australia Department of the Environment. 2021. National environment protection (ambient air quality) measure. [accessed 2021 Aug 12]. https://www.legislation.gov.au/Details/F2021C00475.
- Barkjohn KK, Bergin MH, Norris C, Schauer JJ, Zhang Y, Black M, Hu M, Zhang J. 2020. Using low-cost sensors to quantify the effects of air filtration on indoor and personal exposure relevant PM2.5 concentrations in Beijing, China. Aerosol Air Qual Res. 20(2):297–313. DOI: 10.4209/aaqr.2018.11.0394
- Barkjohn KK, Norris C, Cui X, Fang L, Zheng T, Schauer JJ, Li Z, Zhang Y, Black M, Zhang J, et al. 2021. Real-time measurements of PM2.5 and ozone to assess the effectiveness of residential indoor air filtration in Shanghai homes. Indoor Air. 31(1):74–87. DOI: 10.1111/ina.12716
- Canadian Council of Ministers of the Environment. 2020. CAAQS. [accessed 2021 Aug 12]. https://ccme.ca/en/air-quality-report.
- Choi DH, Kang DH. 2017. Infiltration of ambient PM2.5 through building envelope in apartment housing Units in Korea. Aerosol Air Qual Res. 17(2):598–607. DOI: 10.4209/aaqr.2016.06.0287
- Definition and Procedure for the Determination of the Method Detection Limit, 40 C.F.R. Part 136 App. B. 2017.
- Deutsche Forschungsgemeinschaft. 2015. List of MAK and BAT Values 2015. Bonn, Germany: Wiley-VCH Verlag GmbH & Co. KGaA.
- Di Antonio A, Popoola OAM, Ouyang B, Saffell J, Jones RL. 2018. Developing a relative humidity correction for low-cost sensors measuring ambient particulate matter. Sensors. 18(9):2790. DOI: 10.3390/s18092790
- Duvall RM, Clements AL, Hagler G, Kamal A, Kilaru V, Goodman L, Frederick S, Barkjohn KK, VonWald I, Greene D, et al. 2018. Performance Testing Protocols, Metrics, and Target Values for Fine Particulate Matter Air Sensors: Use in Ambient, Outdoor, Fixed Site, Non-Regulatory Supplemental and Informational Monitoring Applications. In: U.S. EPA Office of Research and Development, editor. Washington, D.C.
- European Parliament and Council. 2008. Directive 2008/80/EC - on ambient air quality and cleaner air for Europe.
- Hagan DH, Kroll JH. 2020. Assessing the accuracy of low-cost optical particle sensors using a physics-based approach. Atmos Meas Tech. 13(11):6343–6355. DOI: 10.5194/amt-13-6343-2020
- He M, Kuerbanjiang N, Dhaniyala S. 2020. Performance characteristics of the low-cost Plantower PMS optical sensor. Aerosol Sci Technol. 54(2):232–241. DOI: 10.1080/02786826.2019.1696015
- Hoek G, Krishnan RM, Beelen R, Peters A, Ostro B, Brunekreef B, Kaufman JD. 2013. Long-term air pollution exposure and cardio-respiratory mortality: a review. Environ Health. 12(1):43. DOI: 10.1186/1476-069X-12-43
- Hong Kong Environmental Protection Department. 2021. Review of air quality objectives. [updated June 28; accessed 2021 Aug 12]. https://www.epd.gov.hk/epd/english/environmentinhk/air/air_quality_objectives/aqoreview2016.html.
- Hong Kong Special Administrative Region. 2014. Cap. 311 - Air Pollution Control Ordinance. [updated January; accessed 2021 Aug 12]. https://www.elegislation.gov.hk/hk/cap311!en-zh-Hant-HK.
- Hong Kong Special Administrative Region. 2021. Ordinance No. 6 of 2021 - Air Pollution Control (Amendment) Ordinance 2021. [updated 2021 Aug 12; accessed 2021 Aug 12]. https://www.elegislation.gov.hk/hk/2021/6!en.
- Japan Ministry of the Environment. 2009. Environmental Quality Standards in Japan - Air Quality. [updated September 9; accessed 2021 Aug 12]. https://www.env.go.jp/en/air/aq/aq.html.
- Jayaratne R, Liu X, Thai P, Dunbabin M, Morawska L. 2018. The influence of humidity on the performance of a low-cost air particle mass sensor and the effect of atmospheric fog. Atmos Meas Tech. 11(8):4883–4890. DOI: 10.5194/amt-11-4883-2018
- Klepeis NE, Nelson WC, Ott WR, Robinson JP, Tsang AM, Switzer P, Behar JV, Hern SC, Engelmann WH. 2001. The National Human Activity Pattern Survey (NHAPS): a resource for assessing exposure to environmental pollutants. J Expo Anal Environ Epidemiol. 11(3):231–252. DOI: 10.1038/sj.jea.7500165
- Lewis A, Edwards P. 2016. Validate personal air-pollution sensors. Nature. 535(7610):29–31. DOI: 10.1038/535029a
- Li J, Biswas P. 2017. Optical characterization studies of a low-cost particle sensor. Aerosol Air Qual Res. 17(7):1691–1704. DOI: 10.4209/aaqr.2017.02.0085
- Licina D, Tian Y, Nazaroff WW. 2017. Inhalation intake fraction of particulate matter from localized indoor emissions. Build Environ. 123:14–22. DOI: 10.1016/j.buildenv.2017.06.037
- Li D, Li Y, Li G, Zhang Y, Li J, Chen H. 2019. Fluorescent reconstitution on deposition of PM2.5 in lung and extrapulmonary organs. Proc Natl Acad Sci U S A. 116(7):2488–2493. DOI: 10.1073/pnas.1818134116
- Li J, Mattewal SK, Patel S, Biswas P. 2020. Evaluation of nine low-cost-sensor-based particulate matter Monitors. Aerosol Air Qual Res. 20(2):254–270. DOI: 10.4209/aaqr.2018.12.0485
- Malings C, Tanzer R, Hauryliuk A, Saha PK, Robinson AL, Presto AA, Subramanian R. 2020. Fine particle mass monitoring with low-cost sensors: Corrections and long-term performance evaluation. Aerosol Sci Technol. 54(2):160–174. DOI: 10.1080/02786826.2019.1623863
- Manikonda A, Zikova N, Hopke PK, Ferro AR. 2016. Laboratory assessment of low-cost PM monitors. J Aerosol Sci. 102:29–40. DOI: 10.1016/j.jaerosci.2016.08.010
- McCormack MC, Breysse PN, Matsui EC, Hansel NN, Williams DA, Curtin-Brosnan J, Eggleston P, Diette GB. 2009. Home particle concentrations and childhood asthma morbidity. Environ Health Perspect. 117(2):294–298.
- McDuffie E, Martin R, Yin H, Brauer M. 2021. Global burden of disease from major air pollution sources (GBD MAPS): A global approach. Research Report 210. Boston (MA): Health Effects Institute.
- Mineral Resources, 30 C.F.R. Part 57. 2019.
- Occupational Safety and Health Administration. 2019. OSHA Annotated Table Z-1 from Permissible Exposure Limits – Annotated Tables. [updated October 18; accessed 2021 Aug 12]. https://www.osha.gov/annotated-pels/table-z-1.
- Papapostolou V, Zhang H, Feenstra BJ, Polidori A. 2017. Development of an environmental chamber for evaluating the performance of low-cost air quality sensors under controlled conditions. Atmos Environ. 171:82–90. DOI: 10.1016/j.atmosenv.2017.10.003
- People’s Republic of China Ministry of Environmental Protection. 2021. GB 3095-2012: Ambient Air Quality Standards. [updated February 29; accessed 2021 Aug 12]. http://english.mee.gov.cn/Resources/standards/Air_Environment/quality_standard1/201605/W020160511506615956495.pdf.
- Polidori A, Papapostolou V, Zhang H. 2016. Laboratory evaluation of low-cost air quality sensors: Laboratory setup and testing protocol. [updated August; accessed 2021 Aug 13]. https://www.aqmd.gov/docs/default-source/aq-spec/protocols/sensors-lab-testing-protocol6087afefc2b66f27bf6fff00004a91a9.pdf.
- Pun VC, Kazemiparkouhi F, Manjourides J, Suh HH. 2017. Long-term PM2.5 exposure and respiratory, cancer, and cardiovascular mortality in older US adults. Am J Epidemiol. 186(8):961–969. DOI: 10.1093/aje/kwx166
- RESET. 2018. RESET air test procedure for accredited monitors v2.0. [accessed 2021 Aug 13]. https://www.reset.build/download/RESET_Standard_v2_2_7_Monitor%20Test%20Procedure%20180921.pdf.
- Salimifard P, Rim D, Freihaut JD. 2020. Evaluation of low-cost optical particle counters for monitoring individual indoor aerosol sources. Aerosol Sci Technol. 54(2):217–231. DOI: 10.1080/02786826.2019.1697423
- Siciliano B, Dantas G, da Silva CM, Arbilla G. 2020. The updated Brazilian National Air Quality Standards: A critical review. J Braz Chem Soc. 31(3):523–535. DOI: 10.21577/0103-5053.20190212
- Singapore National Environment Agency. 2021. Air quality targets. [updated February 15; accessed 2021 Aug 12]. https://www.nea.gov.sg/our-services/pollution-control/air-pollution/air-quality.
- Singer BC, Delp WW. 2018. Response of consumer and research grade indoor air quality monitors to residential sources of fine particles. Indoor Air. 28(4):624–639. DOI: 10.1111/ina.12463
- Snyder EG, Watkins TH, Solomon PA, Thoma ED, Williams RW, Hagler GSW, Shelow D, Hindin DA, Kilaru VJ, Preuss PW. 2013. The changing paradigm of air pollution monitoring. Environ Sci Technol. 47(20):11369–11377. DOI: 10.1021/es4022602
- Sousan S, Koehler K, Hallett L, Peters TM. 2017. Evaluation of consumer monitors to measure particulate matter. J Aerosol Sci. 107:123–133. DOI: 10.1016/j.jaerosci.2017.02.013
- Sousan S, Koehler K, Thomas G, Park JH, HIllman M, Halterman A, Peters TM. 2016. Inter-comparison of low-cost sensors for measuring the mass concentration of occupational aerosols. Aerosol Sci Technol. 50(5):462–473. DOI: 10.1080/02786826.2016.1162901
- South Coast AQMD AQ-SPEC. 2021. Summary PM Tables & Reports. [accessed 2021 Aug 13]. http://www.aqmd.gov/aq-spec/evaluations/summary-pm.
- Trnka D. 2020. Policies, regulatory framework and enforcement for air quality management: The case of Korea - Environment Working Paper No. 158. Organisation for Economic Co-operation and Development.
- Tryner J, Mehaffy J, Miller-Lionberg D, Volckens J. 2020. Effects of aerosol type and simulated aging on performance of low-cost PM sensors. J Aerosol Sci. 150:105654. DOI: 10.1016/j.jaerosci.2020.105654
- TSI Inc. 2012. Measuring total suspended particulates (TSP) with aerosol photometers: Application Note ITI-058.
- Underwood E. 2017. The polluted brain. Science. 355(6323):342–345. DOI: 10.1126/science.355.6323.342
- United Kingdom Environment Agency. 2017. Performance Standards for Indicative Ambient Particulate Monitors: Version 4.
- United States Environmental Protection Agency. 2021. NAAQS Table from Criteria Air Pollutants. [updated February 10; accessed 2021 Aug 12]. https://www.epa.gov/criteria-air-pollutants/naaqs-table.
- Wang Z, Delp WW, Singer BC. 2020. Performance of low-cost indoor air quality monitors for PM2.5 and PM10 from residential sources. Build Environ. 171:106654. DOI: 10.1016/j.buildenv.2020.106654
- Wang Y, Li J, Jing H, Zhang Q, Jiang J, Biswas P. 2015. Laboratory evaluation and calibration of three low-cost particle sensors for particulate matter measurement. Aerosol Sci Technol. 49(11):1063–1077. DOI: 10.1080/02786826.2015.1100710
- World Health Organization. 2021. WHO global air quality guidelines: Particulate matter (PM2.5 and PM10), ozone, nitrogen dioxide, sulfur dioxide and carbon monoxide. Geneva, Switzerland: WHO Press.
- Zhang H, Srinivasan R. 2020. A systematic review of air quality sensors, guidelines, and measurement studies for indoor air quality management. Sustainability. 12(21):9045. DOI: 10.3390/su12219045