
Abstract
The NIOSH Pocket Guide to Chemical Hazards is a trusted resource that displays key information for a collection of chemicals commonly encountered in the workplace. Entries contain chemical structures—occupational exposure limit information ranging from limits based on full-shift time-weighted averages to acute limits such as short-term exposure limits and immediately dangerous to life or health values, as well as a variety of other data such as chemical-physical properties and symptoms of exposure. The NIOSH Pocket Guide (NPG) is available as a printed, hardcopy book, a PDF version, an electronic database, and a downloadable application for mobile phones. All formats of the NIOSH Pocket Guide allow users to access the data for each chemical separately, however, the guide does not support data analytics or visualization across chemicals. This project reformatted existing data in the NPG to make it searchable and compatible with exploration and analysis using a web application. The resulting application allows users to investigate the relationships between occupational exposure limits, the range and distribution of occupational exposure limits, and the specialized sorting of chemicals by health endpoint or to summarize information of particular interest. These tasks would have previously required manual extraction of the data and analysis. The usability of this application was evaluated among industrial hygienists and researchers and while the existing application seems most relevant to researchers, the open-source code and data are amenable to modification by users to increase customization.
Introduction
The NIOSH Pocket Guide to Chemical Hazards (NPG) (NIOSH Citation2007) is a print and electronic resource that provides concise general and hazard information useful to and trusted by industrial hygienists and other occupational safety and health professionals concerned with chemical exposures in the workplace. The NPG contains information about more than 600 chemicals and substance groupings commonly found in the work environment. It also contains NIOSH recommended exposure limits (RELs) and Occupational Safety and Health Administration (OSHA) permissible exposure limits (PELs). These values are useful for designing and evaluating the need for exposure control strategies and risk management plans (Borak and Brosseau Citation2015).
The NPG is used by employers, industrial hygienists, safety professionals, and others with an interest in chemical exposures in the workplace. In 2021, there were 1,341,713 page downloads of the reference guide, and the NIOSH Pocket Guide mobile application (app) (https://www.cdc.gov/niosh/npg/mobilepocketguide.html) was downloaded 85,356 times. In-depth information about the content of the Pocket Guide can be found on the guide’s introduction webpage (NIOSH Citation2016b).
The major strength of the NPG is having a trusted and familiar source of key information about workplace chemicals in one easy-to-use and concise format. Useful sections for each chemical entry include physical/chemical properties, NIOSH, and OSHA occupational exposure limits (OELs), measurement methods, personal protective equipment (PPE) recommendations, respirator recommendations, exposure routes, symptom information, and first-aid procedures. In addition, occupational carcinogens, and chemicals with notations for dermal hazards are identified.
Although the NPG contains a wealth of information in an electronic format, it has been presented in a static form. Thus, it has not been possible to compare chemicals individually or as a group or visualize trends in the database without manual data extraction. Also, more detailed, useful aspects of the current information categories are absent from the NPG. For example, details such as the date a REL was set would help users determine if the recommendations are consistent with other OELs and with more contemporary health effects studies (Deveau et al. Citation2015). Information summarizing the health basis of the recommendations would allow a more informed use of the OEL and assist in risk management and medical surveillance activation pertinent to the specific chemical hazards. The information in the NPG, while widely used, does not contain all of the chemical hazard data that may be beneficial to an industrial hygienist or researcher, such as the Globally Harmonized System of Classification and Labeling of Chemicals (GHS) codes and categories, the American Conference of Governmental Industrial Hygienists (ACGIH®) Threshold Limit Values (TLVs®), or the Occupational Alliance for Risk Science (OARS) Workplace Environmental Exposure Levels (WEELs), and is limited to information available from NIOSH and OSHA.
This project sought to expand the usefulness, particularly in analyses of NPG data, by developing an open-source web application that derives its data directly from the NPG database, supplementing the database with additional publicly available data from NIOSH criteria documents (NIOSH Citation1996, Citation2013), current NIOSH intelligence bulletins (NIOSH Citation2011), the 1988 PEL project documentation (NIOSH Citation1988), and the NIOSH compendium of policy documents and statements (NIOSH Citation1992). Existing data in the NPG was reformatted to make it searchable and compatible for analysis using a web application built with the R-Shiny statistical package (Chang et al. Citation2022). Additional information about each NIOSH REL was added, including the health basis and date of establishment. The intent was to provide a tool for industrial hygienists and occupational safety and health researchers to quickly visualize trends across the database, separate chemicals by carcinogen designation or health basis, and conduct other analyses of interest.
The objective of this application is to provide an open-source web-based tool that will allow analysis, visualization, and specialized sorting of the wealth of data residing in the NPG and other publicly available NIOSH documents.
Methods
Data source
NIOSH data were used to build this application by transferring information from the web version of the NPG to an Access database, which was then exported into an Excel spreadsheet. Columns for the NIOSH RELs, OSHA PELs, and immediately dangerous to life or health values (IDLH) fields were expanded to provide a worksheet that could be used for analyses. As part of the development of the application, the variables in were separated into independent columns to preserve all the information in the NIOSH REL, OSHA PEL, and IDLH fields, and to separate variables for data analyses. It should be noted that while some values, standards, and health endpoint classifications have been updated, the most recent version of the NPG database includes revisions up to 2007.
Table 1. Variable names and definitions for the expanded columns representing the NIOSH REL variable in the original spreadsheet.
Some particulate substances had two RELs or PELs—one representing total (or inhalable) particulate and the other representing respirable particulate. Since the database is divided into particulate and non-particulate substances and, for most analyses, it is desirable to have a single OEL to compare with other chemicals, the default REL and PEL used in data visualizations for particulate chemicals were the total or inhalable REL or PEL.
Additional data
In addition to the data in the NPG Excel spreadsheet, three other pieces of information about each REL were added: the year of publication, its source, and its health basis. These variables were obtained from the 1992 NIOSH compendium of policy documents and statements (NIOSH Citation1992), individual NIOSH criteria documents for substances published since 1992 (NIOSH Citation1996, Citation2011, Citation2013), and the 1988 PEL project documentation (NIOSH Citation1988), which describes the health bases of changing all the RELs established in 1988 as part of that joint policy effort with OSHA.
Quality assurance/data checking
The expanded spreadsheet was checked using double entry with two independent operators. The data sets were then compared, and discrepancies were resolved. This is a draft version of the data and is not authoritative, but instead used to understand what could be done.
Application development
The NIOSH Pocket Guide Data Visualization Tool application was developed using R (R Core Team Citation2023) and RStudio (RStudio Team Citation2020). The Shiny package (Chang et al. Citation2022) was used to create the application and the R tidyverse packages (Wickham et al. Citation2019), particularly readxl (Wickham and Bryan Citation2023) were used to clean data and create graphs. The application theme was set using Shiny themes (Chang Citation2021) and ggthemes (Arnold Citation2021). Data tables were produced using the DT package (Xie et al. Citation2023), and plots were created using the ggplot2 package (Wickham Citation2016). The prototype version of this application is currently hosted on Shinyapps.io at https://johnbailer.shinyapps.io/NIOSH-Pocket-Guide/.
Early prototypes for this project were produced by Miami University students in a data visualization course. The ideas from those projects were consolidated and refined into an initial version of the application, which was tested by 14 industrial hygiene and occupational health professionals (beta-testers) representing a range of skills. Further information about the 14 professionals is in the Acknowledgments. The beta testers were asked to launch the application and respond to the questions in . They were also asked to provide feedback on the web application’s functionality, content, and any other changes they would recommend. The responses to these questions from the beta testers (not included) were used to inform and revise the application described here. For example, revisions were made in some tab names, as well as tab order and content, based on this feedback.
Table 2. Review questions for evaluating web application features and functionality.
Results
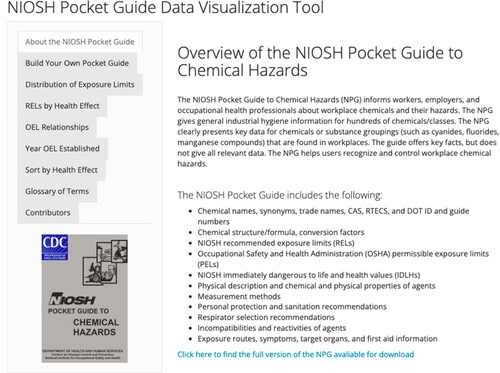
The prototype NIOSH Pocket Guide Data Visualization Tool application (hereafter referred to as the NPG web application) (https://johnbailer.shinyapps.io/NIOSH-Pocket-Guide/) contains nine tabs that allow the user to explore different information or analyses. Upon opening the application, the “About the NIOSH Pocket Guide” tab appears on the top left (). This tab describes the NIOSH Pocket Guide to Chemical Hazards and informs the user of the specific data values it contains. This tab also includes a picture of the hard copy of the NPG and a link to where the user can download a digital version. Throughout this discussion, we will consider how an occupational safety and health practitioner and a researcher exploring OELs might use the NPG web application.
Figure 1. Landing page and top tab for the web application, revealing available tabs and an NPG overview.
Build Your Own Pocket Guide
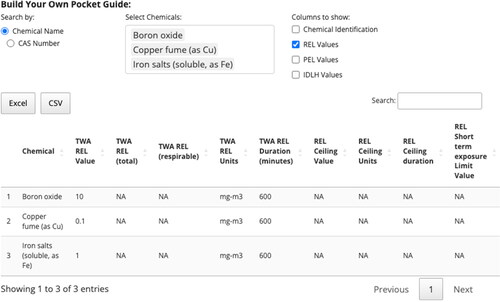
The second tab in the NPG web application is the “Build Your Own Pocket Guide” tab. Many reviewers described this tab as the most useful one for employers and occupational safety and health professionals. This tab allows a user to sort through the NPG database to create a customized version of the guide with only chemicals important to the user. A data table is produced on the page by selecting the chemicals of interest (under “Select Chemicals”), and the variables of interest (under “Columns to Show”). This table can be downloaded as an Excel or CSV file by selecting the appropriate button above the table.
An occupational safety and health professional from a manufacturing plant, for example, may want to view the RELs of three chemicals found in their plant, boron oxide, copper fume, and iron salts. Instead of paging through the NPG or searching the electronic version, the user can select these three chemicals and export data to an Excel or CSV file that contains only the relevant information about the RELs. An example of this output is shown in with information about each of the three chemicals. A customized Pocket Guide makes it easier for the user to focus on their potential hazards of concern. From the downloaded Excel or CSV file, the user can print or distribute the information to other professionals or employees. In addition to filtering the data by specific chemicals, the user also has the option to select the information displayed. Using the Visualization Tool will save safety and health professionals time and effort by focusing on only the pertinent information.
Figure 2. Producing a customized Pocket Guide from user-specified chemicals.
Distribution of Exposure Limits
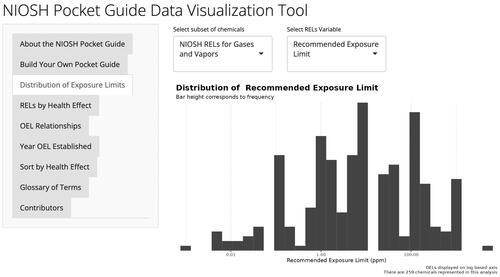
The distribution of OELs can be explored in the “Distribution of Exposure Limits” tab. On this tab, the user selects one of four data subsets: (1) NIOSH RELs for gases and vapors; (2) NIOSH RELs for particulates; (3) OSHA PELs for gases and vapors; or (4) OSHA PELs for particulates. After selecting a subset of data, the user chooses which variable they would like to analyze. The options for visualizing the distributions are the REL or PEL, the ceiling value, the STEL, and the IDLH values. After these selections, the distribution of the selected variable is displayed in a histogram.
A researcher may want to compare the distribution of OELs within the NPG to other sources of chemical information. To do this, the researcher could select NIOSH RELs for gases and vapors and the recommended exposure limit, see for example. From this figure, it is clear that the majority of RELs in the NPG fall between 1 and 100 parts per million. Using this tab, researchers can analyze the distributions of OELs to find the typical range of OELs for gases and vapors.
Figure 3. Distribution of RELs (log10 scale).
RELs by health effect
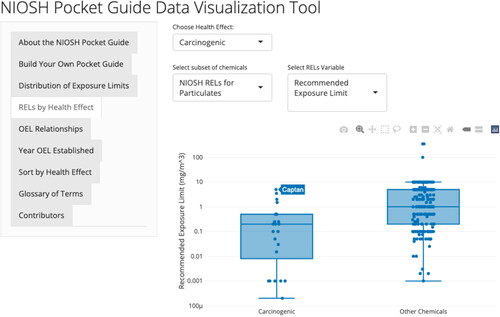
The “RELs by Health Effect” tab allows the user to investigate specific health effects. The user selects a specific health endpoint, the subset of data (gases and vapors or particulates), and then the value of interest (REL, ceiling value, or short-term exposure limit). After the variables are selected, the application creates two boxplots, one containing chemicals classified as having the health effect and the other containing chemicals that do not. This tool allows for the comparison of exposure limits based on the health effects of the chemicals. When hovering over specific data points within the graphs, the user can see which chemical corresponds to each data point, implemented using the R plotly package (Sievert Citation2020). It is important to note that the health effects in this database are those associated with the NIOSH REL documentation and do not necessarily reflect the health effects that might be described in the OSHA Hazard Communication standard or the Globally Harmonized System for Classification and Labeling of Chemicals (GHS).
shows boxplots produced when the data selected were NIOSH RELs for particulates, the variable was the RELs, and NIOSH carcinogen designation is shown. A researcher may want to determine the identity of the outliers found in the carcinogen group. By moving the tooltip of the mouse cursor arrow to identify points, a researcher could see that captan, di-sec octyl phthalate, carbon black, and dinitrotoluene are potential outliers with high RELs that fall in the upper tail of the REL distribution. Further research questions may follow to find why these four chemicals have such high RELs compared with other carcinogenic particulates.
Figure 4. Boxplots of particulate RELs comparing carcinogens and noncarcinogens.
This tab does not contain the options to plot OSHA PELs based on health effects because the health effect bases of the OSHA PELs were not available in the data included here. The IDLH value is also not included as a graphing option based on health effect status because the IDLH reflects acute hazards and may not be directly associated with the health bases included in the database.
OEL relationships
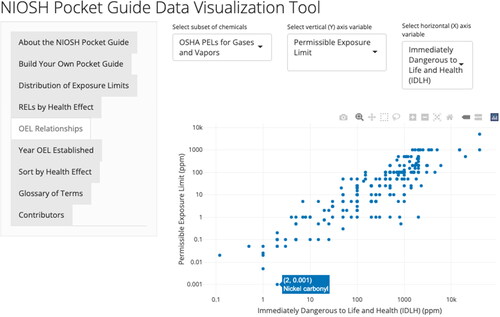
Scatterplots visualizing the relationships between selected OELs are produced in the “OEL Relationships” tab. After selecting the subset of chemicals, users may choose which variables they would like to compare. Options for the x- (horizontal) and y-axes (vertical) are the REL or PEL, ceiling value, STEL, and IDLH value. A scatterplot is created where a user can hover the mouse cursor over the chemical names associated with selected points. As with the illustration from , when hovering over a point, the chemical name appears so the user can easily identify any outliers or specific data points of interest.
One observation resulting from considering the graph of PEL values vs. IDLH values displayed in is that there is a strong positive, linear (on a log scale) trend where a higher PEL corresponds with a higher IDLH. This is consistent with the understanding that increasing the acute potency of a chemical generally corresponds with increasing chronic potency of the same chemical. However, there is also a good deal of variability apparent in this graph which could be explored further by comparing other variables and identifying outliers of interest.
Figure 5. Scatterplots of PELs vs. IDLH for particulates.
Analyzing Year OEL Established
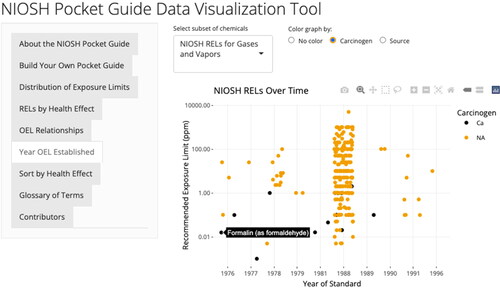
A timeline that summarizes when RELs were established can be found in the “Year OEL Established” tab (see with an illustration for gases and vapors). To customize the graph, the user can select RELs for gases and vapors or particulates. Data are not included for the PELs set by OSHA because they were established on a different timeline not included in the data available here. Readers are referred to the OSHA annotated Table Z for additional information (https://www.osha.gov/annotated-pels/table-z-1). The scatterplot displays the year the REL was set. This analysis can further be customized to color the graph based on carcinogen designation or the source of the REL. Sources for the RELs include individual NIOSH criteria documents, NIOSH current intelligence bulletins, and the NIOSH/OSHA PEL/REL update of 1988 (most NIOSH RELs were established at this time). This tab would be useful for a researcher to examine how long ago a REL was established and potentially find RELs that need to be updated.
Figure 6. Years when RELs were established.
Sort by Health Effect
The “Sort by Health Effect” tab produces a data table that includes categories of health effects such as: carcinogenic, developmental and/or reproductive toxicity, systemic target organ toxicity (STOT), acute toxicity, genotoxicity, skin effects, skin sensitization, respiratory sensitization, and eye irritation/damage. STOT is further divided into neurological, lung, liver, cardiac, blood, and other toxicities. These designations are from the documentation supporting the NIOSH REL and do not necessarily correspond with the OSHA Hazard Communication Rule or the GHS hazard classifications. Since many of the NIOSH RELs were set years ago, this information may not align with the current understanding of the toxicity of the chemical.
The user can select a health category, and a data table is produced containing those chemicals with specific toxicity. The table includes the chemicals that are classified into the selected category and their relevant REL values. A chemical with multiple health effect designations can be found in each of the corresponding health effect tables. In addition, the user can add specific health information to the table by clicking in the “add specific health information” box.
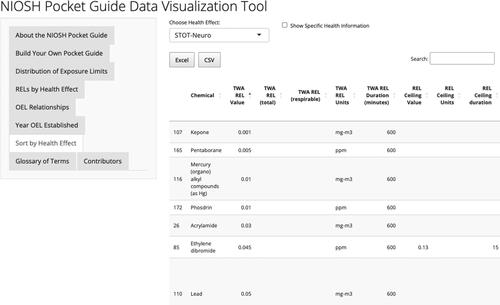
For an occupational researcher who wants to find all the chemicals identified as causing neurological health effects, the procedure would be to select STOT-Neuro. shows the data table that would be created if STOT-Neuro was selected and the “add specific health information” was clicked. The user is then able to download the table into an Excel or CSV for further analysis. One value of this type of analysis is in searching for other chemicals that have OELs based on an endpoint of interest for a deeper review of the precedent set in interpreting related sets of health endpoint findings. This can support the rationale for new OELs and hazard assessments.
Figure 7. Table of OELs for chemicals associated with a neurological outcome, sorted by TWA REL value.
Discussion
The prototype NIOSH Pocket Guide Data Visualization Tool was created to provide workers and researchers with a resource to quickly access information and analyze data found within the NPG. It is important to note that this Tool is not a NIOSH product but a collaboration using open-source software to demonstrate the utility of building an interface to support analyses of this database. The code and the data are available as part of the Supplemental Materials associated with this paper. There is a wealth of trusted information contained in the Pocket Guide—the OELs from both NIOSH and OSHA, occupational carcinogen designations, dermal hazard designations, and more. The NPG Visualization web application helps unpack this information and facilitates user-defined investigations of this resource.
The ability to put together a “customized Pocket Guide” focused just on chemicals of interest provides each user with access to critical information without wading through or searching a large document or database. In addition to this utility, in many cases, a comparative analysis can be done to support occupational hazard assessments. Visualizing the relationship between the REL value and the carcinogen designation demonstrates that carcinogens typically are associated with lower RELs than chemicals that have not been identified as carcinogens, however, substantial overlaps of the distributions of RELs exist. With the addition of the description of the basis for each REL and the year each was established, the database became even more useful. Sorting chemicals by health endpoint or identifying which health endpoints are important to the user in combination with the relevant OELs can aid in decisions related to substitution and risk management.
This tool is designed to be useful for occupational safety and health professionals and researchers. However, more could be done. For example, a comparison of chemicals by physical/chemical properties and health endpoint or REL may be informative. A future analysis might include a comparison of the Department of Transportation hazard codes with OELs. One of the reasons this web application code is provided along with an open source database is to allow researchers to modify the application to facilitate custom analyses of interest or to supplement these data with other information and/or to enhance features in this application.
Moving forward, the investigators will focus on including additional publicly available data and updating the source data. Additional analyses and comparisons may also be designed. One modification that has garnered some support among reviewers is to construct a “custom Pocket Guide” with only the chemicals of interest and make the visualization options in the app available for the subset of data of interest. In addition, the authors will be evaluating the use and customization of the code to determine its utility for the larger occupational safety and health community.
Limitations
One limitation of this project includes restricting the data to freely available NIOSH sources. Much of the NIOSH chemical data included has not been updated for many years. Some of the data does not reflect current understanding of the toxicity or carcinogenicity of chemical hazards.
Another limitation was the necessary choices inherent in visualizing the data when more than one REL existed for a single chemical. This happened typically when a chemical was particulate in nature and had both a total REL and a respirable REL. When distributions were visualized, multiple entries for particulate chemicals would skew the results, so the decision was made to consistently use only the total REL to represent the chemical in the distributions. While an industrial hygienist might be most interested in the respirable REL, for purposes of the distribution analysis, consistent use of the total REL did not significantly change the shape of the distribution. In the custom Pocket Guide function, both RELs would be available to the user.
Conclusion
The NPG has been an important reference document for 50 years. Its wealth of information has proved a useful reference for field industrial hygienists, but the uses of these data could include much more. In this application, the data in the NIOSH Pocket Guide can be accessed, compared, and visualized in ways that are useful to researchers and provides a customizable platform for users. The open-source format will allow additional innovation and further the utility of this information for occupational safety and health research.
All the data included in this application were from NIOSH sources—the NIOSH Pocket Guide database, the compendium of policy documents and statements (1992), the 1988 PEL project documentation, chemical-specific criteria documents, and current intelligence bulletins. The database used in this type of application could be customized and expanded to include additional trusted data sources. For example, comparisons with U.S. EPA IRIS reference concentrations or inhalation unit risks, EPA TSCA existing chemicals exposure limits (ECELs), the Occupational Alliance for Risk Science workplace environment exposure levels (WEELs), or other occupational or environmental exposure limits or risk estimates would be possible (Waters et al. Citation2015). Users could also modify the code in the app to utilize proprietary or other data of interest to them.
This application provides NIOSH data in a practical format amenable to improving understanding of the health impacts of occupational exposures. As additional information becomes available, it is hoped that this tool will increase in utility, encourage innovation, and be useful in setting priorities for the development of OELs and the exploration of new research questions in occupational safety and health.
Disclaimer
The findings and conclusions in this report are those of the author(s) and do not necessarily represent the official position of the National Institute for Occupational Safety and Health, Centers for Disease Control and Prevention.
Supplemental Material
Download PNG Image (37.2 KB)
Supplemental Material
Download MS Excel (154.3 KB)Supplemental Material
Download MS Excel (71 KB)Acknowledgments
We would like to thank Yongsil Woo, Ibrahim Sanusi, Qin Zhang, Elliot Maceda, and Xiantong Liu of Miami University for their early prototype application examples. We also would like to thank Melissa Edmonson, Paula Grubb, Sara Tamers, Molly Leshner, Krystin Carlson, Barbara MacKenzie, Stephen Gilbert, Sudha Pandalai, Jerald Ovesen, Shirisha Chittiboyina, Jay Vietas, Laura Hodson, Nathan Drew, and James Couch from the Risk Evaluation Branch and the Emerging Technologies Branch within the Division of Science Integration at NIOSH for providing user testing and feedback for this application.
Data availability
The data used in this study were derived from the NIOSH Pocket Guide to Chemical Hazards at https://www.cdc.gov/niosh/npg/default.html, the 1988 OSHA PEL Project documentation at https://www.cdc.gov/niosh/pel88/pelstart.html, the NIOSH Recommendations for occupational safety and health: compendium of policy documents and statements (1992) at https://www.cdc.gov/niosh/docs/92-100/pdfs/92-100.pdf?id=10.26616/NIOSHPUB92100, and the following NIOSH documents: NEG and NIOSH basis for an Occupational Health Standard: 2-diethylaminoethanol at https://www.cdc.gov/niosh/docs/96-104/pdfs/96-104.pdf?id=10.26616/NIOSHPUB96104; Current intelligence bulletin 64: coal mine dust exposures and associated health outcomes: a review of information published since 1995 at https://www.cdc.gov/niosh/docs/2011-172/pdfs/2011-172.pdf; and Criteria for a recommended standard: occupational exposure to hexavalent chromium at https://www.cdc.gov/niosh/docs/2013-128/pdfs/2013_128.pdf. Excel spreadsheets containing the data are available on request from the corresponding author
Disclosure statement
No potential conflict of interest was reported by the author(s).
Correction Statement
This article has been corrected with minor changes. These changes do not impact the academic content of the article.
Additional information
Funding
References
- Arnold J. 2021. ggthemes: Extra Themes, Scales and Geoms for 'ggplot2'. R package version 4.2.4, https://CRAN.R-project.org/package=ggthemes.
- Borak J, Brosseau LM. 2015. The past and future of occupational exposure limits. J Occup Environ Hyg. 12(sup1):S1–S3. doi: 10.1080/15459624.2015.1091263.
- Chang W, Cheng J, Allaire J, Sievert C, Schloerke B, Xie Y, Allen J, McPherson J, Dipert A, Borges B. 2022. shiny: Web Application Framework for R. R package version 1.7.2, https://CRAN.R-project.org/package=shiny.
- Chang W. 2021. shinythemes: Themes for Shiny. R package version 1.2.0, https://CRAN.R-project.org/package=shinythemes.
- Deveau M, Chen CP, Johanson G, Krewski D, Maier A, Niven KJ, Ripple S, Schulte PA, Silk J, Urbanus JH, et al. 2015. The global landscape of occupational exposure limits—implementation of harmonization principles to guide limit selection. J Occup Environ Hyg. 12(sup1):S127–S144. doi: 10.1080/15459624.2015.1060327.
- NIOSH. 1988. 1988 OSHA PEL project documentation. Cincinnati, OH: Department of Health and Human Services, Centers for Disease Control, National Institute for Occupational Safety and Health; [accessed 2022 Jan 21]. https://www.cdc.gov/niosh/pel88/pelstart.html.
- NIOSH. 1992. NIOSH recommendations for occupational safety and health: compendium of policy documents and statements. Cincinnati, OH: Department of Health and Human Services, Centers for Disease Control, National Institute for Occupational Safety and Health. DHHS (NIOSH) Publication No. 92-100. doi: 10.26616/NIOSHPUB92100.
- NIOSH. 1996. NEG and NIOSH basis for an Occupational Health Standard: 2-diethylaminoethanol. Cincinnati, OH: Department of Health and Human Services, Centers for Disease Control and Prevention, National Institute for Occupational Safety and Health. DHHS (NIOSH) Publication No. 96-104. doi: 10.26616/NIOSHPUB96104.
- NIOSH. 2007. NIOSH Pocket guide to chemical hazards. Cincinnati, OH: Department of Health and Human Services, Centers for Disease Control and Prevention, National Institute for Occupational Safety and Health. DHHS (Publication No. 2005-149. https://www.cdc.gov/niosh/docs/2005-149/default.html.
- NIOSH. 2011. Current intelligence bulletin 64: coal mine dust exposures and associated health outcomes: a review of information published since 1995. By Attfield M, Hale J, Suarthana E, Wang ML, Castranova V, Thomas KC. Cincinnati, OH: Department of Health and Human Services, Centers for Disease Control and Prevention, National Institute for Occupational Safety and Health. DHHS (NIOSH) Publication No. 2011-172. https://www.cdc.gov/niosh/docs/2011-172/pdfs/2011-172.pdf.
- NIOSH. 2013. Criteria for a recommended standard: occupational exposure to hexavalent chromium. By MacMahon K, Rice F, Park R, Nagy H, Blade LM, Ashley K, Hatfield GK, Wenzl T. Cincinnati, OH: Department of Health and Human Services, Centers for Disease Control and Prevention, National Institute for Occupational Safety and Health. DHHS (NIOSH) Publication No. 2013-128. https://www.cdc.gov/niosh/docs/2013-128/pdfs/2013_128.pdf.
- NIOSH. 2016a. Current intelligence bulletin 68: NIOSH chemical carcinogen policy. By Whittaker C, Rice F, McKernan L, Dankovic D, Lentz TJ, MacMahon K, Kuempel E, Zumwalde R, Schulte P, NIOSH Carcinogen and RELs Policy Update Committee. Cincinnati, OH: U.S. Department of Health and Human Services, Centers for Disease Control and Prevention, National Institute for Occupational Safety and Health, DHHS (NIOSH) Publication No. 2017-100. https://www.cdc.gov/niosh/topics/cancer/policy.html.
- NIOSH. 2016b. Introduction to the NIOSH pocket guide to chemical hazards. U.S. Department of Health and Human Services, Centers for Disease Control and Prevention, National Institute for Occupational Safety and Health; [accessed: 2022 June 3]. https://www.cdc.gov/niosh/npg/pgintrod.html.
- NIOSH. 2017. Current intelligence bulletin 61: a strategy for assigning new NIOSH skin notations (revised). By Schulte P, Alhers HM, Chen C-P, Demchuk E, Dotson GS. Cincinnati, OH: U.S. Department of Health and Human Services, Centers for Disease Control and Prevention, National Institute for Occupational Safety and Health, DHHS (NIOSH) Publication No. 2009-147. https://www.cdc.gov/niosh/docs/2009-147/default.html.
- R Core Team. 2023. R: a language and environment for statistical computing. Vienna, Austria: R Foundation for Statistical Computing. https://www.R-project.org/.
- RStudio Team. 2020. RStudio: Integrated Development for R. Boston (MA): RStudio, PBC. http://www.rstudio.com/.
- Sievert C. 2020. Interactive web-based data visualization with R, plotly, and shiny. The R Series. Boca Raton (FL): Chapman and Hall/CRC Press.
- Waters M, McKernan L, Maier A, Jayjock M, Schaeffer V, Brosseau L. 2015. Exposure estimation and interpretation of occupational risk: enhanced information for the occupational risk manager. J Occup Environ Hyg. 12(sup1):S99–S111. doi: 10.1080/15459624.2015.1084421.
- Wickham H, Averick M, Bryan J, Chang W, McGowan L, François R, Grolemund G, Hayes A, Henry L, Hester J, et al. 2019. Welcome to the tidyverse. JOSS. 4(43):1686. doi: 10.21105/joss.01686.
- Wickham H, Bryan J. 2023. readxl: Read Excel Files. R package version 1.4.2, https://CRAN.R-project.org/package=readxl.
- Wickham H. 2016. ggplot2: Elegant graphics for data analysis. 2nd ed. Switzerland: Springer International.
- Xie Y, Cheng J, Tan X. 2023. DT: a wrapper of the JavaScript Library 'DataTables’. R package version 0.28, https://CRAN.R-project.org/package=DT.