
Abstract
The American Iron and Steel Institute (AISI) gathered data between 1989 and 1997 to build an “objective database” to further understand the occupational exposures generated by the few asbestos-containing materials remaining at various steelmaking companies at this time. This paper analyzed the 520 samples from this campaign which occurred at five different steel manufacturers: Georgetown Steel Company, Inland Steel Company, Ling-Temco-Vought (LTV) Corporation, United States Steel Corporation, and Weirton Steel Corporation. This database is believed to have never previously been systematically organized. Samples were grouped based on sampling times to determine whether they should most appropriately be compared to the OSHA short-term excursion limit (EL) or the 8-hr time-weighted average (TWA) permissible exposure limit (PEL). Sampling times of 30 min or less were considered short-term samples, and samples of 180 min or greater were considered representative workday samples. Samples that did not fit into either category, with sampling times between 31 and 179 min, were considered task samples. Overall, the data indicated that the airborne concentrations were quite low in 1989 and they continued to be low through the study period which ended in 1997. Only seven out of 286 (approximately 2.5%) short-term or representative workday samples were in exceedance of the current OSHA OELs that were implemented in 1994 (short-term samples being compared to the 1 f/cc EL and representative workday samples being compared to the 0.1 f/cc 8-hr TWA PEL). Consistent with prior data, analysis of this dataset supports the view that materials containing asbestos were not used in many applications in the steel industry, and measured airborne concentrations of asbestos were almost always below the occupational exposure limits (OELs) in the post-OSHA era (1972–2000).
Introduction
The American Iron and Steel Institute (AISI) is a trade association for North American steel producers dating back to 1855 (AISI Citation2023). Since the mid-1960s, concern over the potential adverse health effects due to asbestos exposures became well-known across American industries (Selikoff et al. Citation1964; Industrial Hygiene - Health Services Division Citation1965). As was required by OSHA in 1972, companies in the steel and other industries conducted air sampling. It was found at United States Steel Corporation facilities, for example, that the airborne concentrations of asbestos were generally well controlled and quite low, even when compared to modern occupational exposure limits (OELs) (Paustenbach et al. Citation2023). The OSHA permissible exposure limit (PEL) for asbestos was reduced from 5 f/cc (as an 8-hr time-weighted average) to 2 f/cc in 1976. It decreased again to 0.2 f/cc in 1986 and finally the current PEL of 0.1 f/cc was established in 1994. These changes were made in response to risk assessment efforts and as lower occupational exposures became feasible.
Steelmaking companies, partially due to the steel industry union and trade associations, generally compared themselves to one another and used a majority of the same materials and practices. The union and trade association encouraged communication among the firms about topics like asbestos (OSHA Citation1997b; United Steelworkers n.d.). Asbestos-containing materials (ACMs) were phased out of the steelmaking process as suitable alternative materials became available.
As part of a settlement agreement with OSHA on April 29, 1997, AISI entered into a “Memorandum of Understanding” (MOU). This memorandum (OSHA Citation1997a) states that:
…OSHA agrees that once this Settlement Agreement is executed, the Secretary of Labor, the Assistant Secretary of Labor for Occupational Safety and Health, OSHA Compliance Officers, and any other Department of Labor officials or employees involved in interpreting or enforcing the provisions of the Construction Industry Asbestos Standard, 29 CFR 1926.1101, or the General Industry Asbestos Standard, 29 CFR 1910.1001, will interpret and apply the various provisions and requirements of those Standards [the Construction Industry Asbestos Standard, 29 CFR 1926.1101, and the General Industry Asbestos Standard, 29 CFR 1910.1001] at facilities of AISI member companies in accordance with the terms of the MOU to the extent that either such Standard applies to the facility, and will make decisions regarding whether or not to issue citations or to seek penalties or other relief on that basis.
Background
During the 1989–1997 AISI sampling campaign, there was a change in the OSHA OELs for asbestos (Martonik et al. Citation2001). In 1988, an excursion limit of 1.0 f/cc over a 30-minute period was introduced. The previous short-term exposure limit, dating back to 1972, was 10 f/cc as a 15-minute ceiling. From 1986 until 1993, the OSHA PEL for asbestos was 0.2 f/cc of air as an 8-hr time-weighted average (TWA). The current OSHA 8-hr PEL for asbestos, effective since 1994, is 0.1 f/cc. Since 1972, per OSHA requirements, employee exposures must be measured where asbestos fibers are released, and sampling must be repeated every six months until the results are consistently less than one-half the OEL (Martonik et al. Citation2001).
Work practices and engineering controls were used to reduce airborne asbestos exposures when ACMs were present. The use of respirators, for which OSHA has additional requirements, is a safety measure to reduce employee exposures when engineering controls are insufficient. Per OSHA housekeeping requirements, in 1986, the cleanup of ACMs required the utilization of HEPA filter vacuums, wetting of ACMs, and impermeable storage containers (Martonik et al. Citation2001). Also, since 1986, OSHA’s hazard communication program required that, in addition to the employees performing the work, other employees in the vicinity were to be informed of ongoing work with asbestos and these work areas were to be isolated (Martonik et al. Citation2001). To ensure compliance with OSHA standards, after the early 1980s, licensed abatement workers from outside companies were commonly contracted to remove and dispose of ACMs (Williams et al. Citation2007).
Methods
Data collection
The original 1989–1997 AISI sampling campaign report does not appear to have been shared with the public before the preparation of this manuscript since it was a trade association document intended for internal use. Discussions with hygienists who practiced in this industry between 1975–2000 and who were aware of the campaign have indicated that the sampling methods followed National Institute for Occupational Safety and Health (NIOSH) 7400 guidelines. Personal sampling pumps operated at a flow rate of around 2 L/min for breathing zone sampling.
Along with the airborne concentrations of asbestos, the report from this sampling campaign included a description of the activity performed, the job title of the person sampled, sampling time, company, and date. For the longer sampling durations (some sampling times were 480 min), the airborne concentrations would have included exposure during breaks, lunches, etc., and are representative of a mean concentration for the entire day. The reported concentrations from shorter sampling times would have been limited to the activity described. The following activities were sampled:
Gasket removal
Cleaning electrical equipment (*Transite insulators and breaker box)
Drilling or cutting Transite or *Galbestos panels
Removing Transite or Galbestos panels
Cut, remove, strip, and handle wiring
Removal of asbestos (asbestos paper or armature winding) from electrical equipment
Cleaning/handling of Galbestos and Transite
Cleaning up asbestos debris
Removal of ACM floor tile
Removal of asbestos brake shoes
Thermal systems insulation (removal of pipe and valve insulation or removal/repair of asbestos-containing refractory brick)
Maintenance inside boiler
Cleaning/removal of ceiling or ceiling tiles
Cut, removal, and handling of burnt wire
Removal of mastic/adhesive
*Transite was a cement material that frequently, until about 1980, may have contained asbestos (although some did not); Galbestos was a metal cladding made of a steel and felt asbestos mixture. The asbestos in Galbestos was impregnated into the metal (H. H. Robertson Co. n.d.).
Data entry
Information from the AISI sampling campaign, including (1) the date of sampling, (2) sampling time, (3) company, (4) activity, (5) ACM, and (6) airborne asbestos concentrations, were manually entered into a proprietary database by the authors. All data entries were checked for accuracy and “double-entered” by two different authors. Any data errors were corrected before the quantitative analysis.
For samples (n = 232) that were reported to be below the limit of detection and for which the limit of detection (LOD) was reported, half the LOD was substituted as the sample concentration in the database. If the value was reported as zero and no LOD was provided (n = 18), half of the lowest LOD in the dataset was substituted as the concentration. The lowest LOD in the dataset was 0.001 f/cc. Using half of the LOD for censored data would overestimate these values if the true concentrations in this range are lognormally distributed with a positive skew (as the short-term, task and representative workday sample groups appear). Half of the LOD seemed to be a reasonable substitute for censored data as these values began to approach background air levels for asbestos. Ambient concentrations of asbestos fibers have been measured between non-detectable values and as high as 0.0047 f/cc (outdoors) and 0.012 f/cc (indoors) (Nolan and Langer Citation2001; Lee and Van Orden Citation2008). Results using the LOD (a maximum value for all censored data) as a substitution for censored data, rather than half of the LOD, do not change the conclusions of this paper. The calculated mean airborne concentrations were an overestimate of the true concentration since nearly 50% of the results were reported as none-detected.
Samples were identified as short-term, task, or representative workday samples based on the sampling time. Short-term samples (n = 126), which were recorded for 30 min or less, were considered a group because they were most appropriately compared to the OSHA 30-minute excursion limit. Representative workday samples (n = 159), which were collected for 180 min or more, were more appropriately compared to the 8-hr PEL as they were more likely to represent values similar to the TWA for an individual’s entire workday. During this era, it was not uncommon to collect samples for 180–240 min (3–4 hr) to evaluate the workday because there was a limited battery life for the sampling pumps. If air monitoring was not conducted both before and after an employee’s lunch break, it was common practice that if the worker’s job was the same in the first and second half of their shift, the measured concentration would be considered representative of a full 8-hr day, regardless of which half the sample was collected.
Task samples (n = 211) had a sampling duration between 31 and 179 min. Samples in which no sampling time was reported (n = 24) were excluded from the analysis.
Data grouping
To identify trends in the data, samples were grouped for analysis by (1) the ACM interacted with, (2) the company where the sample was recorded, and (3) the date the sample was taken.
Grouping the data by the ACM interacted with, rather than the task performed, was deemed appropriate because several of the tasks identified by AISI involved the same materials and generated similar exposures. An example of this includes the “drilling or cutting Transite or Galbestos panels” and “removing Transite or Galbestos panels.” Grouping samples by the ACM being interacted with increases the sample size compared to the original AISI groupings and allows the identification of the ACMs that produced the highest exposure. There were 12 materials sampled for potential exposures:
Block insulation
Boiler insulation
Brakes
Ceiling tile
Electrical equipment
Floor tile
Gaskets
Insulation board
Mastic/adhesive
Pipe insulation
Wire
Debris (unidentified ACM)
To further identify trends in the data, samples were grouped by the five different steelmaking companies where samples were recorded. There was also a category (20 samples) in which the company was not identified. These six companies included:
Georgetown Steel
Inland Steel
LTV Steel
United States Steel Corporation (USS)
Weirton Steel (WS)
Unknown
The AISI sampling campaign results for both short-term and representative workday samples (separately) were graphed by their sampling date and fit with a line of best fit to determine if there were significant temporal trends in the data from 1989–1997.
Data analysis
The entirety of the data, as well as, the data for short-term, task, and representative workday samples (individually) appeared to be log-normally distributed based on the visual examination of a quantile-quantile plot. This is due to the presence of many non-detect samples. When broken down into smaller data groupings by each ACM or each company for short-term, task, and representative workday samples, not all data groups were identifiably log-normally distributed. Due to insufficient sample size, it is not always possible to determine the distribution of every data group. For every data grouping, the arithmetic mean was equal to or greater than the geometric mean. For this reason, and to maintain consistency across data groups, the arithmetic mean and standard deviations were discussed throughout the paper. Geometric means and geometric standard deviations were included in of Appendix A: Geometric Mean and Geometric Stand Deviation.
Stata software (version 17.0) was used to determine arithmetic means, standard deviations, maximum values, and 95th percentiles for each data grouping. Standard deviations were calculated when the sample size consisted of five or more data points, and the 95th percentile concentrations were calculated for groups with 20 or more data points. The cutoff of 20 was used for the 95th percentile because smaller sample sizes would have been the same value as the maximum concentration (which is also reported). When compared to OELs, all data was rounded to the nearest hundreds place.
Results
Temporal trends
No significant trends over time were observed in the data set for both short-term and representative workday samples ( and ). When graphed by the sampling date, linear fits of the concentrations for both sample types had a slope (either positive or negative) that was less than 0.0075 f/cc/year. This was hypothesized since there were few, if any, expected changes in the use of asbestos and workplace practices associated with ACMs in the steel industry from 1989–1997.
Only one short-term sample exceeded the current OSHA 30-minute excursion limit of 1 f/cc (that has been in effect since 1988) (). Six representative workday samples exceeded the current OSHA PEL as an 8-hr TWA of 0.1 f/cc (that has been in effect since 1994) ().
Results by ACM
The short-term samples (n = 126) had a mean fiber concentration of 0.06 f/cc with a standard deviation of 0.16 f/cc and a 95th percentile value of 0.09 f/cc (). When grouped by the ACM, none of the short-term sample means, means added to the standard deviations, nor the values for the 95th percentile exceeded the excursion limit (1 f/cc) (). In fact, only two groups had means that exceeded the 8-hr PEL (electrical equipment with a mean of 0.23 f/cc and pipe insulation with a mean of 0.11 f/cc), even though these were short-term samples. Individually, just one short-term sample (with a concentration of 1.45 f/cc), out of 126 samples, exceeded the current OSHA short-term excursion limit. It is unclear what this worker was doing, although it was reported to be work associated with electrical equipment. A worker handling pipe insulation had the second-highest individual short-term sample (0.84 f/cc), which was below the excursion limit.
The representative workday samples (n = 159) had a mean fiber concentration of 0.02 f/cc with a standard deviation of 0.04 f/cc and a 95th percentile value of 0.10 f/cc (). For representative workday samples grouped by the ACM interacted with, other than ceiling tile (mean = 0.18 f/cc, n = 2), which only consisted of 2 datapoints, none of the means, means added to the standard deviations, nor the values for the 95th percentile exceeded 0.1 f/cc (). Six individual representative workday samples exceeded the current OSHA PEL of 0.1 f/cc. These occurred for persons interacting with five different ACMs; block insulation, boilers, ceiling tile, pipe insulation, and wire. The highest sample recorded was 0.23 f/cc in an individual interacting with ceiling tile (it is assumed this task involved cutting the tile). The remaining five PEL exceeding representative workday samples were all below 0.15 f/cc.
The task samples (n = 211) had a combined mean fiber concentration of 0.06 f/cc with a standard deviation of 0.11 f/cc and a 95th percentile value of 0.27 f/cc (). None of the individual task samples exceeded the excursion limit of 1 f/cc and 27 samples exceeded the 8-hr TWA PEL of 0.1 f/cc (). None of the samples above 150 min and only four samples above 90 min exceeded 0.1 f/cc.
For samples in which no sampling time was included, all samples were less than 1 f/cc. The highest concentration for these samples was 0.213 f/cc for a worker incinerating wire in 1994 at Weirton Steel. The remaining 23 samples were all 0.066 f/cc or less.
Results by company
All of the short-term samples and representative workday samples that exceeded the current OSHA excursion limit or 8-hr PEL, respectively, occurred with individuals working at Weirton Steel (). Overall, the data indicated good control across firms (including Weirton) ().
The mean, mean added to the standard deviation, and the 95th percentile value for the short-term samples at Weirton Steel (n = 35) was below the excursion limit of 1 f/cc (). For representative workday samples, the mean and mean plus standard deviation were below the current 8-hr PEL of 1 f/cc; however, the 95th percentile value (0.15 f/cc) slightly exceeded the current 8-hr PEL (0.1 f/cc) ().
Discussion
In this dataset, around half of all samples were below the limit of detection (250 out of 496 samples in ). This supports the view that exposures to asbestos from 1989–1997 for the companies in this sampling campaign, which reasonably represent the entire steel industry in the United States, were infrequent and quite low. There were only six representative workday samples, out of a possible 159 samples, that were above the current 0.1 f/cc OSHA PEL, and there was only one short-term sample, out of a possible 126 samples, that exceeded the 1 f/cc OSHA EL.
The results of this paper are reinforced by those reported in Paustenbach et al. (Citation2023) which evaluated the airborne concentrations of asbestos at the United States Steel Corporation from 1972–2006. That paper reported that none of the 162 personal air monitoring samples from 1986–1993 exceeded the contemporaneous OSHA PEL of 0.2 f/cc and just one out of 63 samples from 1994–2006 exceeded the current PEL of 0.1 f/cc.
Respirators
The data analyzed in this paper, as well as Paustenbach et al. (Citation2023), were unable to account for instances when respiratory protection was worn during the given work activities. At each of the companies for which data were reported, the individuals were evaluated because they were known to be handling ACMs. There were 268 samples in this dataset where the person sampled was reported as “asbestos clean up”, “asbestos control team”, “asbestos laborer”, “asbestos remover”, “asbestos worker”, or “contractor”. These individuals would have likely been hired solely for the abatement of asbestos. These individuals, and likely many others in this campaign, would be equipped with personal protective equipment, including respirators.
Encapsulated materials
Many of the ACMs noted in this sampling campaign were encapsulated materials, including gaskets, wire, brakes, floor tile, mastics/adhesives, and insulation boards. Encapsulated materials contain asbestos that is bound in resin, paper, glue, or other media. It is difficult to get these products to release asbestos fibers into the air without significant manipulation (e.g., cutting with a saw or sanding with an electric sander). As such, it is not surprising that these products produced relatively low airborne concentrations of asbestos. Accordingly, these products have been historically exempted from federal asbestos labeling requirements as they are believed to present a negligible health risk (Selikoff Citation1970; OSHA Citation1972; US EPA Citation1990; Mowat et al. Citation2005).
PCM analysis
Analysis of samples by phase contrast microscopy (PCM) counts all fibers on the filter if they meet the required dimensions (at least 5 microns in length and with an aspect ratio of 3:1 or greater) (NIOSH Citation2019). Forsterite (thermally degraded asbestos) or other non-asbestos fibers (e.g., fiberglass, cotton fibers, etc.) are indistinguishable from asbestos by PCM analysis. Due to its similar physical and heat-resistant properties, man-made fiberglass has been a common replacement for asbestos in many electrical, acoustic, and thermal insulation products since the 1950s (Albert Einstein College of Medicine Citation2023). As a result, the airborne concentrations in this sampling campaign likely overestimate the true airborne concentrations of asbestos. It is known that some of the air samples in these plants often contained non-asbestos fibers (Paustenbach et al. Citation2023).
Fiber type
The current OSHA 8-hr PEL (0.1 f/cc) for asbestos is based on data collected at four cohorts exposed to mixed fibers (e.g., amphiboles and chrysotile). It has been quite clear for 50 years that crocidolite, amosite, and chrysotile have dramatically different potencies for mesothelioma. The health hazard posed by asbestos is dependent on the type of asbestos that is present. Most toxicologists and epidemiologists accept that the relative potency of the different forms of asbestos is about 1:100:500 for chrysotile, amosite, and crocidolite, respectively (Hodgson and Darnton Citation2000; Garabrant and Pastula Citation2018; Darnton Citation2023). Many researchers acknowledge that chrysotile probably doesn’t produce mesothelioma until doses that can cause asbestosis (Beckett et al. Citation2023).
To the best of the authors’ knowledge, the vast majority of tasks that were evaluated in this industry-wide study involved exposure to chrysotile (the only exception was that amphiboles may have been present in some historic asbestos-containing insulation materials). For gaskets (McKinnery and Moore Citation1992; Spencer Citation2001; Boelter et al. Citation2002; Madl et al. Citation2007), brakes (Paustenbach, Finley, et al. Citation2004; Madl et al. Citation2009), ceiling tile (Verma and Middleton Citation1981; Lange and Thomulka Citation2002; Guth et al. Citation2020), floor tile (Lange,Citation2001 Citation2005; Citation2006), mastic/adhesive (Lange Citation2001; Perkins and Hargesheimer Citation2002; Paustenbach, Sage, et al. Citation2004; Lange Citation2005; Citation2006), and wire/electrical (Mangold et al. Citation2006; Williams et al. Citation2007; Goodman et al. Citation2014) products used in steel mills, when they were asbestos-containing, the type of asbestos was chrysotile. Some insulation materials likely contained chrysotile and/or amphiboles. The abatement of suspected asbestos-containing insulation was typically conducted by certified asbestos remediation contractors beginning in the 1980s (Paustenbach et al. Citation2023).
Limitations
This research was limited in that many of the data groups, when broken down by the sample type and the company or ACM interacted with, have a relatively small number of samples. As a result, the means in these categories may overestimate or underestimate the true typical concentrations and have large standard deviations; although, this is unlikely since the results are similar to those seen in other studies of workers handling those materials. Since the distribution of some of the smaller data groups was not log-normal (likely due to an insufficient number of samples), arithmetic means were used in the paper. Arithmetic means, because all concentrations were positive values, will always be greater than or equal to geometric means.
The data presented in this paper are based on personal air monitoring and they do not account for the use of respirators by employees who wore them while interacting with ACMs. Because this campaign used the PCM analytical technique, the likely presence of non-asbestos fibers in the air indicates that the results may be slightly higher than what was present. For example, it is known that the cotton or wool clothing worn by workers of the era has been measured in lapel samples.
Conclusion
This paper presents an analysis of all the available personal sampling data for airborne asbestos from the 1989–1997 American Iron and Steel Institute (AISI) sampling campaign. To our understanding, this dataset has previously never been systemically organized. This analysis shows that the airborne asbestos concentrations generated due to interactions with asbestos-containing materials (ACMs) in steel mills from 1989 to 1997, and likely well before these dates, were far below regulatory guidance values. The mean concentration for all the representative workday samples (sampling duration of 180 min or greater) collected was 0.02 f/cc (which is 1/5th the prevailing PEL) and the mean of samples with sampling times less than 180 min was 0.06 f/cc (which is less than 1/16th the prevailing EL). It has long been stated that the processes across the various steel manufacturers were similar and that exposures to asbestos were, accordingly, likely to be similar across manufacturers. These data support that belief.
Ethical approval
Ethical approval was not required for this paper. The data analysis performed in this paper was performed on industrial hygiene data that was recorded from 1989 through 1997. There were no experimental procedures performed on humans or animals.
| ABBREVIATIONS | ||
| ACM | = | Asbestos-Containing Material |
| AISI | = | American Iron and Steel Institute |
| EL | = | Excursion Limit |
| f/cc | = | fibers/cubic centimeter |
| GSD | = | Geometric Standard Deviation |
| LOD | = | Limit of Detection |
| LTV | = | Ling-Temco-Vought |
| OEL | = | Occupational Exposure Limit |
| OSHA | = | The Occupational Safety and Health Administration |
| PCM | = | Phase Contrast Microscopy |
| PCME | = | Phase Contrast Microscopy Equivalent |
| PEL | = | Permissible Exposure Limit |
| PPE | = | Personal Protective Equipment |
| TWA | = | Time-Weighted Average |
Acknowledgments
We want to thank former AISI members and employees who were affiliated with this sampling campaign and requested their names be withheld, for their interviews and correspondence.
Disclosure statement
The purpose of this paper was to share information regarding the exposures resulting from using asbestos-containing materials (ACMs) in five American steel corporations from 1989–1997. In March of 2021, Paustenbach and Associates was first retained on behalf of United States Steel Corporation in asbestos litigation. No lawyers, nor the companies they represent, provided the data or funding or had any role in the analysis and conclusions of the paper. The authors are solely responsible for the content of this paper.
Data availability statement
The original text and tables from the 1989–1997 AISI sampling campaign have been provided as a supplemental document.
Additional information
Funding
References
- [AIHA] American Industrial Hygeine Association. 2015. A Strategy for Assessing and Managing Occupational Exposures. 4th ed. Falls Church, VA: American Industrial Hygiene Association.
- [AISI] American Iron and Steel Institute. 2023. History. Washington, DC: American Iron and Steel Institute. https://www.steel.org/about-aisi/history/
- Beckett EM, Abelmann A, Roberts B, Lewis RC, Cheatham D, Miller EW, Hall E, Pierce JS. 2023. An updated evaluation of reported no-observed adverse effect levels for chrysotile, amosite, and crocidolite asbestos for lung cancer and mesothelioma. Crit Rev Toxicol. 53(10):611–657. doi: 10.1080/10408444.2023.2283169.
- [NIOSH] National Institute for Occupational Safety and Health. 2019. Asbestos and Other Fibers by PCM. In: NIOSH manual of analytical methods. 5th ed. Atlanta, GA: NIOSH Headquarters, Centers for Disease Control. p. 1–40.
- Nolan RP, Langer AM. 2001. Concentration and type of asbestos fibers in air inside buildings. 17. en.
- [OSHA] Occupational Safety and Health Administration. 1972. Department of Labor Part 1910 - Occupational Safety and Health Standards: Standard for Exposure to Asbestos Dust. 37. Federal Register. p. 11318–11322.
- [OSHA] Occupational Safety and Health Administration. 1997a. In the United States Court of Appeals for the Fifth Circuit - Asbestos Information Association/North America Petitioner. v. No. 94-41097 Robert B. Reich, Secretary of Labor Respondent. American Iron and Steel Institute, Petitioner, v. No. 96-60006 Occupational Safety and Health Administration, Respondent. American Iron and Steel Institute, Petitioner, v. No. 96-60702 Occupational Safety and Health Administration, Respondent. Settlement Agreement.
- [OSHA] Occupational Safety and Health Administration. 1997b. Memorandum of Understanding: Application of Construction and General Industry Asbestos Standards to AISI Member Companies. Washington, DC: Occupational Safety and Health Administration, U.S. Department of Labor; [accessed]. https://www.osha.gov/laws-regs/isa/american-iron-and-steel-institute-03291997.
- Albert Einstein College of Medicine. 2023. Fiberglass. https://www.einsteinmed.edu/administration/environmental-health-safety/industrial-hygiene/fiberglass.aspx#:∼:text=Due%20to%20the%20similarity%20in,heat%20resistance%20to%20a%20material
- Boelter FW, Crawford GN, Podraza DM. 2002. Airborne fiber exposure assessment of dry asbestos-containing gaskets and packings found in intact industrial and maritime fittings. AIHA J (Fairfax, Va). 63(6):732–740. en. doi: 10.1080/15428110208984763.
- Darnton L. 2023. Quantitative assessment of mesothelioma and lung cancer risk based on Phase Contrast Microscopy (PCM) estimates of fibre exposure: an update of 2000 asbestos cohort data. Environ Res. 230:114753. doi: 10.1016/j.envres.2022.114753.
- Garabrant DH, Pastula ST. 2018. A comparison of asbestos fiber potency and elongate mineral particle (EMP) potency for mesothelioma in humans. Toxicol Appl Pharmacol. 361:127–136. doi: 10.1016/j.taap.2018.07.003.
- Goodman JE, Peterson MK, Bailey LA, Kerper LE, Dodge DG. 2014. Electricians’ chrysotile asbestos exposure from electrical products and risks of mesothelioma and lung cancer. Regul Toxicol Pharmacol. 68(1):8–15. en. doi: 10.1016/j.yrtph.2013.10.008.
- Guth K, Desai U, McCluskey J, Harbison R. 2020. Asbestos exposure risk from ceiling and other building materials. Journal of Toxicology and Environmental Health Sciences. 12(4):46–59.
- H. H. Robertson Co. n.d. Ad for galbestos. Pittsburgh, Pa.: H. H. Robertson Co.
- Hodgson JT, Darnton A. 2000. The quantitative risks of mesothelioma and lung cancer in relation to asbestos exposure. Ann Occup Hygiene. 44(8):565–601. doi: 10.1016/S0003-4878(00)00045-4.
- Hollins D, Burns A, Unice K, Paustenbach DJ. 2019. An analysis of workplace exposures to asbestos at three steel mills located in the United States (1972-1982). Toxicol Ind Health. 35(11-12):726–737. en. doi: 10.1177/0748233719893905.
- Industrial Hygiene - Health Services Division. 1965. Industrial Hygiene Survey at Worcester Works - Wire Operations. United States. Steel Corporation: Industrial Hygiene - Health Services Division, Personnel Services Department.
- Lange JH. 2001. Airborne asbestos concentrations during abatement of floor tile and mastic: evaluation of two different containment systems and discussion of regulatory issues. Indoor Built Environ. 10(3-4):193–199. doi: 10.1177/1420326X0101000312.
- Lange JH. 2005. Asbestos-containing floor tile and mastic abatement: Is there enough exposure to cause asbestos-related disease? Indoor Built Environ. 14(1):83–88. doi: 10.1177/1420326X05050675.
- Lange JH. 2006. Type and amount of asbestos in floor tile and mastic. Bull Environ Contam Toxicol. 77(6):807–809. en. doi: 10.1007/s00128-006-1215-4.
- Lange JH, Thomulka KW. 2002. Airborne exposure concentrations during asbestos abatement of ceiling and wall plaster. Bull Environ Contam Toxicol. 69(5):712–718. doi: 10.1007/s00128-002-0119-1.
- Lee RJ, Van Orden DR. 2008. Airborne asbestos in buildings. Regul Toxicol Pharmacol. 50(2):218–225. en. doi: 10.1016/j.yrtph.2007.10.005.
- Madl AK, Gaffney SH, Balzer JL, Paustenbach DJ. 2009. Airborne asbestos concentrations associated with heavy equipment brake removal. Ann Occup Hyg. 53(8):839–857. doi: 10.1093/annhyg/mep056.
- Madl AK, Clark K, Paustenbach DJ. 2007. Exposure to airborne asbestos during removal and installation of gaskets and packings: a review of published and unpublished studies. J Toxicol Environ Health B Crit Rev. 10(4):259–286. en. doi: 10.1080/15287390600974957.
- Mangold C, Clark K, Madl A, Paustenbach D. 2006. An exposure study of bystanders and workers during the installation and removal of asbestos gaskets and packing. J Occup Environ Hyg. 3(2):87–98. doi: 10.1080/15459620500498067.
- Martonik JF, Nash E, Grossman E. 2001. The history of OSHA’s asbestos rulemakings and some distinctive approaches that they introduced for regulating occupational exposure to toxic substances. AIHAJ. 62(2):208–217. doi: 10.1080/15298660108984624.
- McKinnery WN, Jr., Moore RW. 1992. Evaluation of airborne asbestos fiber levels during removal and installation of valve gaskets and packing. Am Ind Hyg Assoc J. 53(8):531–532. doi: 10.1080/15298669291360102.
- Mowat F, Bono M, Lee RJ, Tamburello S, Paustenbach D. 2005. Occupational exposure to airborne asbestos from phenolic molding material (Bakelite) during sanding, drilling, and related activities. J Occup Environ Hyg. 2(10):497–507. en. doi: 10.1080/15459620500274237.
- Paustenbach DJ, Finley BL, Lu ET, Brorby GP, Sheehan PJ. 2004. Environmental and occupational health hazards associated with the presence of asbestos in brake linings and pads (1900 to present): a “state-of-the-art” review. J Toxicol Environ Health B Crit Rev. 7(1):25–80. en. doi: 10.1080/10937400490231494.
- Paustenbach DJ, Sage A, Bono M, Mowat F. 2004. Occupational exposure to airborne asbestos from coatings, mastics, and adhesives. J Expo Anal Environ Epidemiol. 14(3):234–244. doi: 10.1038/sj.jea.7500320.
- Paustenbach DJ, Stevens ME, Tuttle BP, Shore RA, Ligas S, Brew DW. 2023. Occupational exposure to asbestos in the steel industry (1972-2006). J Expos Sci Environ Epidemiol. :1–31. doi: 10.1038/s41370-023-00576-4.
- Perkins RA, Hargesheimer J. 2002. Demolition of gypsum wallboard with asbestos-containing mastic. Pract Period Hazard Toxic Radioact Waste Manage. 6(4):235–243. doi: 10.1061/(ASCE)1090-025X(2002)6:4(235).
- Selikoff IJ. 1970. Partnership for prevention- the insulation industry hygiene research program. Industr Med. 39(4):21–25.
- Selikoff IJ, Churg J, Hammond EC. 1964. Asbestos exposure and neoplasia. J Am Med Assoc. 188(1):22–26.
- Spencer JW. 2001. Report of Findings: Exposure Assessment: An Evaluation of the Actual Contribution of Airborne Asbestos Fibers from the Removal and Installation of Gasket and Packing from Ingersoll-Rand Compressors and Pumps: EPI Project No. 21104.1-13.
- [US EPA] US Environmental Protection Agency. 1990. National emissions standards for hazardous air pollutants: 40 CFR. Fed Regist. p. 48414–48433.
- United Steelworkers. n.d. Our History. Pittsburgh, PA: United Steelworkers. https://www.usw.org/union/history
- Verma DK, Middleton CG. 1981. Exposure in the ceiling and wall texture process. Occup Health Saf. 50(3):21–24.
- Williams PRD, Phelka AD, Paustenbach DJ. 2007. A review of historical exposures to asbestos among skilled craftsmen (1940–2006). J Toxicol Environ Health B Crit Rev. 10(5):319–377. doi: 10.1080/10937400601034191.
Appendix A.
Geometric mean and geometric stand deviation
All arithmetic means in this paper are equivalent to or greater than the geometric means of the same dataset. The geometric mean and geometric standard deviation (GSD) may be appropriate to discuss for groups that have sufficient sample size; however, to maintain consistency and to avoid underestimating exposures in the groups that are not log-normally distributed, the arithmetic means and arithmetic standard deviations were discussed throughout the paper.
The American Industrial Hygiene Association (AIHA) textbook “A Strategy for Assessing and Managing Occupational Exposures” (AIHA Citation2015) predicts the reliability of the GSD depending on both the value of the GSD and the ratio of the 95th percentile value to the occupational exposure limit (). If the sample size requirements of this table are met, the authors of this paper believe it is reasonable to use the GSD to determine variability.
The geometric mean and standard deviations for and have been recreated with geometric mean and geometric standard deviation in . The AIHI textbook claims that a GSD of 1.5 suggests low variability, 2.5 suggests moderate variability, and 3.5 or greater suggests high variability. Several of the GSDs in this analysis are above 3.5, suggesting high variability; however, it should be noted that this frequently occurred in groups where all of the values in that group were well below OELs. The presence of non-detect samples (which appear in the data as either half of the reported LOD or 0.0005 f/cc) and other unusually small values can contribute to high GSDs in a sample even when all values are well below OELs.
Figure 1. All of the short-term samples (n = 126) in the AISI sampling campaign by date. The current OSHA 30-minute excursion limit (1 f/cc) is included for reference.
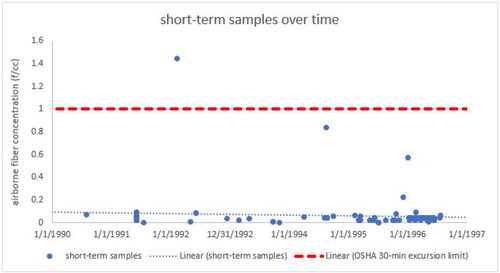
Figure 2. All of the representative workday samples (n = 159) in the AISI sampling campaign by date. The current OSHA PEL (0.1 f/cc) as an 8-hr TWA is included for reference.
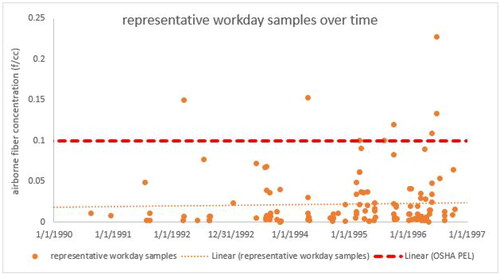
Table A1. Approximate sample size requirements to be 95% confident that the true 95th percentile is less than the OEL.
Table A2. Summary statistics (with geometric mean, geometric standard deviation, and the upper bound value with a 95% confidence interval) for short-term, task, and representative workday airborne fiber personal samples grouped by the asbestos-containing material the individual was documented to be interacting with.
Table A3. Summary statistics (with geometric mean, geometric standard deviation, and the upper bound value with a 95% confidence interval) for short-term, task, and representative workday airborne fiber personal samples grouped by the company the individual was sampled working at.
Table 1. Summary statistics for short-term, task, and representative workday airborne fiber personal samples grouped by the asbestos-containing material the individual was documented to be interacting with.
Table 2. Summary statistics for short-term, task, and representative workday airborne fiber personal samples grouped by the company the individual was sampled working at.