
 ?Mathematical formulae have been encoded as MathML and are displayed in this HTML version using MathJax in order to improve their display. Uncheck the box to turn MathJax off. This feature requires Javascript. Click on a formula to zoom.
Abstract
This study examines factors of importance for the pricing of virtual academic conferences based on information on their quality attributes. Data are based on 76 virtual conferences held or planned to be held in the field of tourism and related fields between April 2020 and December 2021. The distribution of fees is skewed with a median price of US$61 and an average of US$126. One fourth of the conferences is free of charge, although there is a trend toward increased prices the longer the time elapse from the outbreak of the pandemic, ceteris paribus. Count data model estimations show that the conference fee depends on size, academic field, and location of the host. A one-day conference is on average US$60 cheaper than a two-day event while pure tourism conferences are on average US$34 more expensive than those in related fields. Conferences in the United Kingdom have the lowest fees while hybrid format is a factor of specific importance for the pure tourism events. Reputation of the host university and whether the conference is held by an association are aspects of no significance for the fee.
Introduction
In times of the Covid-19 pandemic, virtual academic conferences have become the new, but still unexplored reality (Dillette & Ponting, Citation2021; Mubin, Alnajjar, Shamail, Shahid, & Simoff, Citation2020; Roos, Oláh, Ingle, Kobayashi, & Feldt, Citation2020; Seraphin, Citation2021). A few conferences are offered in hybrid formats, especially in countries where domestic travel is allowed (an example is the 6th World Leisure Hybrid Congress in China in 2021). Since virtual conferencing is a new market, many organizers suffer from imperfect information on demand and how much they can or should charge for participation (Schoening, Citation2020). Scientific associations, for instance, may be concerned about the loss of important or even major sources of income if the trend goes toward virtual conferences free of charge (Hahm, Breiter, Severt, Wang, & Fjelstul, Citation2016; Roos et al., Citation2020). Compared with face-to-face conferences, which usually include costs for venues, catering as well as accommodation and travel for guest speakers, virtual conferences are relatively cheap, unless fully new technology needs to be installed (Roos et al., Citation2020). The few studies available that examine the willingness to pay for virtual conferences are mainly in the format of small case studies, making it difficult to draw general conclusions (see, for instance, Ahn et al., Citation2021; Raby & Madden, Citation2021b).
Data on fees for all virtual academic conferences in tourism and related fields during the first year of the pandemic reveal that the range is wide (, Appendix). A non-negligible proportion of the conferences is provided for free while some others cost several hundred US dollars. In this new market, there is a need for conference organizers to understand the value of different quality attributes that might be of importance for demand such as size (duration) and association.
Table 1. Descriptive statistics.
The aim of this study is to investigate factors of importance for the pricing of virtual academic conferences in tourism and related sectors (leisure, hospitality, and sports). A count data model is used to estimate the determinants with a specific focus on size, format, host location, reputation, and relation to an association. Data cover all virtual academic conferences held or planned to be held in the targeted fields between April 2020 and December 2021.
This study adds to the growing body of research on the importance of virtual conferences in times of restricted mobility. Dolasinski, Roberts, Reynolds, and Johanson (Citation2021) suggest that further research is needed to better understand the impact and effectiveness of virtual events. In general, Ryan, Fenton, Ahmed, and Scarf (Citation2020) conclude that digitally designed events are increasing, and this affects all stages of a conference from integrating communication systems to optimizing digital operations and communication for event delivery, marketing and customer experience.
Before the pandemic and the increase of virtual events, studies on academic conferences were rare (Chen & Tham, Citation2019) despite their contribution to the economy in general (Jones & Li, Citation2015). A couple of exceptions include Edelheim, Thomas, Åberg, and Phi (Citation2018) and Campos, Leon, and McQuillin (Citation2018), who emphasize that visits to academic conferences are important for networking and possible future collaborations. Academic conferences are also useful tools for informal peer review, something that may improve the quality of research and facilitate publication and citations (Chalvatzis & Ormosi, Citation2021; de Leon & McQuillin, Citation2020; Gorodnichenko, Pham, & Talavera, Citation2021).
Literature on tourism and events commonly focusses on aspects relating to satisfaction and loyalty of participants at academic conferences or association meetings as well as on preferences by attendees (Godovykh & Hahm, Citation2020; Hahm et al., Citation2016; Kim, Kim, Milne, & O’Neill, Citation2020). Mair, Lockstone-Binney, and Whitelaw (Citation2018) survey the motivations of 100 CAUTHE (Council for Australian University Tourism and Hospitality Education) members and find that their conference attendance is mainly related to opportunities to make professional contacts and to hear about new research within their fields.
Not only due to pandemic-related immobility, interest in research related to virtual academic conferences is also surging because of environmental considerations (Chalvatzis & Ormosi, Citation2021). Organizers of virtual conferences do not need to look for venues with sustainable practices (Draper, Dawson, & Casey, Citation2011). A virtual international conference reduces the number of air travels to zero when the organizer as well as participants can attend from in principle any number of locations (van Ewijk & Hoekman, Citation2021). Multi-site or virtual conferences are also likely to be more inclusive, as travel and attendance costs can be significantly lower, something that allows otherwise under-represented audiences to take part such as researchers from developing countries (Fraser, Soanes, Jones, Jones, & Malishev, Citation2017; van Ewijk & Hoekman, Citation2021).
This study contributes a novel analysis of aspects that determine the fees for virtual (and hybrid) academic conferences in tourism and related fields, based on a universe of conferences since the outbreak of the Covid-19 pandemic. An estimation method is used that specifically takes into account the skewed distribution of the fees.
The study is structured as follows: “Recent literature and conceptual background” section introduces recent literature and the conceptual background while “Empirical approach” section presents the empirical model. “Data sources and descriptive statistics” section describes the dataset, the empirical results are revealed in “Empirical results” section, and “Conclusions” section concludes.
Recent literature and conceptual background
Recent literature
In the wake of the Covid-19 pandemic, virtual conferences are gaining in importance. Some researchers even believe that virtual academic conferences have the potential to become the new norm (Foramitti, Drews, Klein, & Konc, Citation2021; Gill, Citation2021). During the pandemic, numerous virtual conferences are open to attend without fees (see, for instance, Speirs, Citation2020 for medical researchers).
An analysis of 270 in-person conferences held by 150 scientific societies in 2018–2019 concludes that these events are generally costly, exclusive, and lack environmentally sustainable organization (Sarabipour et al., Citation2021). Thus, one apparent advantage of virtual conferences is the potentially lower cost and an environmentally friendly format (Foramitti et al., Citation2021; Raby & Madden, Citation2021b). Another is that they can help to overcome many access barriers that surround traditional conferences (Bottanelli et al., Citation2020; Niner & Wassermann, Citation2021). Enabling an extended reach of participants and accessibility are of primary importance in virtual events, something that benefits both attendees from developing countries and early career researchers (Dolasinski et al., Citation2021; Fraser et al., Citation2017; Sarabipour et al., Citation2021; van Ewijk & Hoekman, Citation2021).
Virtual conference formats also have several disadvantages, of which limited possibilities for networking is an obvious one (Foramitti et al., Citation2021; Fraser et al., Citation2017; Hamm, Frew, & Lade, Citation2018; Raby & Madden, Citation2021a) as are the different time zones presumptive participants reside in (Rich, Diaconescu, Griffiths, & Lankarany, Citation2020). Despite the fact that virtual conferences may not completely replace face-to-face meetings, several studies conclude that they are fast becoming an accepted alternative format (Nahai, Citation2021; Roos et al., Citation2020).
There is limited evidence on the characteristics and patterns of fees or other features of face-to-face conferences. Chen and Tham (Citation2019) investigate the fees for 360 tourism-related academic conferences between the period 2016 and 2018 and find that they are unevenly distributed. Kim, Kim, and Oh (Citation2020) show that participants of academic conferences who want to expand their knowledge and network show a willingness to pay for extra programmes such as local tours after the conference. In addition, women show a higher willingness to pay for these extra programmes than men.
Borghans, Romans, and Sauermann (Citation2010) demonstrate that the majority of participants at academic conferences in the field of labor economics indicate that the fees and travel expenses are normally fully covered by their employers if a paper is presented. This could imply that the willingness to pay is insensitive to the conference characteristics. Another study reports that the cost of the conference is more important for individuals with the highest qualifications, since they tend to be interested in more regular attendance than other persons in a given period of time (Mair, Citation2010).
Studies on international academic conferences in the field of tourism focus on the factors that influence individual attendance and the choice of payment options for registration (fully covered by employer versus individual responsibility) (Kim, Kim, & Oh, Citation2020). Evidence based on postgraduate students in the discipline of hospitality and tourism shows that there are four main choice factors of academic conferences: Educational opportunities, career development, travel ability, and destination stimuli (Kim, Kim, & Oh, Citation2020). The last two factors do not play a role for virtual conferences.
Conceptual background
Virtual academic conferences have similarities with physical ones, such as calls for papers, scientific committees, the use of registration systems (Easychair, for instance), a price-size relationship and a need for careful planning as well as functioning technology. While venue and hospitality costs of virtual conferences are zero, a significant portion of the budget still needs to be dedicated to pre-planning and pre-production of content and format of the virtual event (Gichora et al., Citation2010). Often a subscription to video conferencing software is required, as only a certain number of people can participate when using versions for free (Gottlieb et al., Citation2020). As an example, Raby and Madden (Citation2021b) mention that a one-month license for Zoom webinar access with up to 1,000 participants renders a price of £330.
Unlike physical conferences, virtual conferences may have a larger share of characteristics in common. Exotic locations and special food, amenities, or other activities cannot outweigh mediocre academic content. Thus, destination-specific supply side factors not directly related to the conference itself are expected to play a minor role and the fee can be adjusted accordingly (Schoening, Citation2020). This means that the price primarily depends on the willingness to pay for the academic quality of the conference. Unfortunately, the few studies that examine this willingness to pay for virtual conferences relate to specific cases where respondents subjectively give their views on pricing strategies. Raby and Madden (Citation2021b) find that 87% of conference participants accept a fee of £10, but only half of them agree on a fee of £25 and more. Participants at a virtual reality conference in the United States appear to accept fees up to US$237, but this is a specific case that might benefit more than others from the fully virtual version (Ahn et al., Citation2021).
Literature on the value of separate elements of physical conferences might have been useful as guidance on pricing strategies, but no such recent research is found. This means that organizers of virtual conferences do not yet know what fees they are allowed to charge.
There are also indications that successful virtual conferences attract larger groups of attendees, even those who during other circumstances would not have been able to participate (Niner & Wassermann, Citation2021; Peuler & McCallister, Citation2019; Raby & Madden, 2021). This is an additional factor that organizers need to reflect upon. Face-to-face conferences commonly have an alternative lower fee for part-time attendees or those accompanying a presenter.
Possible determinants of the fee consist of conference-specific and organization-specific factors. Hansen, Pedersen, and Foley (Citation2020) identify four differentiating dimensions of academic events: Size, focus, participants, and tradition, which could also be relevant quality aspects for the fee of virtual conferences. Thus, by mirroring these dimensions, the determinants considered in this study are size (duration), location of the host, association conference, field (focus), and time from the outbreak of the Covid-19 pandemic. At least the three first determinants express different elements of quality.
Larger conferences offer several keynote speakers and are more diversified, possibly an indication of quality. Hybrid conferences usually have two prices, one for participants who come in person and one for virtual participation (an example fof a hybrid conference is the Beijing·Pinggu 2020 World Leisure Hybrid Congress; https://reg.2020bjpg-leisure.com/meeting/pinggu2020).
Traditions and locations are other factors that may affect the fee. International academic conferences are usually held in larger cities that are academic centers and all have access to major transport hubs. This implies that large cities are particularly attractive as conference locations. An additional dimension to this attractiveness of face-to-face conferences arises if the location is also rich in cultural and other tourist attractions. Neither the accessibility nor the cultural attractiveness of the conference location are relevant for virtual conference fees.
Academic conferences organized by associations are likely to exhibit a higher reputation because there is often an international scientific committee organizing the conference and the association also holds a scientific journal. The latter might mean that there is a specific issue dedicated to the conference to which the participants can submit their papers. In the field of economics and computer science, studies conclude that presenting at an academic conference increases the chance of being published in a top-tier journal (Eckmann, Rocha, & Wainer, Citation2012; Gorodnichenko et al., Citation2021).
Conferences organized by research organizations or universities in countries with many top universities may hold an advantage over other locations and this kind of organizer is also less likely in need of proceeds from the event. In the dataset at hand, the United Kingdom accounts for the largest share of conference organizers or hosts followed by the United States. The conference fee probably also depends on the time since the outset of the pandemic. Over time, conference organizers learn the optimal pricing. Therefore, conference fees are likely to vary over time.
Thus, as opposed to physical conferences, virtual ones have fewer attributes to compete with and despite a growing body of research in the field, mainly based on case studies, demand for and operational pricing strategies of these events are still largely unknown. Among the quality aspects that implicitly account for the willingness to pay, the size and price relationship is expected to be the most pronounced one, since it is impossible to provide a larger conference without funding.
However, it needs to be considered that the marginal willingness to pay for a virtual academic conference could be low, despite offerings of speeches by distinguished scholars. This low willingness to pay is well known for online journals and news websites (Goyanes, Citation2014). Another important aspect, not yet possible to explore, is that good digital conference experiences, including interaction and engagement, most likely affect the willingness to pay for future conferences (Dua, Fyrenius, Johnson, & Moos, Citation2021).
Empirical approach
The willingness to pay for virtual conferences can be estimated using different kinds of methods: the hedonic price model (Rosen, Citation1974), stated preference methods such as conjoint or contingent valuation analyses based on price-response functions (Crouch, Del Chiappa, & Perdue, Citation2019; Green, Krieger, & Wind, Citation2001) as well as experiments or surveys (Breidert, Hahsler, & Reutterer, Citation2006; Miller, Hofstetter, Krohmer, & Zhang, Citation2011). Conjoint and other stated-preference methods are conducted in hypothetical situations without consumption consequences for the participants and thus it is questionable to what extent these studies uncover “true” consumer preference structures (Ding, Grewal, & Liechty, Citation2005). Hedonic pricing models have the advantage that they do not require surveys but instead use actual market prices for the attributes of services that depend on both demand and supply factors, to implicitly estimate the price determinants (Rosen, Citation1974). This method is often used for the housing and tourism sectors (Abrate & Viglia, Citation2016; Sheppard, Citation1999). A disadvantage of the same model is that detailed information on the attributes must be available.
While there is still imperfect information on the demand for virtual conferences, data on a variety of quality characteristics such as size, location of the host, number of keynote speakers, and responsible organization are available. This means that the willingness to pay or demand for the conference may be identified by use of the hedonic model, where the implicit value of the underlying characteristics of a product or service is established (attributes, location/accessibility) (Rosen, Citation1974). This method assumes perfect competition, no significant transaction costs, correct measurement of all attributes, and choice of the correct functional form (Rosen, Citation1974). The model predicts that the outcome of all independent decisions made by producers and consumers is an exact functional relationship between the price of the quality-differentiated good and the attributes embodied in that good (Rosen, Citation1974). Coefficients resulting from the hedonic price equation are then used to describe the valuation of the attributes. Commonly, hedonic price models use only those variables that are “direct characteristics,” that is, “intrinsic” to the product (Griliches, Citation1971). In this case, which assumes that there are no search or information costs, the fees of virtual conferences can be described as a function of the attributes of the conference.
The hedonic pricing model is regularly employed in the tourism and hospitality literature where both prices and several measurable characteristics normally are available (see Papatheodorou, Lei, & Apostolakis, Citation2012 for a review of the literature). Applications include determinants of hotel or Airbnb accommodation prices (Abrate & Viglia, Citation2016; Becerra, Santaló, & Silva, Citation2013; Thrane, Citation2007; Wang & Nicolau, Citation2017), holiday package tours (Thrane, Citation2005) or movie theaters (Arteaga, Coronado, & Flores, Citation2019), and urban recreation parks (Poudyal, Hodges, & Merrett, Citation2009). Given the theoretical considerations outlined above the hedonic price model used to estimate the determinants of fees for virtual conferences within the broader field of tourism is specified as follows:
(1)
(1)
where i denotes the conference,
is the constant, and
is the error term. Variable P reflects the conference fee in US Dollars for a nonmember of the hosting association who presents a paper (author) and is based on late registration. Size is a set of dummy variables representing the duration of the conference measured in days, Location is a dummy variable equal to one for the country with the largest number of online conferences (the United Kingdom), and Hybrid is a dummy variable equal to one if the conference is organized in hybrid format. The dummy variable Field is equal to one if the conference is within the main area of tourism and hospitality and zero otherwise, Association is a dummy variable indicating if the conference is hosted by an academic association, and Time measures the time in days since the start of the Covid-19 pandemic. THE is a dummy variable equal to one if the host university (or the main organizer) is listed in the Times Higher Education ranking and zero otherwise.
The conference fee variable is highly skewed and encompasses many zeros (no fees). Therefore, Ordinary least squares regressions are not suitable. Instead, the Poisson Pseudo Maximum Likelihood (PPML) regression developed by Santos Silva and Tenreyro (Citation2006) can be employed and give consistent estimates. The PPML estimator follows a Quasi-Poisson distribution and a log-link:
(2)
(2)
Cluster adjusted standard errors at the country level are used to account for the fact that conferences organized in the same country may share some common characteristics. As tourism conferences differ in their features from those in related fields results are presented for a subsample of conferences.
Data sources and descriptive statistics
Information on academic conferences in tourism and related fields originates from the Association for Tourism and Leisure Educational Research (http://www.atlas-euro.org/events.aspx) and from conference announcements in TRINet (Tourism Research Information Network). There are circa 200 conferences held or planned to be held during the period April 2020 to December 2021. More than half of these are postponed or canceled. This leaves 76 academic conferences for the analysis of which 46 are in the core field of tourism while the remaining ones are in related areas (geography, leisure, events, sports, heritage etc.) (Appendix, ). Conferences that do not published their programmes are excluded from the dataset. Facts on the start date, the number of days, main topic and the location of the organizer can be found on the website of each conference. Information on education ranking originates from the Times higher education database.Footnote1 The dependent variable refers to a late registration conference fee for nonmembers of the presumptive association. In case of hybrid conferences with differentiated rates, the online fee is used. All fees are expressed in US$, converted from other currencies using the exchange rate of the actual month for the conference, or the last available rate for future conferences. An association label is given to conferences that appear repeatedly over time. Kind of conference is identified through keywords (tourism, hospitality, recreation, sustainability, human geography, sport). In addition, the information whether the conference is fully virtual or in hybrid format is captured.
The average fee for a virtual conference is approximately US$126 and the median is US$61 (). Two-, three-, four-, or several-days conferences are most common, while one-day events represents less than one sixth. Hybrid format appears nine times and associations host three out of four events. The United Kingdom hosts 15 online conferences followed by the United States with 12. Europe (excluding the United Kingdom) holds 43% of the virtual conferences. Conference fees also vary by attributes, but the differences are not significant at the 5% level except for location and hybrid format, according to the t-tests applied (). The distribution of fees is right-tailed, with many free or low-cost conferences (). A similar pattern appears for the sub-sample of pure tourism conferences.
Figure 1. Histogram of conference fees in 2020–2021.
Note: Conference fees exceeding USD 400 are censured for a better graphical display. The curve shows the normal density curve. Source: Websites of the conferences listed in http://www.atlas-euro.org/events.aspx.
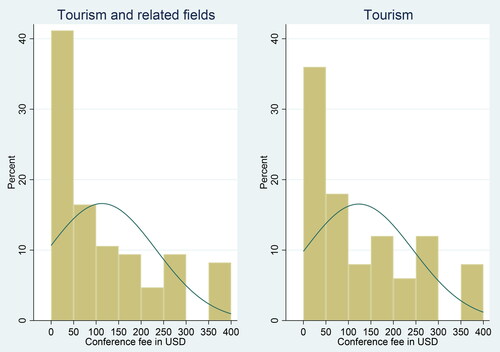
Table 2. Conference fees by attributes.
Empirical results
The Pseudo-Poisson Maximum Likelihood (PPML) estimates show that the conference fee is significantly associated with the size (duration), field, and the location of the organizer (). Size is highly significant, with the four-days or larger events being the most expensive ones. A conference within the core field of tourism means a higher fee (significant at the 10% level). There are also variations connected to the location of the organizer, where those based in the United Kingdom drives a lower price. Organized by an association, specific format (hybrid or fully virtual), inclusion in the Times Higher Education ranking or time passed since the outbreak of the Covid-19 pandemic are all aspects of no relevance for the fee (). This indicates that associations are not more valued than standalone conferences. The pseudo-R-squared is 0.43, implying that 43% of the variation of conference fees can be explained by the variables.
Table 3. Determinants of fees for virtual conferences, PPML estimations (tourism and related fields).
The marginal effects (dy/dx) of the PPML estimates directly indicate the strength of the associations and reveal that size and location of the host organization have the largest relevance for the willingness to pay for academic conferences. Shorter conferences are cheaper, with a one-day conference charging US$129 less than conferences with a planned duration of four or more days (). Two-days conferences cost US$69 less than conferences that are four days or longer. A one-day conference is on average US$60 cheaper than a two-day conference (calculated as $129-69). The willingness to pay is US$20 lower for hosts based in the United Kingdom, compared to those in other countries. The time elapse after the outbreak of the Covid 19 pandemic is significant at the 10% level, suggesting that the willingness to pay for online conferencing builds up over time.
Estimates for the sub-group of tourism conferences reveal that the hybrid format requires significantly higher fees than standard virtual gatherings, although, the results should be interpreted with caution because the number of hybrid conference is small (). The number of days elapsed since the start of the pandemic is also significantly connected to the price (5% level). This indicates that there is some learning effect in terms of pricing behavior over time. Variables size and organizer located in the UK are equally significant for the sub-sample of tourism conferences.
Table 4. Determinants of fees for virtual conferences, PPML estimations (tourism).
As robustness checks, both alternative estimations and an additional variable for quality are tested. In a Probit estimation, the underlying outcome variable is binary and takes the value of one if the organizer charges for the conference and zero otherwise. By using this approach, all explanatory variables are identical to those in the PPML specification. Unreported results show that size, location, and kind of conference are significant at the 5% levels (results are available upon request).
Typically, the offering of keynote speakers is an aspect that can attract participants and thus is also an important component of the price. Because of this, the number of academic keynote speakers at each conference is included as an additional quality variable. This estimation renders a positive and significant link, but unfortunately, the results are driven by outliers in the dataset, implying that the variable is too blunt in its present shape.
Conclusions
Virtual conferencing is a new phenomenon and factors driving demand as well as supply are not yet fully identified. This study provides novel empirical evidence on the willingness to pay for virtual academic conferences in tourism and related fields in connection with the individual immobility caused by the outbreak of the Covid-19 pandemic.
Data on 76 academic conferences in tourism and related fields, held or planned to be held during the period April 2020 to December 2021 show a skewed distribution where the median price is US$61 and the average is US$126. One fourth of the conferences is free of charge. Count data model estimations reveal that the fee depends on the size of the conference (duration), field and location of the organizer while other quality attributes such as reputation of the host university and whether the conference is annually re-occurring are not significant at conventional levels. Conferences in the core field of tourism are more expensive than in other areas, encompassing the hybrid format. Time elapsed after the outbreak of the pandemic is significant, indicating an increased willingness over time to pay for online conferences.
The median fee of $61 is lower than for a face-to-face conference, possibly relating to the offerings of the narrower format of a virtual event. This could mean that virtual conferences to an even larger extent have to compete with academic excellence to attract paying participants, including high level keynote speakers and strictly selective processes for acceptance of submitted papers. Virtual conferences are certainly also a clear drawback for those associations depending on conference fees for their sustainability.
The skewed distribution of fees emphasizes the uncertainty in the new market of virtual conferences and organizers have little information to guide them about the pricing of events. It is unclear if a high-priced virtual conferences can attract participants in the same way as physical gatherings or if it can compete with low-fee events. Organizers may have to consider if the conference costs can be fully covered by sponsors, or if the fee can take the format of cost-sharing among participants. Another aspect could be price differentiation, where those taking active part (presenters) pay less and possible additional attendees pay more, although still at a level far lower than for a physical conference. Since the technology allows reasonably large audiences, building on this might be a way forward to cover costs and also get some income to associations.
Still, there are apparent disadvantages with virtual conferences that are difficult to overbridge, such as the easy networking. Improvements in these aspects are needed to make virtual and hybrid conferences attractive in a post-pandemic era.
Future work would need larger datasets and more detailed information about quality attributes, such as the academic performance and reputation of the keynote speakers. This could also include other research techniques such as conjoint analysis to estimate willingness to pay for virtual conferences.
Acknowledgments
The authors would like to thank the organizers and participants of the Tourman 2021 conference for helpful comments on an earlier version of this study.
Disclosure statement
The authors have no conflicts of interests.
Notes
References
- Abrate, G., & Viglia, G. (2016). Strategic and tactical price decisions in hotel revenue management. Tourism Management, 55, 123–132. doi:10.1016/j.tourman.2016.02.006
- Ahn, S. J. G., Levy, L., Eden, A., Won, A. S., MacIntyre, B., & Johnsen, K. (2021). IEEEVR2020: Exploring the first steps toward standalone virtual conferences. Frontiers in Virtual Reality, 2(28). doi:10.3389/frvir.2021.648575
- Arteaga, J. C., Coronado, D., & Flores, D. (2019). On the pricing of quality attributes at movie theaters. Journal of Media Economics, 32(1-2), 1–16. doi:10.1080/08997764.2021.1883917
- Becerra, M., Santaló, J., & Silva, R. (2013). Being better vs. being different: Differentiation, competition, and pricing strategies in the Spanish hotel industry. Tourism Management, 34, 71–79. doi:10.1016/j.tourman.2012.03.014
- Borghans, L., Romans, M., & Sauermann, J. (2010). What makes a good conference? Analysing the preferences of labour economists. Labour Economics, 17(5), 868–874. doi:10.1016/j.labeco.2010.04.009
- Bottanelli, F., Cadot, B., Campelo, F., Curran, S., Davidson, P. M., Dey, G., … Swaffer, M. P. (2020). Science during lockdown–from virtual seminars to sustainable online communities. Journal of Cell Science, 133(15). doi:10.1242/jcs.249607
- Breidert, C., Hahsler, M., & Reutterer, T. (2006). A review of methods for measuring willingness-to-pay. Innovative Marketing, 2(4), 8–32. doi:10.1111/j.1369-7625.2011.00738.x
- Campos, R., Leon, F., & McQuillin, B. (2018). Lost in the storm: The academic collaborations that went missing in hurricane ISSAC. The Economic Journal, 128(610), 995–1018. doi:10.1111/ecoj.12566
- Chalvatzis, K., & Ormosi, P. L. (2021). The carbon impact of flying to economics conferences: Is flying more associated with more citations?Journal of Sustainable Tourism, 29(1), 40–67. doi:10.1080/09669582.2020.1806858
- Chen, S. H., & Tham, A. (2019). Trends in tourism-related academic conferences: An examination of host locations, themes, gender representation, and costs. Event Management, 23(4), 733–751. doi:10.3727/152599519X15506259855670
- Crouch, G. I., Del Chiappa, G., & Perdue, R. R. (2019). International convention tourism: A choice modelling experiment of host city competition. Tourism Management, 71, 530–542. doi:10.1016/j.tourman.2018.10.002
- de Leon, F. L. L., & McQuillin, B. (2020). The role of conferences on the pathway to academic impact evidence from a natural experiment. Journal of Human Resources, 55(1), 164–193. doi:10.3368/jhr.55.1.1116-8387R
- Dillette, A., & Ponting, S. S. A. (2021). Diffusing innovation in times of disasters: Considerations for event management professionals. Journal of Convention & Event Tourism, 22(3), 197–220. doi:10.1080/15470148.2020.1860847
- Ding, M., Grewal, R., & Liechty, J. (2005). Incentive-aligned conjoint analysis. Journal of Marketing Research, 42(1), 67–82. doi:10.1509/jmkr.42.1.67.56890
- Dolasinski, M. J., Roberts, C., Reynolds, J., & Johanson, M. (2021). Defining the field of events. Journal of Hospitality & Tourism Research, 45(3), 553–572. doi:10.1177/1096348020978266
- Draper, J., Dawson, M., & Casey, E. (2011). An exploratory study of the importance of sustainable practices in the meeting and convention site selection process. Journal of Convention & Event Tourism, 12(3), 153–178. doi:10.1080/15470148.2011.598353
- Dua, N., Fyrenius, M., Johnson, D. L., & Moos, W. H. (2021). Are in-person scientific conferences dead or alive?FASEB bioAdvances, 3(6), 420–427. doi:10.1096/fba.2020-00139
- Eckmann, M., Rocha, A., & Wainer, J. (2012). Relationship between high-quality journals and conferences in computer vision. Scientometrics, 90(2), 617–630. doi:10.1007/s11192-011-0527-2
- Edelheim, J. R., Thomas, K., Åberg, K. G., & Phi, G. (2018). What do conferences do? What is academics’ intangible return on investment (ROI) from attending an academic tourism conference?Journal of Teaching in Travel & Tourism, 18(1), 94–107. doi:10.1080/15313220.2017.1407517
- Foramitti, J., Drews, S., Klein, F., & Konc, T. (2021). The virtues of virtual conferences. Journal of Cleaner Production, 294, 126287. doi:10.1016/j.jclepro.2021.126287
- Fraser, H., Soanes, K., Jones, S. A., Jones, C. S., & Malishev, M. (2017). The value of virtual conferencing for ecology and conservation. Conservation Biology: The Journal of the Society for Conservation Biology, 31(3), 540–546. doi:10.1111/cobi.12837
- Gichora, N. N., Fatumo, S. A., Ngara, M. V., Chelbat, N., Ramdayal, K., Opap, K. B., … Hide, W. (2010). Ten simple rules for organizing a virtual conference-anywhere. PLoS Computational Biology, 6(2), e1000650. doi:10.1371/journal.pcbi.1000650
- Gill, M. J. (2021). High flying business schools: Working together to address the impact of management education and research on climate change. Journal of Management Studies, 58(2), 554–561. doi:10.1111/joms.12575
- Godovykh, M., & Hahm, J. J. (2020). Does the sequence of presentations matter for academic conferences? An application of the peak-end rule in event management. Journal of Convention & Event Tourism, 21(3), 201–224. doi:10.1080/15470148.2020.1760159
- Gorodnichenko, Y., Pham, T., & Talavera, O. (2021). Conference presentations and academic publishing. Economic Modelling, 95, 228–254. doi:10.1016/j.econmod.2020.12.017
- Gottlieb, M., Egan, D. J., Krzyzaniak, S. M., Wagner, J., Weizberg, M., & Chan, T. (2020). Rethinking the approach to continuing professional development conferences in the era of COVID-19. Journal of Continuing Education in the Health Professions, 40(3), 187–191. doi:10.1097/CEH.0000000000000310
- Goyanes, M. (2014). An empirical study of factors that influence the willingness to pay for online news. Journalism Practice, 8(6), 742–757. doi:10.1080/17512786.2014.882056
- Green, P. E., Krieger, A. M., & Wind, Y. (2001). Thirty years of conjoint analysis: Reflections and prospects. Interfaces, 31(3 Supplement), 56–73. doi:10.1287/inte.31.4.56.9676
- Griliches, Z. (1971). Price indexes and quality change: Studies in new methods of measurement. Cambridge, MA: Harvard University Press.
- Hahm, J. J., Breiter, D., Severt, K., Wang, Y., & Fjelstul, J. (2016). The relationship between sense of community and satisfaction on future intentions to attend an association’s annual meeting. Tourism Management, 52, 151–160. doi:10.1016/j.tourman.2015.06.016
- Hamm, S., Frew, E., & Lade, C. (2018). Hybrid and virtual conferencing modes versus traditional face-to-face conference delivery: A conference industry perspective. Event Management, 22(5), 717–733. doi:10.3727/152599518X15299559637635
- Hansen, T. T., Pedersen, D. B., & Foley, C. (2020). Academic events: An empirically grounded typology and their academic impact. Event Management, 24(4), 481–497. doi:10.3727/152599519X15506259856598
- Jones, C., & Li, S. (2015). The economic importance of meetings and conferences: A satellite account approach. Annals of Tourism Research, 52, 117–133. doi:10.1016/j.annals.2015.03.004
- Kim, B. H., Kim, S., & Oh, M. (2020). Determinants of convention attendees’ willingness to pay for additional programs. Journal of Convention & Event Tourism, 21(2), 155–176. doi:10.1080/15470148.2020.1731727
- Kim, C. S., Kim, P. B., Milne, S., & O’Neill, L. (2020). Key choice factors and preferences of attendees at academic hospitality and tourism conferences. Event Management, 24(2), 335–346. doi:10.3727/152599519X15506259856020
- Mair, J. (2010). Profiling conference delegates using attendance motivations. Journal of Convention & Event Tourism, 11(3), 176–194. doi:10.1080/15470148.2010.502032
- Mair, J., Lockstone-Binney, L., & Whitelaw, P. A. (2018). The motives and barriers of association conference attendance: Evidence from an Australasian tourism and hospitality academic conference. Journal of Hospitality and Tourism Management, 34, 58–65. doi:10.1016/j.jhtm.2017.11.004
- Miller, K. M., Hofstetter, R., Krohmer, H., & Zhang, Z. J. (2011). How should consumers’ willingness to pay be measured? An empirical comparison of state-of-the-art approaches. Journal of Marketing Research, 48(1), 172–184. doi:10.1509/jmkr.48.1.172
- Mubin, O., Alnajjar, F., Shamail, A., Shahid, S., & Simoff, S. (2020). The new norm: Computer Science conferences respond to COVID-19. Scientometrics, 126(2), 1–1827. doi:10.1007/s11192-020-03788-9
- Nahai, F. (2021). Does anybody really miss live meetings?Aesthetic Surgery Journal, 41(1), 137–139. doi:10.1093/asj/sjaa292
- Niner, H. J., & Wassermann, S. N. (2021). Better for whom? Leveling the injustices of international conferences by moving online. Frontiers in Marine Science, 8, 146. doi:10.3389/fmars.2021.638025
- Papatheodorou, A., Lei, Z., & Apostolakis, A. (2012). Hedonic price analysis. In L. Dwyer, A. Gill, & N. Seetaram (Eds.), Handbook of research methods in tourism: Quantitative and qualitative approaches (Chapter 9, pp. 170–182). Cheltenham, United Kingdom: Edward Elgar Publishing.
- Peuler, M., & McCallister, K. C. (2019). Virtual and valued: A review of the successes (and a few failures) of the creation, implementation, and evaluation of an inaugural virtual conference and monthly webinars. Journal of Library & Information Services in Distance Learning, 13(1-2), 104–114. doi:10.1080/1533290X.2018.1499240
- Poudyal, N. C., Hodges, D. G., & Merrett, C. D. (2009). A hedonic analysis of the demand for and benefits of urban recreation parks. Land Use Policy, 26(4), 975–983. doi:10.1016/j.landusepol.2008.11.008
- Raby, C. L., & Madden, J. R. (2021a). Moving academic conferences online: Understanding patterns of delegate engagement. Ecology and Evolution, 11(8), 3607–3615. doi:10.1002/ece3.7251
- Raby, C. L., & Madden, J. R. (2021b). Moving academic conferences online: Aids and barriers to delegate participation. Ecology and Evolution, 11(8), 3646–3655. doi:10.1002/ece3.7376[PMC]. 33898017
- Rich, S., Diaconescu, A. O., Griffiths, J. D., & Lankarany, M. (2020). Ten simple rules for creating a brand-new virtual academic meeting (even amid a pandemic). PLoS Computational Biology, 16(12), e1008485. doi:10.1371/journal.pcbi.1008485
- Roos, G., Oláh, J., Ingle, R., Kobayashi, R., & Feldt, M. (2020). Online conferences–Towards a new (virtual) reality. Computational and Theoretical Chemistry, 1189, 112975. doi:10.1016/j.comptc.2020.112975
- Rosen, S. (1974). Hedonic prices and implicit markets: Product differentiation in pure competition. Journal of Political Economy, 82(1), 34–55. doi:10.1086/260169
- Ryan, W. G., Fenton, A., Ahmed, W., & Scarf, P. (2020). Recognizing Events 4.0: The digital maturity of events. International Journal of Event and Festival Management, 11(1), 47–68. doi:10.1108/IJEFM-12-2019-0060
- Santos Silva, J., & Tenreyro, S. (2006). The log of gravity. The Review of Economics and Statistics, 88(4), 641–658. doi:10.1162/rest.88.4.641
- Sarabipour, S., Khan, A., Seah, Y. F. S., Mwakilili, A. D., Mumoki, F. N., Sáez, P. J., … Mestrovic, T. (2021). Changing scientific meetings for the better. Nature Human Behaviour, 5(3), 296–300. doi:10.1038/s41562-021-01067-y
- Schoening, E. (2020). How to Rethink Event Pricing and Refunds. NorthStar Meetings Group. Retrieved from https://www.northstarmeetingsgroup.com/Planning-Tips-and-Trends/Event-Planning/Attendee-Engagement/Refund-Pricing-Strategy-Coronavirus-Meeting-Event-Conference-Postponed-Cancelled-Virtual
- Seraphin, H. (2021). COVID-19: An opportunity to review existing grounded theories in event studies. Journal of Convention & Event Tourism, 22(1), 3–35. doi:10.1080/15470148.2020.1776657
- Sheppard, S. (1999). Hedonic analysis of housing markets. In E. Mills (Ed.), Handbook of regional and urban economics (Chapter 41, Vol. 3, pp. 1595–1635), Elsevier, Amsterdam.
- Speirs, V. (2020). Reflections on the upsurge of virtual cancer conferences during the COVID-19 pandemic. British Journal of Cancer, 123(5), 698–699. doi:10.1038/s41416-020-1000-x
- Thrane, C. (2005). Hedonic price models and sun-and-beach package tours: The Norwegian case. Journal of Travel Research, 43(3), 302–308. doi:10.1177/0047287504272034
- Thrane, C. (2007). Examining the determinants of room rates for hotels in capital cities: The Oslo experience. Journal of Revenue and Pricing Management, 5(4), 315–323. doi:10.1057/palgrave.rpm.5160055
- van Ewijk, S., & Hoekman, P. (2021). Emission reduction potentials for academic conference travel. Journal of Industrial Ecology, 25(3), 778–788. doi:10.1111/jiec.13079
- Wang, D., & Nicolau, J. L. (2017). Price determinants of sharing economy based accommodation rental: A study of listings from 33 cities on Airbnb.com. International Journal of Hospitality Management, 62, 120–131. doi:10.1016/j.ijhm.2016.12.007
Appendix
Table A1. Lists of virtual conferences.