
Abstract
User-related assessment of a level 3 automated driving system, providing functions such as lane- and distance-keeping, stop & go driving, lane change and overtaking, was carried out on a motorway in Germany with the aim to assess user-related issues of automated driving, i.e., behavior when driving with automation on motorways, user experiences, reactions and acceptance. Twenty-one persons drove twice along the test route once with the system switched off and once with the system active. Driving data were logged and driving behavior was observed by two observers in the car and the drivers answered questionnaires. The results revealed that the drivers used the system as it was intended to be used and that the system affected driving positively in several ways, resulting in better speed adaptation, less speed variation, better distance keeping, better lane choice, better indicator usage and fewer dangerous lane changes. No differences with regard to subjective workload were shown. The system was perceived as being both useful and satisfactory. However, it was found that the system did not react to other drivers’ intention to make a lane change, especially in situations where they were attempting to merge onto the motorway. Further development is needed to improve the system’s ability to recognize other vehicles’ intention to enter the vehicle’s own lane. Also, the phenomenon of the driver “feeling guilty” because of the system’s reckless behavior by not allowing other drivers to merge onto the motorway or hindering other cars behind due to lengthy overtaking should be investigated further.
Introduction
Automated driving systems are aimed at improving safety, efficiency and comfort, but since driver reactions and acceptance play a decisive role in making these systems a reality on roads, understanding user-related issues is of substantial importance. Brackstone and Mcdonald (Citation2000) reviewing the issue of driver interaction with Advanced Vehicle Control and Safety Systems, concluded that even if behavioral research issues were well advanced, much work was still required before these systems can be readily deployed. There are a large number of user-related issues concerning automated driving applications. Stanton and Young (Citation1998), as well as Saffarian et al. (Citation2012) presented a number of psychological issues pertinent to vehicle automation that they noted should be considered in empirical evaluation studies. These issues include locus of control, the trust the driver has in the automated system, the situation awareness of the driver, the mental representation that the driver develops of the automated system, the mental and physical workload associated with automation, feedback, driver stress and its implications. The relevance of these and additional issues are briefly described below:
Behavior related issues: People adapt their behavior as a response to changes in the road-vehicle-user system (Smiley, Citation2000). Reallocation of attention is an intelligent response to the change (OECD, Citation1990). The adaptive process develops dynamically over time, based on operator experiences of interaction with the automated system (Parasuraman & Manzey, Citation2010). de Winter et al. (Citation2014) in their literature review concluded that drivers of a highly automated car ‘are strongly inclined to engage in non-driving tasks, such as watching a DVD or even sleeping’ (p. 206).
Understanding of automation issues: An insufficient and/or erroneous mental model the driver develops of the automated system may lead to increased risk of user errors (Preece et al., Citation2002). Jenness et al. (Citation2008) in a survey among early adopters of in-vehicle technology found that system owners often do not understand the limitations of the systems and manufacturers’ warnings. Heikoop et al. (Citation2018) concluded that mental models ‘… are not self-correcting, but rather become increasingly complex with time’, suggesting that if drivers don’t receive prior information or training on the automated driving system they use, they could retain an inaccurate mental model.
Trust and reliance related issues: Over- or under-reliance on automation can have crucial effects on automation outcome. Users rely more on automation they trust more (Merritt, Citation2011). Over-trust may lead to misuse of automation, leading to failure of the driver to override the system when necessary and under-trust may yield disuse of automation when users fail to rely on automation when doing so would improve performance (Parasuraman & Riley, Citation1997). There is a variation among users, younger and older users rely on automation differently (McBride et al., Citation2010). Merritt et al. (Citation2012) found that user trust in automation was influenced by both implicit and explicit attitudes.
Locus of control (i.e. the extent to which removal of control from the driver affects the performance of the vehicle/driver entity). Locus of control refers to the extent to which individuals believe they can control events affecting them. Drivers with an internal locus of control believe their vehicle performance derives primarily from their own actions, while drivers with an external locus of control believe the behavior of the vehicle is due to the automated system (Halpert & Hill, Citation2015). Stanton and Young (Citation1998) mean that some drivers may perceive that they are in overall control of the vehicle when it is in automated mode whereas others may not. According to them, research findings had shown that people with an internal locus of control generally perform better than individuals with an external locus of control which might be attributed to the degree of task engagement for the individual. An internal locus of control may lead drivers to take on an active role, while an external locus of control might lead a driver to assume a passive role with the automated system. Stanton and Young (Citation1998) found that the passive drivers failed to intervene when the automated system failed whereas the active drivers took control of the situation.
Resuming control of driving is an important issue in automation. de Winter et al. (Citation2014), based on the findings in their literature review suggest that drivers during highly automated driving are susceptible to drowsiness, which might evoke longer response times than during manual driving. However, if drivers receive a timely warning then they are able to safely regain control in a critical situation. Merat et al. (Citation2014) examined how different methods of transferring control of a Level 3 automated vehicle affected the driver’s ability to resume control and found ‘an overall better performance by drivers when control was transferred after a fixed duration of 6 min, compared to when the automated system disengaged if drivers removed their visual attention away from the road centre’ (p. 281). Gold et al. (Citation2018) studied a number of take-over performance variables based on more than 700 take-over situations in level 3 conditional automated driving in a series of driving simulator experiments. They found that time-budget, traffic density and repetition of take-over situations strongly influenced drivers’ take-over performance, while drivers’ age, lane and non-driving related tasks only explained minor part of the variance in take-over performances.
There is a non-negligible risk that skill degradation accompanies automation of the driving tasks due to overreliance, as the reinforcement coming from constant engagement in the driving task becomes absent (Trimble et al., Citation2014). Endsley and Kiris (Citation1995) refer to Shiff (Citation1983) who found that ‘despite initial manual training, those subjects who had been operating as supervisory controllers of automation in a simulated process control task were slower and more inefficient in bringing the system under control than were subjects who had operated only in a manual mode’ (p. 381). de Winter et al. (Citation2014) in their literature review found indications that ‘after seeing or experiencing automated driving, drivers show poorer lane keeping performance, shorter headways, or delayed reaction times as compared to drivers who have not seen/experienced automated driving’ (p.211).
Automation monitoring may lead to increased mental workload of the driver. Humans are inefficient in monitoring automation (Parasuraman et al., Citation1993; Singh et al., Citation1997; Sheridan, Citation2002; Strand, Citation2014). Overreliance on automation contributes to this inefficiency (Parasuraman & Riley, Citation1997). Banks et al. (Citation2014) in a case study concluded that the number of processes conducted by the driver appear to increase as the level of automation increases. In intermediate levels of automation, driver decision-making remains apparent (only at full automation can this decision be removed). The addition of sub-system monitoring increases task loading and hence driver workload as the driver must remain aware of system state and operation. Automation has different effects on users’ (younger or older) workload (McBride et al., Citation2010). However, de Winter et al. (Citation2014) in their literature review concluded that almost all simulator and on-road studies provided strong evidence that highly automated driving reduced workload as compared to manual driving.
Stress is a factor that may affect driver workload and safety (McDonald & Davey, Citation1996). Stress and vehicle automation has been studied by Funke et al. (Citation2007), who explored (among others) the effects of stress and vehicle automation on driver performance manipulating stress by exposing drivers to a loss of control experience and found that both stress and automation influenced subjective distress, with higher levels of distress under the stressful driving conditions and lower levels of distress under the automated speed control conditions; however, the two factors did not interact. Reimer et al. (Citation2010) evaluated the extent to which vehicle-parking-assist systems affected driver stress by using heart rate measurements along with self-reported ratings and found that participants exhibited lower average heart rates and they reported lower stress levels when using the assistive parking system.
Boredom in low-task-load environment might lead to distraction (Cummings et al., Citation2013). According to Farmer and Sundberg (Citation1986) ‘Boredom is a common emotion, with boredom proneness a predisposition with important individual differences.’ (p.4). Stark and Scerbo (Citation1998) found significant correlations between boredom proneness, workload, and complacency potential, which might indicate that the psychological state of boredom may be a factor that induces complacency (Prinzel et al., Citation2001). Also, Sawin and Scerbo (Citation1995) in their vigilance tasks study found association between boredom proneness and vigilance performance.
Fatigue may affect driving performance negatively (Brown, Citation1997) and it reportedly contributes to a significant share of car accidents (Maycock, Citation1995). Prolonged driving may induce a variety of fatigue symptoms such as drowsiness, boredom, irritation, physical discomfort and daydreaming (Matthews & Desmond, Citation1998). Matthews and Desmond (Citation2002) found that fatigue induction elicited various subjective fatigue and stress symptoms, raised reported workload, increased heading error, reduced steering activity, and reduced perceptual sensitivity on a secondary detection task. Their results suggest that task-induced fatigue is associated with impaired performance evaluation in ‘underload’ and ‘interventions should be geared toward enhancing driving motivation, rather than reducing attentional demands on the driver’ (p.681). They conclude that ‘passive fatigue’ (associated with tasks requiring monitoring the environment but infrequent response) ‘may become increasingly common in intelligent vehicle highway systems as control passes from driver to vehicle, and it merits further investigation’ (p.681).
The situation awareness of the driver concerning the driving context and the operational status of the system is of vital relevance. According to Endlsey’s (Citation1995) definition: ‘Situational awareness is the perception of the elements in the environment within a volume of time and space, the comprehension of their meaning and a projection of their status in the near future’ (p.36). Endsley’s (1995) model of situation awareness is arranged into three hierarchical levels: 1) Perception of the elements in the environment, 2) Comprehension of the current situation, 3) Prediction of future status. Endsley also proposes that situation awareness is discussed in terms of mode awareness, spatial awareness and time awareness. Increased automation may increase the tendency of shifting attention away from the driving task (Carsten et al., Citation2012). Endsley and Kiris (Citation1995) studied the automation of a navigation task and found that situation awareness was lower under automated conditions than under manual conditions and low situation awareness corresponded with out-of-the-loop performance decrements in decision time following a failure of the system. Based on a review of earlier studies, Stanton et al. (Citation2001) conclude that ‘loss of situational awareness is correlated with poor system performance’ and ‘people who have lost situational awareness may be slower to detect problems with the system they are controlling as well as requiring additional time to diagnose problems and conduct remedial activities when they are finally detected’ (p.199). Heikoop et al. (Citation2018) in a driving simulator study, investigated the impact of a mental secondary task on driver situation awareness during platoon driving and found that mental demand impaired situation awareness. Based on a meta-analysis and narrative review of simulator and on-road studies, de Winter et al. (Citation2014) concluded that highly automated driving can improve situation awareness compared to manual driving if drivers are motivated or instructed to detect objects in the environment. However, if drivers are engaged in non-driving tasks, situation awareness deteriorates.
The ‘out-of-the-loop’ performance problem making the driver handicapped in his/her ability to take over in the event of automation failure is attributed to loss of situation awareness and skill degradation, which leads to declining operator performance (Endsley & Kiris, Citation1995). There is no failure free system (Perrow, Citation1984). If reliability is below 70 per cent, it is better having no automation at all (Wickens & Dixon, Citation2007). Automation failure detection better with varying automation reliability (Parasuraman et al., Citation1993). When exposed to automation failure drivers perform better with a lower level of automation (Nilsson, Citation1995; Vollrath et al., Citation2011). Complacency and over-reliance may cause loss of situation awareness leading to errors when automation fails (Parasuraman & Manzey, Citation2010).
Automation-related complacency may occur when the operator has to perform both manual tasks and supervise automation. It can be described in terms of an attention allocation strategy where the operator may attend to manual tasks at the expense of the automated task, especially when task load is high (Parasuraman & Manzey, Citation2010). Wiener (Citation1981) defined complacency as ‘a psychological state characterized by a low index of suspicion’ (p.117). Parasuraman and Manzey (Citation2010) concluded that ‘attention allocation away from the automated task associated with complacency may include not only fixation failures but attention failures as well’ (p.389). Complacency may lead to the consequence that a system malfunction, anomalous condition, or failure is missed or reaction is delayed (Parasuraman & Manzey, Citation2010). Parasuraman et al. (Citation1993) reported considerable individual differences in the performance effects associated with automation complacency. Also, Prinzel et al. (Citation2001), investigating the relationship between individual differences of complacency potential, boredom proneness and automation-induced complacency, found that personality individual differences are related to whether an individual will succumb to automation induced complacency. de Winter et al. (Citation2014) in their literature review found indications that highly automated driving evoke complacent behavior For example, not disengaging the automated driving system, in a speed limit violations scenario, thereby allowing the vehicle to drive above the posted speed limit.
Automation bias is reflected in omission errors (the user fails to respond to a critical situation because the automation aid failed to notify him/her) and commission errors (following a wrong recommendation) made by operators when decision aids are imperfect (Parasuraman & Manzey, Citation2010). According to Mosier and Skitka (Citation1996) automation bias is characterized by that operators use the decision aid as a heuristic replacement for vigilant information seeking and processing and commission errors can be the result of not seeking out confirmatory or disconfirmatory information or discounting other sources of information in the presence of computer-generated cues. Automation bias can lead to decisions that are not based on a thorough analysis of all available information but that are biased by the advice of decision aid and it can compromise performance considerably in case of automation failures (Parasuraman & Manzey, Citation2010). One reason for automation bias is that users have a tendency to ascribe greater power and authority to automated aids than to other sources of advice (Parasuraman & Manzey, Citation2010). User trust in automated aids as powerful agents with superior capability might make users to overestimate the performance of the aids as they may ascribe to the aid greater authority than to other humans or themselves (Parasuraman & Manzey, Citation2010). Another contributory factor to automation bias is the phenomenon of diffusion of responsibility. When sharing monitoring and decision-making tasks with an automated aid (or other humans in a group) humans may reduce their own effort compared to when they work individually on a given task. The operator may perceive him/herself as less responsible for the outcome and, as a consequence, reduce his/her own effort in monitoring and analyzing other available information (Domeinski et al., Citation2007).
In a review of empirical studies of complacency and bias in human interaction with automated and decision support systems, Parasuraman and Manzey (Citation2010) found that complacency and automation bias represent different manifestations of overlapping automation-induced phenomena, where attention plays a central role. Further, they found that automation complacency and automation bias occurred in both naive and expert operators and it cannot be prevented by training or instructions. An integrated model of complacency and automation bias put forward by Parasuraman and Manzey (Citation2010) implies that these issues result from the dynamic interaction of personal, situation and automation-related characteristics.
Usability of a product is of importance for its success among potential users. There are various definitions of usability, but as Harvey et al. (Citation2011) expressed, ‘consideration of the context of use is essential in defining usability criteria and this will be different for each system under investigation’ (p.563).
Acceptance is a key factor for intended use of new technology in the vehicle (Adell et al., Citation2014a). However, as Adell et al. (Citation2014b) put it: ‘Despite the recognized importance of acceptance there is no established definition of acceptance, and there are almost as many ways to measure acceptance as there are researchers trying to do so’ (p.73).
A literature search in Scopus and Web of science revealed that numerous driving simulator test with automated driving have been carried out studying different aspects of automation, such as:
Driver-automation cooperation (Beller et al., Citation2013);
Driver attention to the driving environment (Muhrer et al., Citation2012) and gaze behavior during automated driving (Louw & Merat, Citation2017);
Driver engagement in non-driving related tasks during automated driving (Carsten et al., Citation2012; Merat et al., Citation2014b; Murase et al., Citation2018; Muhrer et al., Citation2012);
The impact of peripheral visual information in alleviating motion sickness when engaging in non-driving tasks in fully automated driving (Karjanto et al., Citation2018)
Driver response when experiencing a safety critical take-over request (Blommer et al., Citation2017; Merat et al., Citation2014b; Naujoks et al., Citation2017; Shen & Neyens, Citation2017; Vogelpohl et al., Citation2018; Zeeb et al., Citation2015);
Necessary time for drivers to achieve situation awareness (Agrawal et al., Citation2017; Vlakveld et al., Citation2018);
How situation awareness in transfer of control is affected by driver fatigue, stress, (Neubauer et al., Citation2012); by workload (de Winter et al., Citation2014); by mental task demands (Heikoop et al., Citation2018); by alert cue specificity (Forster et al., Citation2017; Wright et al., Citation2017); and by driver experience (Wright et al., Citation2016b);
Resuming control from the automation (Bueno et al., Citation2016; Clark & Jing Feng 2017; Gold et al., Citation2015; Merat & Lee, Citation2012; Merat et al., Citation2014; Merat et al., Citation2014b; Naujoks et al., Citation2018; Navarro et al., Citation2016; Petermeijer et al., Citation2017; Payre et al., Citation2017; Radlmayr et al., Citation2014; Zeeb et al., Citation2017; Zhang et al., Citation2018);
Post-transition driving performance (Berthelon & Gineyt, Citation2014; Louw et al., Citation2017; Merat et al., Citation2012; Miller et al., Citation2015; Mok et al., Citation2015; Naujoks et al., Citation2015; Naujoks, Purucker, et al. Citation2017; Radlmayr et al., Citation2018; Strand et al., Citation2014; Zeeb et al., Citation2016);
The effect of alcohol level on take-over performance (Berthelon & Gineyt, Citation2014; Wiedemann et al., Citation2018);
Drivers’ trust in automation (Large et al., Citation2018; Molnar et al., Citation2018; Wright et al., Citation2016);
Psychosocial factors associated with intended use of automated vehicles (Buckley et al., Citation2018);
Effectiveness of a Virtual Reality training program for acquiring interaction skills in automated cars (Sportillo et al., Citation2018);
Validation of driving simulator concerning non-critical control transactions against road driving conditions (Eriksson et al., Citation2017).
These studies cover various aspects of driver-automation interaction, but there are very few studies investigating the interaction of the driver/automation with surrounding vehicles/drivers. Gouy et al. (Citation2014) examined ‘contagion’ effects from the short time headway held in platoons on the drivers of unequipped vehicles. Schopf et al. (Citation2018) studied cooperative lane-change maneuvers in automated motorway driving and Kauffmann et al. (Citation2018) studied which aspects of lane change behavior of an automated vehicle make them cooperative from the perspective of other drivers.
Kyriakidis et al. (Citation2019), based on interviews conducted with 12 expert researchers in the field of human factors of automated driving concluded, among others, that the researchers underpinned the importance of studies on public roads to validate findings from simulator experiments. Besides, real life studies are important for identifying situations relevant for automated driving applications, generating hypotheses for further studies and for studying interactions with road users around the observed driver. However, our literature search revealed that very few real life/on-road tests have been carried out with automated vehicles. One study addressed the issue of enabling a comfortable highly automated driving style by collecting driving data from participants manually driving in different road environments (Bellem et al. Citation2016). Another study investigated driver engagement in secondary task (Naujoks et al. Citation2016) and a third one investigated the learning process, as well as the development of trust, acceptance and the mental model for interacting with adaptive cruise control (Beggiato, et al. Citation2015).
Rosenfeld et al. (Citation2015) pointed out that “although individual drivers have different driving styles and preferences, current systems do not distinguish among users” and introduced an approach to combine machine learning algorithms with demographic information and behavioral driver models into existing automated assistive systems. The authors claim that their proposed approach can reduce the interactions between drivers and automated systems by adjusting parameters relevant to the operation of these systems based on their specific drivers and context of drive.
Findings from user-related real-life tests of Advanced Driver Assistance Systems (ADAS) (Várhelyi & Mäkinen, Citation2001; Hjälmdahl & Várhelyi, Citation2004a; Adell et al., Citation2008; Adell et al., Citation2011; Kaufmann & Risser, Citation2012; Várhelyi et al., Citation2015) show, that even when these systems deliver the expected positive effects, unwanted behavioral changes also can occur, altering the expected potential safety effects of the system in question. Hence, it is important to examine not just the expected effects, but also potential unwanted effects. A comprehensive evaluation for user-related assessment permitting the investigation of all the above issues would comprise tests in a naturalistic driving environment (real traffic), as well as tests in a driving simulator with naïve (normal) test drivers. Observation of driver behavior in real traffic yields the highest validity in terms of results, whereas driving simulator experiments allow for the staging of situations where, e.g., situation awareness and potential complacency can be studied. In either case, carrying out all these tests is resource- and time-consuming; hence, an evaluation plan must focus on the most rewarding tests.
Considering the available resources and time, the aim of the study described in the present paper was to assess user-related issues of automated driving functions, i.e., behavior when driving with automation on motorways, as well as user experiences, reactions and acceptance.
Method
The system
Within the AdaptIVe EU-project, a ‘motorway-automation’ system was developed. The system, installed in a passenger car, provides the following automated driving functions: (a) lane keeping and distance keeping; (b) stop & go driving; (c) lane change and overtaking. These driving functions were developed as level 3 (conditional automation) functions (SAE, 2014).
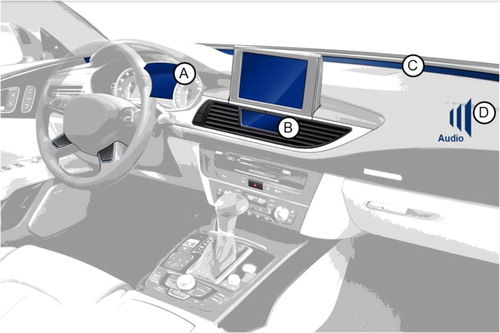
The operational conditions of the system were motorway settings with speeds between 60 and 130 km/h (while driving without the system active the test drivers also could choose higher speeds than 130 km/h) and traffic flow varying from free flow to a traffic jam. The system was to operate in all, but extreme weather conditions. The functionalities of the system included keeping the lane and the distance to the vehicle ahead and if the preceding vehicle in the same lane drove slower than the system-predefined safe speed or the driver-selected speed, an overtaking maneuver was initiated. The lane-change function monitored the areas on both sides of the vehicle and decided whether a lane change was possible. If the planned function was system-approved, then the driver was informed via a display in order to ensure mode awareness. Otherwise, the system waited until either the maneuver could safely be conducted or the need for a lane change no longer existed. Once the overtaking maneuver was completed, the car continued traveling in automated lane-keeping/vehicle-following mode. The driver could change the desired speed at any time, similarly to setting the desired speed with an active cruise control system. The system registered this new set speed and displayed it to the driver as a confirmation. The system was always activated after entering the motorway and deactivated shortly before leaving the motorway by the safety driver (who sat in the front seat, next to the test driver). The test drivers could take over on their own desire, but they only had to take over when leaving the motorway. The system announced this by voice command and a blinking LED bar (changing from green to red depending how important it was that the test driver took over). In case of any malfunction or system brake down, the safety driver would intervene.
The driver interface consisted of a screen in the instrument cluster, a navigation screen and a central status indicator screen, as well as an LED bar on the windscreen and voice response (see ). The automated driving mode could be activated by pressing the two dedicated buttons on the steering wheel at the same time, and the system could be deactivated by pressing either of the buttons again or by using the steering wheel or the gas or brake pedals. An emergency off-button allowed the driver to cut off power to the actuators in case of a system failure.
Figure 1. The interface elements in the test car: (A) instrument cluster, (B) central status indicator, (C) LED bar, (D) speech/sound.
Research questions
Based on the relevant issues in user-related evaluation of automated driving applications listed above and considering the available evaluation tools – i.e., a fully equipped vehicle - the following research questions were formulated:
Driver behavior and performance issues: (a) Do drivers use the system as it is intended to be used? (b) Do drivers use the system in all situations for which it is available? (c) Do drivers retain the system settings suggested by the system? (d) Does driver behavior differ when driving with the system active compared to driving without automation?
Effects of automation on the driving task: (a) Is stress or the mental workload of the driver affected by automation? (b) Do drivers engage more in secondary tasks when driving with automation compared to driving without automation?
Regaining control: (a) Do drivers detect automation failures? (b) Do drivers act in a timely and appropriate way when a safety-critical event occurs?
Trust and acceptance: (a) Do drivers trust the system? (b) Do drivers find the system useful and satisfactory?
Participants
The test drivers were recruited from a test driver pool. Twenty-seven persons took part in the study: 12 males and 15 females (see ). As an incentive, the test drivers could choose between a voucher for internet shopping or an advent calendar valued at about 20 to 30 Euros.
Table 1. The number of test drivers by age and gender.
Materials
The test vehicle was equipped with data-logging facilities, and a number of variables, including speed, distance from the vehicle ahead and lane position, etc. were logged.
The test drivers were observed by means of an in-car observation method developed and validated by Risser and Brandstatter (Citation1985). Other validation work was done by Hjälmdahl and Várhelyi (Citation2004b), who showed that drivers’ speed levels with observers in the car did not differ from their speed levels without observers in the car. During the observations, two specially trained observers rode in the car with the driver. One observer (called the coding observer) registered the number of events for each standardized variable, such as:
Adaptation of speed at ramps (late/inappropriate),
Distance keeping (too close to the vehicle in front <1 second),
Lane keeping (drifting/lane crossing),
Lane change (wrong lane choice/too late/dangerous/hesitant),
Use of turning indicator (early/late/inappropriate/not at all).
The other observer made ‘free observations’ of distinctive events, e.g. handling the system (in critical situations), interactions with other road users, which are hard to predict, let alone standardize. In detail, interaction processes are situations where other road users are present and the behavior of one person produces stimuli for the behavior of other persons. Positive (e.g. friendly) and negative processes (e.g. ruthlessness) can be observed. Interaction can be using hand gestures but also behavior such as braking (to let other car drivers change lane) or accelerating (to show that the driver does not give way to others). Furthermore, conflicts, according to the Swedish Traffic Conflicts Technique (Laureshyn & Várhelyi, Citation2018) were observed. A traffic conflict is an event where there is a collision course with a time to collision shorter than ∼1 sec., and where an accident is avoided thanks to the evasive action of at least one of the involved road users (or in this study also by the safety driver). Interaction processes and conflicts were noted during the test ride with short key words and written down in detail immediately after the test ride.
Questionnaires were used to assess the test drivers’ experience with the system, covering the following issues:
Subjective workload of the test drivers was assessed via the Raw Task Load indeX (RTLX) method (Byers et al., Citation1989). According to this method, the subjects rate six different workload aspects, namely mental demand, physical demand, time pressure, performance, effort and frustration level. Continuous scales ranging from ‘very low’ (0) to ‘very high’ (10) were used. After both the first and second driving tests, the test persons filled out a short questionnaire on the workload experienced during driving. The difference in workload between driving with the system on and off was calculated for each test driver.
To assess trust in the system, a 6-item scale proposed by Merritt (Citation2011) was used. The item responses were measured on a 5-point Likert-type scale ranging from 1 (strongly disagree) to 5 (strongly agree). The statements were as follows: (1) ‘I believe the system is a competent performer’; (2) ‘I trust the system’; (3) ‘I have confidence in the advice given by the system’; (4) ‘I can depend on the system’; (5) ‘I can rely on the system to behave in consistent ways’; (6) ‘I can rely on the system to do its best every time I take its advice’.
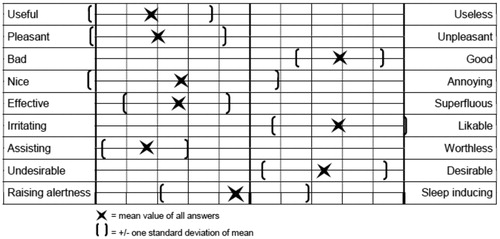
Usefulness and satisfaction were assessed based on the method proposed by Van der Laan et al. (Citation1997). According to the method, subjects assess nine components related to usefulness and satisfaction: ‘good – bad’, ‘pleasant – unpleasant’, ‘effective – superfluous’, ‘nice – annoying’, ‘likable – irritating’, ‘useful – useless’, ‘assisting – worthless’, ‘desirable – undesirable’, ‘raising alertness – sleep inducing’ on a continuous scale.
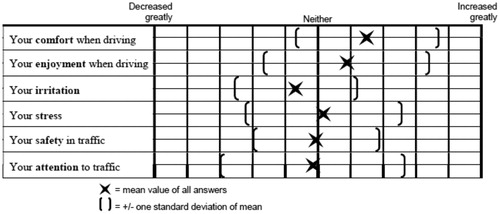
The test drivers were asked to compare their driving experiences regarding safety, attention, irritation, stress, enjoyment and comfort when using the system to their driving experiences without it on a continuous scale from ‘decreased greatly’ to ‘increased greatly’, where ‘neither’ represented the middle point.
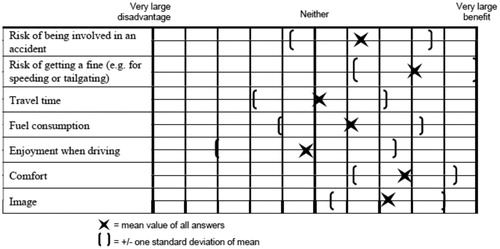
The participants were asked to state to what extent they thought the system would give them benefits or disadvantages regarding some given items, such as risk of being involved in an accident, risk of getting a fine, travel time, fuel consumption, enjoyment when driving, comfort and image, if they were to use the system in everyday driving. The answers were given on a continuous scale from ‘very large disadvantage’ to ‘very large benefit’, with ‘neither’ representing the middle point.
Questions concerning Human Machine Interaction (HMI) issues regarded activation and deactivation buttons (their intuitiveness), as well as supportiveness, comprehensibility, trustworthiness, level of distraction, and location preferences. The answers were given on a continuous scale from ‘very bad’ to ‘very good’, where ‘neither’ represented the middle point.
An additional open question on user perceptions of the system was also asked.
Design
The independent variable was the driving mode: with or without automation. The dependent variables are shown in .
Table 2. Dependent variables and data collection methods.
Traffic intensity was kept under control by choosing observation periods outside rush hours, and weather/road conditions were monitored by the observers in the car.
A within-group design was used. The test drivers drove twice along the test route. They served as their own controls. The order of driving was balanced in such a way that every other subject drove first with the system switched off and then with the system switched on. For the following subject, the order of driving was reversed. By doing this, the effects of biasing variables, such as becoming familiar with the test route, the observers and the test situation, though not eliminated, were spread evenly across the situations.
Procedure
The test route was approximately 95-km long, comprising motorway sections outside Wolfsburg in Germany. The speed limit along the test route was varying from 60 km/h to no limit. There were also variable speed limit signs along the test route that could dynamically change the limit due to weather or traffic conditions. It took, on average, 59–64 minutes to complete the drive. The test drives were accomplished during three weeks between November 2016 and January 2017. On each day, two test persons were invited, one in the morning 9:00-12:00 and one after lunch 12:30–15:30. Both test periods were outside rush hours.
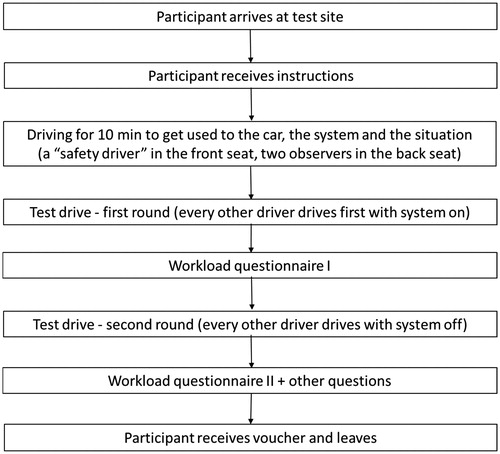
Before driving, the test drivers were informed that the trial concerned the system and not them as drivers, and that all collected data would be anonymous. The drivers were instructed to drive as they normally would. The ‘safety driver’ (personnel from Ingenieurgesellschaft Auto und Verkehr) explained the technical issues of the system, how it was activated and deactivated, and that he, the safety driver, would assume control in case of an unexpected critical situation. The test drivers got no specific instruction that they should take away their hands off the steering wheel or could take their eyes off the road, but after the first activation of the system the safety driver always mentioned that they now could take their hands off and take their feet away from the pedal (this was needed in order not to deactivate the system). Before the observations began, every test person was given time (up to 10 minutes) to drive around and become familiar with the car, the system, and the situation. After the first test drive, the drivers answered a short workload questionnaire. After the second drive, a comprehensive questionnaire was filled out. For the flowchart of the procedure see .
Figure 2. A simple flowchart to illustrate the procedure.
Log-data variables were on a continuous scale; hence, to analyze differences between driving with or without automation for individual drivers, the paired sample t-test was used; whereas for the whole group of test drivers, the sign test was employed. The standardized observation variables (driver performance, use of turning indicators, speed adaptation, lane use, lane change) were analyzed both individually and on an aggregated level. The Wilcoxon (paired) sign rank test was used to analyze differences in questionnaire answers between driving with and without automation. The variables registered by the free observations as well as the answers to the open questions were analyzed through categorization.
Results
Twenty-one test persons drove both times (with and without the system active) through the complete test route. Due to time constraints and technical problems, three participants took both rides on a shorter route, while three others took the first ride on the normal test route but the second ride (one time with the system active, two times without the system) on only the shortened route. During both test drives, the weather and road conditions were mostly similar.
Driving behavior
Complete log-data for both drives (with and without the system) were available for 12 test drivers due to data loss for various technical reasons. Driving speed was averaged for the whole test route for each test person when driving with and without the system. When driving without the system, the mean driving speed of the 12 individual test drivers was between 93.8 and 124.9 km/h, while it was between 97.2 and 115.6 km/h when driving with the system active (see ). With the system active, the mean speed was lower for seven test drivers and higher for five test drivers compared to when they drove without the system, implying no statistically significant difference according to the sign test (p < 0.05). The standard deviation of the mean driving speeds when driving without the system was between 17.9 and 35.3 km/h, while it was between 18.6 and 32.7 km/h with the system active. The standard deviation was lower for 10 test drivers and higher for two test drivers compared to driving without the system, implying a statistically significant difference according to the sign test (p < 0.05). These findings indicate unchanged mean driving speeds but less variation in them when driving with the system active. The maximum speed when driving with the system active was lower for 10 test drivers and higher for two test drivers compared to driving without the system, implying a statistically significant difference according to the sign test (p < 0.05). Maximum speeds when driving without the system were between 126.7 and 178.7 km/h, while they were between 126.6 and 151.2 km/h when driving with the system active.
Table 3. Mean speed, its standard deviation and maximum speed when driving with and without the system.
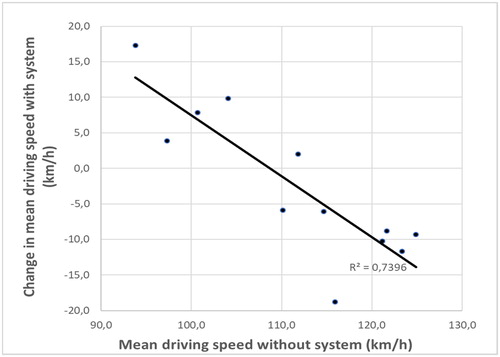
Relating the mean driving speed when driving without the system to the change in mean driving speed when driving with the system active, a high correlation between them can be seen (see ): The higher the mean driving speed when driving without the system, the larger the decrease in mean speed; but also, the lower the mean driving speed when driving without the system, the larger the increase in mean speed when driving with the system active.
Figure 3. Relationship between mean driving speed when driving without the system and the change in mean driving speed when driving with the system active.
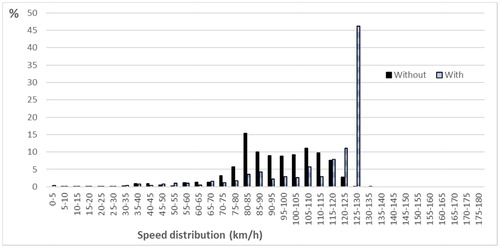
To illustrate the system’s effect on speeds, shows the distribution of speed when driving with and without the system for a test driver who drove at speeds up to 175 km/h without the system and who attained the highest speed of 130 km/h with the system (i.e., the system’s functional limit). An opposite example is shown in , with speed distributions of a test driver whose highest speed was 125 km/h when driving without the system, but who, when driving with the system active, attained speeds between 125–130 km/h.
Figure 4. Speed distribution when driving with and without the system active. An example: one test driver who drove at speeds up to 175 km/h without the system.
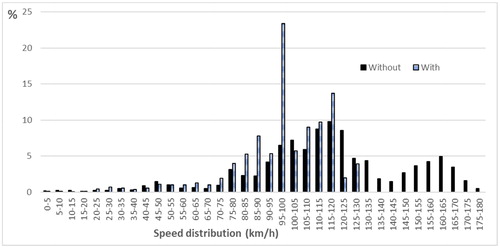
Figure 5. Speed distribution when driving with and without the system active. An example: one test driver whose highest speed was 125 km/h when driving without the system.
The observers in the car registered fewer situations where inappropriate speeds were attained during rides with the system active (see ). The system always accelerated smoothly and chose a speed according to the speed limit and traffic conditions. Without the system, the test persons drove at uneven speeds, sometimes far below the limit, other times faster than the limit.
Table 4. The number of events registered by the coding observer in the car.
In car-following situations, the mean distance to the vehicle ahead when driving without the system was between 35.3 and 41.4 meters, while it was between 36.4 and 41.4 meters when driving with the system active. The mean distance increased for five drivers and decreased for four drivers; hence, no statistically significant differences according to the sign test (p < 0.05) were demonstrated. The observers in the car registered distances too close to the vehicle ahead almost 7 times more often on rides without the system compared to driving with the system active (see ).
Based on logged data, lane-keeping behavior can be described by lateral acceleration. The mean lateral acceleration decreased for eight drivers and increased for four drivers (see ); hence, no statistically significant differences according to the sign test (p < 0.05) were demonstrated. The maximum lateral acceleration decreased for seven drivers and increased for five drivers; hence, no statistically significant differences according to the sign test (p < 0.05) were found. The observers in the car registered a similar number of events regarding lane-keeping behavior on both rides (see ).
Table 5. Mean lateral acceleration, its standard deviation, and maximum lateral acceleration when driving with and without the system.
In total, fewer situations involving problems with lane changes were observed on rides with the system active (see ). Dangerous or hesitant lane changes (8 cases) were only noticed on rides without the system. Regarding lane choice, only on rides without the system was it noticed that the test persons drove for a long period in the middle lane or in the third (inner) lane, even when the right lane was empty (neglecting the prescribed use of the right lane).
Situations in which the turning indicator was not used correctly were observed three times more often on rides without the system (see ). This includes, especially, situations in which the indicator was used too late (e.g., a situation in which the test person already started to make a lane change before indicating).
Conflict situations – situations in which the test person’s car was on a collision course with another vehicle and, at the last moment, the driver, the safety driver or the driver of another vehicle took evasive action – were observed during both rides. However, while on rides without the system, 3 conflict situations were caused by the test driver, 32 conflict situations occurred on rides with the system active (see ). Most of those conflicts involved lane changes in which the system did not recognize the indicator or lane-change behavior of the other vehicle. In three situations, the system lost road marking due to sunlight reflection and drove too far to the left. In four conflict situations, the test car attempted to make a lane change while other vehicles were in that lane; in four others, the system did not recognize the vehicle ahead and nearly caused a rear-end collision.
Comments by the test drivers during driving
After using the system for some time, the participants became more positive about it, stating that they liked it and that it would be advantageous in traffic jams or on longer rides; moreover, they felt it was easy to activate and that it used the right lane as often as possible. Some participants commented that they did not know what to do with their hands or with the ‘earned’ time; others mentioned having to build up trust (and that it was difficult to do so) and that it was good that the safety driver was sitting next to them. Some participants felt scared in some critical situations, stressing how they had to look around at all times.
In some cases, the participants felt they had to apologize (with hand gestures) to other drivers for the behavior of the system (not letting other drivers enter the lane). They also believed they were hindering others, and that others were likely wondering about their driving behavior.
There were other criticisms, as one still had to concentrate (even more – both on the traffic and the system) to check traffic signs and ensure the system was working correctly. One test driver mentioned that the driver was ultimately still responsible, and thus he continued to be careful.
Questionnaire answers
Workload
Subjective workload was in general not affected by the use of the system. The test drivers only assessed their performance to decrease statistically significantly (p < 0.05) when driving with the system active (see ).
Table 6. The rates of subjective workload items and results from the Wilcoxon (paired) signed rank test between driving with and without the system.
Trust
Most participants had trust in the system. Over one-half agreed or strongly agreed that the system was a competent performer, that they could trust it, that they had confidence in its advice, and that it behaved in a consistent manner. Slightly less than one-half of the test persons agreed or strongly agreed that they could depend on the system and rely on it to do its best every time. Only one participant strongly disagreed with the statements. See for details.
Table 7. Number of answers for each statement about test drivers’ trust in the system.
Usefulness and satisfaction
The system was perceived as useful (‘useful’, ‘good’, ‘effective’, ‘assisting’, but not ‘raising alertness’) and satisfactory (‘pleasant’, ‘nice’, ‘desirable’ and ‘likable’) (see ).
Figure 6. Mean ratings of individual items constituting the system’s usefulness and satisfactoriness.
Driving experiences
The test persons were asked to indicate whether they experienced any changes in a number of matters when driving with the system. They had to assess these issue on a continuous scale from “Decreased greatly” (−50) to “Increased greatly” (+50). Their answers reveal that they did not experience any significant changes when driving with the system in any of the mentioned aspects, see .
Figure 7. Mean ratings of all participants’ answers regarding their experienced effects of the system.
Expected benefits or disadvantages
The participants were asked whether or not they thought the system would give them any advantages or disadvantages in their daily driving. They were asked to put a mark on a continuous scale from “Very large disadvantage” (−50) to “Very large benefit” (+50). The main advantages according to the test drivers would be a lower risk of getting fines, enhanced comfort and better image, see . The test drivers estimated only small changes with regard to risk to be involved in an accident and fuel consumption, and they assessed hardly any changes in travel time or enjoyment when driving.
Figure 8. Mean ratings of all participants’ answers regarding expected benefits/disadvantages of the system in various aspects.
Hmi issues
The participants were asked to rate how intuitive the buttons for activation and deactivation of the system were on a continuous scale from −50 to +50. The answers revealed that they felt intuitive for the activation of the system but less intuitive for deactivation, see .
Table 8. Test drivers’ rating of buttons for activation and deactivation (-50 = Very non-intuitive/+50= Very intuitive).
The participants were of the opinion that the information displayed in the “instrument cluster” was useful, comprehensible and not distractive, see . The information given on the “central status indicator” was assessed less supportive compared to the information given in the “Instrument cluster”.
Table 9. Test drivers’ rating of the information displayed in the instrument cluster and in the central status indicator.
According to the test drivers, the most important information from the system was information about the status of the system - if it was active or not (9 comments), and the information on when the driver had to take over (9 comments). Also information about the system’s next planned maneuver (8 comments), an overview of the maneuvers (8 comments), and possible explanation why the system was reacting in a certain way (8 comments) were judged to be important. Furthermore, seven test persons thought that it was important to know when the system could be activated. Almost all test persons (24 persons) were of the opinion that the best place to display important information was the instrument cluster. As an alternative place, the head-up display was cited (7 persons). As the best channel for information about maneuvers was considered speech, see .
Table 10. Test drivers’ rating of channel for information about maneuvers (-50 = Not important at all/+50 = Very important).
Other experiences
Answering the open questions, some participants mentioned problems while overtaking other vehicles, as it took too long to accelerate and complete the overtaking process, thereby hindering the movement of other cars. It was also mentioned that the system behaved recklessly, as it did not allow other drivers to merge onto the motorway. These events could make the driver troubled due to feeling of guilt for something they could not do anything about.
Discussion
Regarding the research questions about driver behavior and performance, the following findings are of interest:
The drivers used the system as it was intended to be used – no situations were observed in which the system was used in a way other than intended.
The system was used in almost all situations when it offered to drive automatically. Nevertheless, some situations were observed in which the driver assumed control from the system due to impatience (e.g., long overtaking process) or a critical incident.
The drivers retained the system settings suggested by the system – in other words, they did not interfere with the system settings. Only in situations in which the system did not recognize speed limit changes (variable overhead signs) did drivers manually adjust the speed limit.
The test persons drove too fast given the situation significantly more often when driving without the system. This finding is in line with those of earlier field trials with ADAS systems providing speed support (Adell et al., Citation2008; Adell et al., Citation2011; Várhelyi et al., Citation2015). The system always accelerated smoothly, while some test persons maintained uneven speed behavior on rides without the system. The system maintained the correct distance to the vehicle ahead; in contrast, distance-keeping errors were registered on rides without the system. This result is also in line with those of an earlier field trial with an in-car speed limiter (Várhelyi & Mäkinen, Citation2001) a speed limit support system (active accelerator pedal) (Hjälmdahl & Várhelyi, Citation2004a) and a safe distance-keeping support system (Adell et al., Citation2011). Less indicator errors were made on rides with the system active, since the system handled this task automatically. The system also helped avoid dangerous lane changes. Since the system drove as much as possible in the right lane, it had a clear advantage with regard to the prescribed use of the right lane. No differences were observed with regard to lane-keeping behavior. This result is in line with those of an earlier field trial with an ADAS system providing distance keeping and speed support (Adell et al., Citation2011). The system did not react to other drivers attempting to make a lane change, especially in situations where merging onto motorways was occurring. In these situations, the test persons reacted better by manually reducing speed or changing lane. This finding agrees with those of Adell et al. (Citation2011), who examined the effects of system warnings of unsafe speeds or unsafe distances to the vehicle ahead and demonstrated that drivers showed worse facilitating behavior toward other drivers with the system active. Due to the system’s 130 km/h speed limit, the overtaking process required more time, leading to aborted maneuvers. In some cases, trailing cars were hindered, consequently honking, and the test person had to assume control from the system to accelerate and complete the overtaking process.
Regarding the research questions about the effects of automation on the driving task, the following was found:
Some of the test persons believed it was more comfortable and less stressful to drive with the system, while others held that the opposite was true. The main reason for this discrepancy was that some of the participants did not (fully) trust the system and needed more time to do so. Therefore, these participants felt they needed to observe more functions (both traffic and system functions) on rides with the system active; otherwise, they felt they had to be ready to assume control at any time, and experienced greater stress as a result. Subjective workload was in general not affected by use of the system. Only one’s own driving performance was assessed to decrease statistically significantly (p < 0.05) when driving with the system active. This finding is in line with earlier findings on workload when driving with ADAS (see e.g. Adell et al., Citation2008; Adell et al., Citation2011; Várhelyi et al., Citation2015), where drivers felt their driving was ‘supervised’ and they could not ‘perform’ as they would have without driving support.
Concerning drivers’ engagement in secondary tasks when driving with automation, no differences between the two rides were found. The test persons talked with the safety driver on both rides, turning their heads toward him. Some test persons commented on having more time to, e.g., enjoy the view, whereas others were unclear about what to do with their ‘earned’ time.
Regarding the research questions concerning regaining control, the following was found:
The test persons did detect system failures. However, in some cases, they did not have any reaction (e.g., sudden braking behind a truck wrongly recognized by the system as being an obstacle) and the safety driver assumed control by braking or steering.
Concerning drivers’ decision making during a safety-critical event, the test persons on both rides reacted well in conflict situations and took evasive actions on their own. Nevertheless, some conflict situations were resolved only by intervention by the safety driver.
Regarding the research questions concerning drivers’ trust and acceptance, the following was found:
Most participants exhibited trust in the system. Nevertheless, the answers to the open questions also demonstrated that trust had to be built first; otherwise, using the system was more stressful. Considering that the test persons were using the system for the first time and that problems with the system were encountered on nearly every ride (conflicts or critical situations), the test persons were observed to continuously check the system functions, checking whether lane changes were appropriate and speed limits were maintained. Some participants began to trust the system after some time, while others did not fully trust the system during the whole ride.
The system was perceived as being both useful and satisfactory. In comparison, earlier studies of ADASs found them to be useful but their satisfactoriness was determined to not be statistically significantly different from zero – see e.g. Hjälmdahl and Várhelyi (Citation2004a), who assessed a haptic speed limit support system; Adell et al. (Citation2008), who assessed auditory and haptic systems for speed support; Adell et al. (Citation2011), who assessed a system warning of unsafe speed or unsafe distance to the vehicle ahead; and Várhelyi et al. (Citation2015), who assessed a system providing safe speed and distance support.
As a limitation of the study, it could be argued that log-data from only 12 persons is insufficient, but these data were only used to analyze driving speed, distance keeping and lane keeping. These, and other variables were also observed by the human observers in the car, and data from the observers were available for 21 test drivers driving both with and without automation. Moreover, the results from both data collection sources are aligned.
Conclusions
The system affected driving positively in several ways: It accelerated more smoothly and chose a speed in accordance with the speed limit and traffic conditions. It made fewer dangerous lane changes, kept the correct distance from other vehicles, and maintained the prescribed use of the right lane. No differences were observed with regard to lane-keeping behavior or subjective workload. The effects of the system on the observed variables are illustrated in . However, the system did not react when other drivers were attempting to make a lane change, especially when involving a merger onto the motorway. The overtaking process occasionally took a long time, leading to aborted maneuvers. Conflicts and sudden braking were observed more often on rides with the system active.
Table 11. The effects of the system on the observed variables.
The system was perceived as both useful and satisfactory. Driving comfort was assessed to increase. Some test persons stated that it was more comfortable and less stressful to drive with the system, while others expressed feeling more stressed and having to observe even more functions (both traffic and system functions) to be prepared to assume control at any time.
The phenomenon of “feeling guilty” arose when the system behaved recklessly and it did not allow other drivers to merge onto the motorway or hindered other cars behind due to lengthy overtaking.
Further research and development needs for improving automated driving on motorways include improvements in sensor functions to make them more robust, greater sensing of the alignment with the driving lane in adverse environmental conditions, and better recognition of other vehicles’ intention to enter the system vehicle’s lane.
Recommendations with respect to future user-related assessments of automated driving functions include:
The system to be assessed in user-related tests should be flawless.
The final test should be in a real-life setting where naïve drivers can drive on public roads, but should also occur in an advanced driving simulator to allow staged situations wherein situation awareness and potential complacency can be studied.
Since this field trial only looked at short-term effects on driver behavior, and any possible behavioral adaptations would likely only appear after a familiarization period (Draskóczy, Citation1994), longer-term studies are needed to monitor such effects.
Acknowledgments
This paper was built on research financed by the European Commission and Seventh Framework Programme. Special thanks to Jens Lauer, Markus Robert and Nina Schulz for their valuable assistance during the data collection.
References
- Adell, E., Várhelyi, A., & Hjälmdahl, M. (2008). Auditory and haptic systems for in-car speed management – a comparative real life study. Transportation Research Part F: Traffic Psychology and Behaviour, 11(6), 445–458. doi:https://doi.org/10.1016/j.trf.2008.04.003
- Adell, E., Várhelyi, A., Dalla Fontana, M., & D’alessandro, M. (2011). The effects of a driver assistance system for safe speed and safe distance – a real life field study. Transportation Research Part C: Emerging Technologies, 19(1), 145–155. doi:https://doi.org/10.1016/j.trc.2010.04.006
- Adell, E., Várhelyi, A., & Nilsson, L. (2014a). The Definition of Acceptance and Acceptability. In M.A., Regan, T., Horberry,A., Stevens, (Eds.), Driver Acceptance of new technology. Theory, Measurement and optimisation (pp. 11–22). Ashgate.
- Adell, E., Nilsson, L., & Várhelyi, A. (2014b). How is acceptance measured? Overview of measurement issues, methods and tools. In M. A. Regan, T. Horberry, & A. Stevens, (Eds.), Driver acceptance of new technology. Theory, measurement and optimisation (pp. 73–89). Ashgate.
- Agrawal, R., Wright, T. J., Samuel, S., Zilberstein, S., & Fisher, D. L. (2017). Effects of a change in environment on the minimum time to situation awareness in transfer of control scenarios. Transportation Research Record: Journal of the Transportation Research Board, 2663(1), 126–133. doi:https://doi.org/10.3141/2663-16
- Banks, V. A., Stanton, N. A., & Harvey, C. (2014). Sub-systems on the road to vehicle automation: Hands and feet free but not mind free driving. Safety Science, 62, 505–514. doi:https://doi.org/10.1016/j.ssci.2013.10.014
- Beggiato, M., Pereira, M., Petzoldt, T., & Krems, J. (2015). Learning and development of trust, acceptance and the mental model of ACC. A longitudinal on-road study. Transportation Research Part F: Traffic Psychology and Behaviour, 35, 75–84.
- Bellem, H., Schönenberg, T., Krems, J.F., & Schrauf, M. (2016). Objective metrics of comfort: developing a driving style for highly automated vehicles. Transportation Research Part F: Traffic Psychology and Behaviour, 41, 45–54.
- Beller, J., Heesen, M., & Vollrath, M. (2013). Improving the driver–automation interaction: An approach using automation uncertainty. Human factors: The Journal of the Human Factors and Ergonomics Society, 55(6), 1130–1141. doi:https://doi.org/10.1177/0018720813482327
- Berthelon, C., & Gineyt, G. (2014). Effects of alcohol on automated and controlled driving performances. Psychopharmacology, 231(10), 2087–2095. doi:https://doi.org/10.1007/s00213-013-3352-x
- Brackstone, M., & Mcdonald, M. (2000). Behavioural response: Still a major concern for AVCSS? Its Journal – Intelligent Transportation Systems Journal, 5(4), 363–382. doi:https://doi.org/10.1080/10248070008903776
- Blommer, M., Curry, R., Swaminathan, R., Tijerina, L., Talamonti, W., & Kochhar, D. (2017). Driver brake vs. steer response to sudden forward collision scenario in manual and automated driving modes. Transportation Research Part F: Traffic Psychology and Behaviour, 45, 93–101. doi:https://doi.org/10.1016/j.trf.2016.11.006
- Brown, I. D. (1997). Prospects for technological countermeasures against driver fatigue. Accident Analysis & Prevention, 1997 29(4), 525–531. doi:https://doi.org/10.1016/S0001-4575(97)00032-8
- Buckley, L., Kaye, S. A., & Pradhan, A. K. (2018). Psychosocial factors associated with intended use of automated vehicles: A simulated driving study. Accident Analysis and Prevention, 115, 202–208. doi:https://doi.org/10.1016/j.aap.2018.03.021
- Bueno, M., Dogan, E., HadjSelem, F., Monacelli, E., Boverie, S., & Guillaume, A. (2016)., 2016). How different mental workload levels affect the take-over control after automated driving [Paper presentation]. 2016 IEEE 19th International Conference on Intelligent Transportation Systems (ITSC), Rio de Janeiro. pp. 2040–2045. doi:https://doi.org/10.1109/ITSC.2016.7795886
- Byers, J. C., Bittner Jr, A. C., & Hill, S. G. (1989). Traditional and raw task load index (TLX) correlations: Are paired comparisons necessary? Advances in Industrial Ergonomics and Safety, Taylor and Francis.
- Carsten, O., Lai, F. C. H., Barnard, Y., Jamson, A. H., & Merat, N. (2012). Control task substitution in semi-automated driving: Does it matter what aspects are automated? Human Factors: The Journal of the Human Factors and Ergonomics Society, 2012 54(5), 747–761. doi:https://doi.org/10.1177/0018720812460246
- Clark, H., & Jing Feng, J. (2017). Age differences in the takeover of vehicle control and engagement in non-driving-related activities in simulated driving with conditional automation. Accident Analysis & Prevention, 106, 468–479. doi:https://doi.org/10.1016/j.aap.2016.08.027
- Cummings, M. L., Mastracchio, C., Thornburg, K. M., & Mkrtchyan, A. (2013). Boredom and distraction in multiple unmanned vehicle supervisory control. Interacting with Computers, 25(1), 34–47. doi:https://doi.org/10.1093/iwc/iws011
- de Winter, J. C. F., Happee, R., Martens, M. H., & Stanton, N. A. (2014). Effects of adaptive cruise control and highly automated driving on workload and situation awareness: A review of the empirical evidence. Transportation Research Part F: Traffic Psychology and Behaviour, V27P, 196–217. doi:https://doi.org/10.1016/j.trf.2014.06.016
- Domeinski, J., Wagner, R., Schoebel, M., & Manzey, D. (2007). Human redundancy in automation monitoring: Effects of social loafing and social compensation [Paper presentation]. Proceedings of the Human Factors and Ergonomics Society 51st Annual Meeting, Santa Monica, CA. In (pp. 587–591) Human Factors and Ergonomics Society. doi:https://doi.org/10.1177/154193120705101004
- Draskóczy, M. (1994). Guidelines on safety evaluation. DRIVE Project V2002, HOPES. Bulletin 118. Department of Traffic Planning and Engineering, Lund University.
- Endlsey, M. R. (1995). Toward a theory of situation awareness in dynamic-systems. Human Factors, 37 (1), 32–64.
- Endsley, M. R., & Kiris, E. O. (1995). The out-of–the-loop performance problem and level of control in automation. Human Factors: The Journal of the Human Factors and Ergonomics Society, 37(2), 381–394. doi:https://doi.org/10.1518/001872095779064555
- Eriksson, A., Banks, V. A., & Stanton, N. A. (2017). Transition to manual: Comparing simulator with on-road control transitions. Accident Analysis & Prevention, 102, 227–234. doi:https://doi.org/10.1016/j.aap.2017.03.011
- Farmer, R., & Sundberg, N. D. (1986). Boredom proneness - the development and correlates of a new scale. Journal of Personality Assessment, 50(1), 4–17. doi:https://doi.org/10.1207/s15327752jpa5001_2
- Forster, Y., Naujoks, F., Neukum, A., & Huestegge, L. (2017). Driver compliance to take-over requests with different auditory outputs in conditional automation. Accident Analysis and Prevention, 109, 18–28. doi:https://doi.org/10.1016/j.aap.2017.09.019
- Funke, G., Matthews, G., Warm, J. S., & Emo, A. K. (2007). Vehicle automation: A remedy for driver stress? Ergonomics, 50(8), 1302–1323. doi:https://doi.org/10.1080/00140130701318830
- Gold, C., Berisha, I., & Bengler, K. (2015). Utilization of drivetime - Performing non-driving related tasks while driving highly automated. Proceedings of the Human Factors and Ergonomics Society Annual Meeting, 59 (1), 1666–1670. doi:https://doi.org/10.1177/1541931215591360
- Gold, C., Happee, R., & Bengler, K. (2018). Modeling take-over performance in level 3 conditionally automated vehicles. Accident Analysis & Prevention, 116, 3–13. doi:https://doi.org/10.1016/j.aap.2017.11.009
- Gouy, M., Wiedemann, K., Stevens, A., Brunett, G., & Reed, N. (2014). Driving next to automated vehicle platoons: How do short time headways influence non-platoon drivers’ longitudinal control? Transportation Research Part F: Traffic Psychology and Behaviour, 27(Part B), 264–273. doi:https://doi.org/10.1016/j.trf.2014.03.003
- Halpert, R., Hill, R. (2015). Measures of locus of control. Retrieved from December 10, 2011. http://teachinternalcontrol.com/uploads/LOC_Measures__1_.pdf.
- Harvey, C., Stanton, N. A., Pickering, C. A., McDonald, M., & Zheng, P. (2011). A usability evaluation toolkit for in-vehicle information systems (IVISs). Applied Ergonomics, 42(4), 563–574. doi:https://doi.org/10.1016/j.apergo.2010.09.013
- Heikoop, D. D., de Winter, J. C. F., van Arem, B., & Stanton, N. A. (2018). Effects of mental demands on situation awareness during platooning: A driving simulator study. Transportation Research Part F: Traffic Psychology and Behaviour, 58, 193–209. doi:https://doi.org/10.1016/j.trf.2018.04.015
- Hjälmdahl, M., & Várhelyi, A. (2004a). Speed regulation by in-car active accelerator pedal – effects on driver. Transportation Research Part F: Traffic Psychology and Behaviour, 7(2), 77–94. doi:https://doi.org/10.1016/j.trf.2004.02.002
- Hjälmdahl, M., & Várhelyi, A. (2004b). Validation of in-car observations: A method for driver assessment. Transportation Research Part A: Policy and Practice, 38(2), 127–142. doi:https://doi.org/10.1016/j.tra.2003.09.001
- Jenness, J. W., Lerner, N. D., Mazor, S., Osberg, J. S., & Tefft, B. C. (2008). Use of advanced in-vehicle technology by young and older early adopters: Selected results from five technology surveys. (report No. HS 811 004). US Department of Transportations, National Highway Traffic Safety Administration.
- Karjanto, J., Yusof, N. M., Wang, C., Terken, J., Delbressine, F., & Rauterberg, M. (2018). The effect of peripheral visual feedforward system in enhancingsituation awareness and mitigating motion sickness in fullyautomated driving. Transportation Research Part F: Traffic Psychology and Behaviour, 58 (2018), 678–692. doi:https://doi.org/10.1016/j.trf.2018.06.046
- Kaufmann, C., & Risser, R. (2012). A report on the impact of IVT use on drivers’ behaviour and individual differences. Interaction FP7 Project, Deliverable 6.
- Laureshyn, A., & Várhelyi, A. (2018). The Swedish Traffic Conflicts Technique: observer’s manual. Transport & Roads, Department of Technology & Society, Faculty of Engineering, Lund University.
- Kauffmann, N., Winkler, F., Naujoks, F., & Vollrath, M. (2018). What Makes a Cooperative Driver?” Identifying parameters of implicit and explicit forms of communication in a lane change scenario. Transportation Research Part F: Traffic Psychology and Behaviour, 58, 1031–1042. doi:https://doi.org/10.1016/j.trf.2018.07.019
- Kyriakidis, M., de Winter, J. C. F., Stanton, N., Bellet, T., van Arem, B., Brookhuis, K., Martens, M. H., Bengler, K., Andersson, J., Merat, N., Reed, N., Flament, M., Hagenzieker, M., & Happee, R. (2019). A human factors perspective on automated driving. Theoretical Issues in Ergonomics Science, 20(3), 223–249. doi:https://doi.org/10.1080/1463922X.2017.1293187
- Large, D. R., Burnett, G., Morris, A., Muthumani, A., & Matthias, R. (2018). A longitudinal simulator study to explore drivers’ behaviour during highly-automated driving [Paper presentation].International Conference on Applied Human Factors and Ergonomics AHFE 2017: Advances in Intelligent Systems and Computing, pp 583–594. https://doi.org/10.1007/978-3-319-60441-1_57
- Louw, T., & Merat, N. (2017). Are you in the loop? Using gaze dispersion to understand driver visual attention during vehicle automation. Transportation Research Part C: Emerging Technologies, 76, 35–50. doi:https://doi.org/10.1016/j.trc.2017.01.001
- Louw, T., Markkula, G., Boer, E., Madigan, R., Carsten, O., & Merat, N. (2017). Coming back into the loop: Drivers’ perceptual-motor performance in critical events after automated driving. Accident Analysis & Prevention, 108, 9–18. doi:https://doi.org/10.1016/j.aap.2017.08.011
- Matthews, G., & Desmond, P. A. (1998). Personality and multiple dimensions of task-induced fatigue: a study of simulated driving. Personality and Individual Differences, 25(3), 443–458. doi:https://doi.org/10.1016/S0191-8869(98)00045-2
- Matthews, G., & Desmond, P. A. (2002). Task-induced fatigue states and simulated driving performance. The Quarterly Journal of Experimental Psychology Section A, 55(2), 659–686. doi:https://doi.org/10.1080/02724980143000505
- Maycock, G. (1995). Driver sleepiness as a factor in car and HGV accidents. TRL Report, No. 169.
- McBride, S. E., Rogers, W. A., & Fisk, A. D. (2010). Do younger and older adults differentially depend on an automated system? [Paper presentation]. Paper Presented at the Human Factors and Ergonomics Society 54th Annual Meeting, San Francisco, CA.
- McDonald, A. S., & Davey, G. C. L. (1996). Psychiatric disorders and accidental injury. Clinical Psychology Review, 16(2), 105–127. doi:https://doi.org/10.1016/0272-7358(96)00007-4
- Merat, N., & Lee, J. D. (2012). Preface to the special section on human factors and automation in vehicles: designing highly automated vehicles with the driver in mind. HUMAN Factors: The Journal of the Human Factors and Ergonomics Society, 54(5), 681–686. doi:https://doi.org/10.1177/0018720812461374
- Merat, N., Hamish Jamson, A., Frank, C., Lai, H., & Carsten, O. (2012). Highly automated driving, secondary task performance, and driver state. HUMAN Factors: The Journal of the Human Factors and Ergonomics Society, 54(5), 762–771. doi:https://doi.org/10.1177/0018720812442087
- Merat, N., Hamish Jamson, A., Lai, F. C. H., Daly, M., & Carsten, O. M. J. (2014). Transition to manual: Driver behaviour when resuming control from a highly automated vehicle. Transportation Research Part F: Traffic Psychology and Behaviour, V27, 274–282. doi:https://doi.org/10.1016/j.trf.2014.09.005
- Merat, N., Jamson, A. H., Lai, F., & Carsten, O. (2014b). Human factors of highly automated driving: results from the EASY and citymobil projects. In G. Meyer & S. Beiker (Eds.), Road Vehicle Automation. Lecture Notes in Mobility. Springer.
- Merritt, S. (2011). Affective process in human-automation interactions. Human Factors: The Journal of the Human Factors and Ergonomics Society, 53(4), 356–370.
- Merritt, S. M., Heimbaugh, H., LaChapell, J., & Lee, D. (2012). I trust it, but I don’t know why: Effects of implicit attitudes toward automation on trust in an automated system. Human Factors: The Journal of the Human Factors and Ergonomics Society,, doi:https://doi.org/10.1177/0018720812465081
- Miller, D., Sun, A., Johns, M., Ive, H., Sirkin, D., Aich, S., & Ju, W. (2015). Distraction becomes engagement in automated driving. Proceedings of the Human Factors and Ergonomics Society Annual Meeting, 59(1), 1676–1680. doi:https://doi.org/10.1177/1541931215591362
- Mok, B., Johns, M., Lee, K. J., Miller, D., Sirkin, D., Ive, P., & Ju, W. (2015). Emergency, automation off: Unstructured transition timing fordistracted drivers of automated vehicles [Paper presentation]. Intelligent TransportationSystems (ITSC), 2015 IEEE 18th International Conference on. IEEE, in, 2015, pp. 2458–2464. doi:https://doi.org/10.1109/ITSC.2015.396
- Molnar, L. J., Ryan, L. H., Pradhan, A. K., David, W., Eby, D. W., St. Louis, R. M., & Zakrajseka, J. S. (2018). Understanding trust and acceptance of automated vehicles: An exploratory simulator study of transfer of control between automated and manual driving. TRANSPORTATION RESEARCH PART F: Traffic Psychology and Behaviour, 58, 319–328. doi:https://doi.org/10.1016/j.trf.2018.06.004
- Mosier, K. L., & Skitka, L. J. (1996). Human decision-makers and automated decision aids: Made for each other? In R. Parasuraman & M. Mouloua (Eds.), Automation and human performance: Theory and application (pp. 201–220). Lawrence Erlbaum Associates.
- Muhrer, E., Reinprecht, K., & Vollrath, M. (2012). Driving with a partially autonomous forward collision warning system: How do drivers react? HUMAN Factors: The Journal of the Human Factors and Ergonomics Society, 54(5), 698–708. doi:https://doi.org/10.1177/0018720812439712
- Murase, T., Oiwa, K., & Nozawa, A. (2018). Quantitative evaluation of attention to the driving environment during automated driving at levels 3 using ERP: Evaluation of psychophysiological state of driver. IEEJ Transactions on Electronics, Information and Systems, 138 (9), 1148–1153. doi:https://doi.org/10.1541/ieejeiss.138.1148
- Navarro, J., François, M., & Mars, F. (2016). Obstacle avoidance under automated steering: Impact on driving and gaze behaviours. Transportation Research Part F: Traffic Psychology and Behaviour, 43, 315–324. doi:https://doi.org/10.1016/j.trf.2016.09.007
- Naujoks, F., Purucker, C., Neukum, A., Wolter, S., & Steiger, R. (2015). Controllability of partially automated driving functions - does it matter whether drivers are allowed to take their hands off the steering wheel? Transportation Research Part F: Traffic Psychology and Behaviour, 35, 185–198. doi:https://doi.org/10.1016/j.trf.2015.10.022
- Naujoks, F., Purucker, C., & Neukum, A. (2016). Secondary task engagement and vehicle automation – Comparing the effects of different automation levels in an on-road experiment. Transportation Research Part F: Traffic Psychology and Behaviour, 36, 67–82. doi:https://doi.org/10.1016/j.trf.2016.01.011
- Naujoks, F., Purucker, C., Wiedemann, K., Neukum, A., Wolter, S., & Steiger, R. (2017). Driving performance at lateral system limits during partially automated driving. Accident Analysis & Prevention, 108, 147–162. doi:https://doi.org/10.1016/j.aap.2017.08.027
- Naujoks, F., Forster, Y., Wiedemann, K., & Neukum, A. (2017). Improving usefulness of automated driving by lowering primary task interference through HMI design. Journal of Advanced Transportation, 2017(3), 1–12. doi:https://doi.org/10.1155/2017/6105087
- Naujoks, F., Höfling, S., Purucker, C., & Zeeb, K. (2018). From partial and high automation to manual driving: Relationship between non-driving related tasks, drowsiness and take-over performance. Accident Analysis & Prevention, 121, 28–42. doi:https://doi.org/10.1016/j.aap.2018.08.018
- Neubauer, C., Matthews, G., Langheim, L., Start, H., & Saxby, D. (2012). Fatigue and Voluntary Utilization of Automation in Simulated Driving. HUMAN Factors: The Journal of the Human Factors and Ergonomics Society, 54(5), 734–746. doi:https://doi.org/10.1177/0018720811423261
- Nilsson, L. (1995). Safety effects of adaptive cruise controls in critical traffic situations. Proceedings of the Second World Congress on Intelligent Transport Systems, Yokohama, Japan, 9–11 Nov., 1995, pp. 1254–1259.
- OECD (1990). Behavioural adaptations to changes in the road transport system. University of Chicago Press.
- Parasuraman, R., & Manzey, D. H. (2010). Complacency and bias in human use of automation: an attentional integration. Human Factors: The Journal of the Human Factors and Ergonomics Society, 2010 52(3), 381–410. doi:https://doi.org/10.1177/0018720810376055
- Parasuraman, R., Molloy, R., & Singh, I. L. (1993). Performance consequences of automation induced complacency. The International Journal of Aviation Psychology, 3(1), 1–23. doi:https://doi.org/10.1207/s15327108ijap0301_1
- Parasuraman, R., & Riley, V. (1997). Humans and automation: Use, misuse, disuse, abuse. Human Factors: The Journal of the Human Factors and Ergonomics Society, 39(2), 230–253. doi:https://doi.org/10.1518/001872097778543886
- Payre, W., Cestac, J., Dang, N.-T., Vienne, F., & Delhomme, P. (2017). Impact of training and in-vehicle task performance on manual control recovery in an automated car. Transportation Research Part F: Traffic Psychology and Behaviour, 46(Part A), 216–227. doi:https://doi.org/10.1016/j.trf.2017.02.001
- Perrow, C. (1984). Normal accidents: living with high-risk technologies. Basic Books.
- Petermeijer, S. M., Cieler, S., & de Winter, J. C. F. (2017). Comparing spatially static and dynamic vibrotactile take-over requests in the driver seat. Accident Analysis & Prevention, 99(Part A), 218–227. doi:https://doi.org/10.1016/j.aap.2016.12.001
- Preece, J., Rogers, Y., & Sharp, H. (2002). Interaction design: beyond human computer interaction. John Wiley & Sons.
- Prinzel, L. J., De Vries, H., Freeman, F. G., & Mikulka, P. (2001). Examination of automation-induced complacency and individual difference variates. NASA/TM-2001-211413.
- Radlmayr, J., Gold, C., Lorenz, L., Farid, M., & Bengler, K. (2014). How traffic situations and non-driving related tasks affect the take-over quality in highly automated driving. Proceedings of the Human Factors and Ergonomics Society Annual Meeting, 58 (1), 2063–2067. doi:https://doi.org/10.1177/1541931214581434
- Radlmayr, J., Weinbeer, V., Löber, C., Farid, M., & Bengler, K. (2018). How automation level and system reliability influence driver performance in a cut-in situation. In N. Stanton (Ed.), Advances in Human Aspects of Transportation. AHFE 2017. Advances in Intelligent Systems and Computing., vol 597. Springer.
- Reimer, B., Mehler, B., & Coughlin, J. F. (2010). An evaluation of driver reactions to new vehicle parking assist technologies developed to reduce driver stress. New England University Transportation Center, Massachusetts Institute of Technology.
- Risser, R., & Brandstatter, C. (1985). Die Wiener Fahrprobe. Freie Beobachtung. Literas Universitatsverlag.
- Rosenfeld, A., Bareket, Z., Goldman, C. V., LeBlanc, D. J., & Tsimhoni, O. (2015). Learning Drivers’ Behavior to Improve Adaptive Cruise Control. Journal of Intelligent Transportation Systems, 19(1), 18–31. doi:https://doi.org/10.1080/15472450.2014.889960
- SAE. (2014). Taxonomy and definitions for terms related to on-road automated motor vehicles, society of automotive engineers. SAE document J3016.
- Saffarian, M., de Winter, J. C., & Happee, R. (2012). Automated driving: human-factors issues and design solutions. In Proceedings of the human factors and ergonomics society annual meeting (Vol. 56, No. 1, pp. 2296–2300). Sage. doi:https://doi.org/10.1177/1071181312561483
- Sawin, D. A., & Scerbo, M. W. (1995). Effects of instruction type and boredom proneness in vigilance: Implications for boredom and workload. Human Factors: The Journal of the Human Factors and Ergonomics Society, 37 (4), 752–765. doi:https://doi.org/10.1518/001872095778995616
- Schopf, D., Lütteken, N., Zhengzhenni, L., Storost, K., Baumann, M., Happee, R., & Bengler, K. J. (2018). Carrot and stick: A game-theoretic approach to motivate cooperative driving through social interaction. Transportation Research Part C: Emerging Technologies, 88, 159–175. doi:https://doi.org/10.1016/j.trc.2018.01.017
- Shen, S., & Neyens, D. M. (2017). Assessing drivers’ response during automated driver support system failures with non-driving tasks. Journal of Safety Research, 61, 149–155. doi:https://doi.org/10.1016/j.jsr.2017.02.009
- Sheridan, T. B. (2002). Humans and Automation: System Design and Research Issues. Wiley.
- Shiff, B., (1983). An experimental study of the human-computer interface in process control. (Unpublished thesis), University of Toronto, Department of Industrial Engineering.
- Singh, I. L., Molloy, R., & Parasuraman, R. (1997). Automation-induced monitoring inefficiency: role of display location. International Journal of Human-Computer Studies, 46, 17–30. doi:https://doi.org/10.1006/ijhc.1996.0081
- Smiley, A. (2000). Behavioural adaptation, safety, and intelligent transportation systems. Transportation Research Record: Journal of the Transportation Research Board, 1724(1), 47–51. 2000 doi:https://doi.org/10.3141/1724-07
- Sportillo, D., Paljic, A., & Ojeda, L. (2018). Get ready for automated driving using virtual reality. Accident Analysis & Prevention, 118, 102–113. doi:https://doi.org/10.1016/j.aap.2018.06.003
- Stanton, N., & Young, M. (1998). Vehicle automation and driving performance. Ergonomics, 41(7), 1014–1028. doi:https://doi.org/10.1080/001401398186568
- Stanton, N. A., Chambers, P. R. G., & Piggott, J. (2001). Situational awareness and safety. Safety Science, 39(3), 189–204.
- Stark, J. M., & Scerbo, M. W. (1998)., October 1998). The effects of complacency potential and boredom proneness on perceived workload and task performance in an automated environment [Paper presentation]. Presented at the Human Factors and Ergonomics Society 42nd Annual Meeting, Chicago. Vol. 42 Issue: 23 pp. 1618–1618.
- Strand, N. (2014). When driving automation fails. Drivers experiences and interactions [PhD thesis]. Chalmers.
- Strand, N., Nilsson, J., Karlsson, I. C. M., & Nilsson, L. (2014). Semi-automated versus highly automated driving in critical situations caused by automation failures. Transportation Research Part F: Traffic Psychology and Behaviour , Volume 27(Part B) November 2014, Pages, 218–228. doi:https://doi.org/10.1016/j.trf.2014.04.005
- Trimble, T. E., Bishop, R., Morgan, J. F., & Blanco, M. (2014). Human factors evaluation of level 2 and level 3 automated driving concepts: Past research, state of automation technology, and emerging system concepts (Report No. DOT HS 812 043). National Highway Traffic Safety Administration.
- Van der Laan, J. D., Heino, A., & de Waard, D. (1997). A simple procedure for the assessment of acceptance of advanced transport telematics. Transportation Research Part C: Emerging Technologies, 5(1), 1–10. doi:https://doi.org/10.1016/S0968-090X(96)00025-3
- Várhelyi, A., Kaufmann, C., & Persson, A. (2015). User-related assessment of a driver assistance system for continuous support – a real-life field study. Transportation Research Part F: Traffic Psychology and Behaviour , 30, 128–144. doi:https://doi.org/10.1016/j.trf.2015.02.008
- Várhelyi, A., & Mäkinen, T. (2001). The effects of in-car speed limiters – Field studies. Transportation Research Part C: Emerging Technologies, 9(3), 191–211. doi:https://doi.org/10.1016/S0968-090X(00)00025-5
- Vlakveld, W., van Nes, N., de Bruin, J., Vissers, L., & van der Kroft, M. (2018). Situation awareness increases when drivers have more time to take over the wheel in a Level 3 automated car: A simulator study. Transportation Research Part F: Traffic Psychology and Behaviour, 58, 917–929. doi:https://doi.org/10.1016/j.trf.2018.07.025
- Vogelpohl, T., Kühn, M., Hummel, T., Gehlert, T., & Vollrath, M. (2018). Transitioning to manual driving requires additional time after automation deactivation. Transportation Research Part F: Traffic Psychology and Behaviour, 55, 464–482. doi:https://doi.org/10.1016/j.trf.2018.03.019
- Vollrath, M., Schleicher, S., & Gelau, C. (2011). The influence of cruise control and adaptive cruise control on driving behaviour – A driving simulator study. Accident Analysis and Prevention, 43(3), 1134–1139. doi:https://doi.org/10.1016/j.aap.2010.12.023
- Wickens, C. D., & Dixon, S. R. (2007). The benefits of imperfect diagnostic automation: a synthesis of the literature. Theoretical Issues in Ergonomics Science, 8(3), 201–212. doi:https://doi.org/10.1080/14639220500370105
- Wiedemann, K., Naujoks, F., Wörle, J., Kenntner-Mabiala, R., Kaussner, Y., & Neukum, A. (2018). Effect of different alcohol levels on take-over performance in conditionally automated driving. Accident Analysis & Prevention, 115, 89–97. doi:https://doi.org/10.1016/j.aap.2018.03.001
- Wiener, E. L. (1981). Complacency: is the term useful for air safety? In Proceedings of the 26th corporate aviation safety seminar (pp. 116–125). Flight Safety Foundation, Inc. https://trove.nla.gov.au/version/39988016
- Wright, T. J., Horrey, W. J., Lesch, M. F., & Rahman, M. M. (2016). Drivers’ trust in an autonomous system: Exploring a covert video-based measure of trust. Proceedings of the Human Factors and Ergonomics Society Annual Meeting, 60(1), 1334–1338. doi:https://doi.org/10.1177/1541931213601308
- Wright, T. J., Samuel, S., Borowsky, A., Zilberstein, S., & Fisher, D. L. (2016b). Experienced drivers are quicker to achieve situation awareness than inexperienced drivers in situations of transfer of control within a level 3 autonomous environment. Proceedings of the Human Factors and Ergonomics Society Annual Meeting, 60(1), 270–273. doi:https://doi.org/10.1177/1541931213601062
- Wright, T. J., Agrawal, R., Samuel, S., Wang, Y., Zilberstein, S., & Fisher, D. L. (2017). Effects of alert cue specificity on situation awareness in transfer of control in level 3 automation. Transportation Research Record: Journal of the Transportation Research Board, 2663(1), 27–33. doi:https://doi.org/10.3141/2663-04
- Zeeb, K., Buchner, A., & Schrauf, M. (2015). What determines the take-over time? An integrated model approach of driver take-over after automated driving. Accident Analysis and Prevention, 78, 212–221. doi:https://doi.org/10.1016/j.aap.2015.02.023
- Zeeb, K., Buchner, A., & Schrauf, M. (2016). Is take-over time all that matters? The impact of visual-cognitive load on driver take-over quality after conditionally automated driving. Accident Analysis & Prevention, 92, 230–239. doi:https://doi.org/10.1016/j.aap.2016.04.002
- Zeeb, K., Härtel, M., Buchner, A., & Schrauf, M. (2017). Why is steering not the same as braking? The impact of non-driving related tasks on lateral and longitudinal driver interventions during conditionally automated driving. Transportation Research Part F: Traffic Psychology and Behaviour, 50, 65–79. doi:https://doi.org/10.1016/j.trf.2017.07.008
- Zhang, L., Chen, P., Chen, F., Ma, X. (2018). Resuming control from conditional automated vehicle: Drivers’ response under different slowing down modes. Transportation Systems in the Connected Era - Proceedings of the 23rd International Conference of Hong Kong Society for Transportation Studies, HKSTS 2018.