
Abstract
The Balanced Scorecard (BSC) is a performance measurement management control tool model that can play a critical role in driving companies to achieve sustainable performance in the healthcare industry. In the previous studies, BSC advocates that the sustainable growth of business relies on a management balance focused on financial and non-financial aspects. This study uses the BSC model to examine the core business strategies, namely the duration of CEO tenure, the spending patterns between marketing and Research & Development (R&D) and human resources capability expressed in employee size in the healthcare industry in China. The research used a sample of 305 public-listed healthcare companies in PRC China with data collected for 2016–2019 from the China Stock Market & Accounting Research Database (CSMARD). The data was analyzed by SmartPLS version 3.3.6. This study has three essential findings. First, R&D investment has a negative quadratic impact on marketing expenses. Second, marketing expenses are a mediator between R&D investment and company performance. The last finding is that CEO tenure has a moderating effect on employee size in the company. These findings add to the literature on mediation studies in leadership and management. This study provides insights into mapping BSC as an international management assessment tool, indicating potential research opportunities and highlighting managerial implications.
Introduction
Is profit a means to an end or an end to itself? Spiller (Citation2000) pointed out that profit is merely the means to an end, not the end itself. The loss of confidence in accounting reporting procedures and the collapse of the world’s financial markets in 2008 are excellent examples of why a single profit motive can no longer be an adequate driver of corporate values. In 1992, Kaplan and Norton introduced the balanced scorecard idea that brings a new perspective to measuring company performance (Kaplan & Norton, Citation2005, Citation2004, Citation1996, Citation1992). They pointed out that long-term financial success must be accomplished through routine non-financial measures. The financial Key Performance Indicators (KPIs) are taken from a financial-accounting language such as sales, cost of goods sold, expenditures, operating results as EBIT, and financial ratios. The non-financial KPIs evaluate customer satisfaction, employee well-being, knowledge transferring system, innovation, motivation, and empowerment (Han, Seok, & Kim, Citation2017). Both sets of KPIs are used to evaluate company performance. The two major KPIs of company size are total assets and employee size (Kožená & Chládek, Citation2012). Total assets are a financial measurement (Juárez, Citation2018) and employee size is a non-financial measure (Cakir, Bezbradica, & Helfert, Citation2019).
The contingency theory posits that management structure and employee size are correlated with the duration of CEO employment, the size of the board of directors, and the executive board gender mix (Arnaboldi, Casu, Kalotychou, & Sarkisyan, Citation2020). By extension, we argue that all KPIs have correlated and mediation relationships. Why study mediation effects? Namazi (Citation2016) pointed out that some business models cannot solve real business problems because they do not deal with the complicated relationship among variables. A mediation analysis links relationships and examines the impacts between the business applications and the business model. Therefore, we argue that investigating the mediation effect of selected KPIs of healthcare companies in the PRC reveals new insights when using the BSC model.
Balanced Scorecard implementation and its limitations
The Balanced Scorecard (BSC), developed by Kaplan and Norton in 1992, is one of the most influential and widely used management tools (Mio, Costantini, & Panfilo, Citation2022; Rigby & Bilodeau, Citation2015). BSC ranked sixth with a usage rate of 38 per cent among large firms in 2015 (Rigby & Bilodeau, Citation2015). The BSC methodology is centered on a holistic view of a Performance Management System (PMS) that aligns with an organization’s strategic direction. BSC aims to clarify an organization’s vision and strategy and translate them into measurable objectives, goals, and targets (Kaplan & Norton, Citation1996). These measurable objectives include the financial focus on past performance and retaining selected (non-financial) measures as drivers of future financial performance. The chosen drivers in BSC define financial goals, customer service improvements, internal processes, and learning or growth. The authors of BSC assert that financial and non-financial measures should be provided to employees at all levels to understand why these drivers have been selected and how to implement them to achieve future performance outcomes (Banker, Chang, & Pizzini, Citation2004).
Despite the popularity of BSC, this tool has some limitations as a performance measurement model. First, performance components consist of efficiency and effectiveness (Ozcan, Citation2008). An organization can probably be efficient in producing the inputs but not effective and vice versa, owing to conflicting goals. For example, profit centers (units) and cost centers (units) have difficulty having balance function goals of a business. In addition, since performance is a process of non-linear, it is a complex management decision to allow how much time for performances to achieve the desired performance level. It is hard to have a balanced view of managing improvement efforts (Meyer, Citation2003). Second, performance reports usually start from the bottom to the top of an organization and then have a reverse cascade process of improvement policy from top to bottom in a hierarchical organization (the structural framework) and the cultural setting (the procedural framework) (Folan & Browne, Citation2005; Marshall, Citation2002). It is a complex consideration of seeking a balance of integration between the nonhierarchical structure, such as MLMs, faith-based organizations and the procedural framework based on the time-orientation view of performance, such as long-term and short-term measurements. Rouse and Putterill (Citation2003) pointed out that genuinely holistic performance measurement has, so far, been unrealizable. In addition, it is a costly performance measure tool to implement for small and medium-sized businesses (Russo & Martins, Citation2005). Due to limited resources, SMEs lack performance management systems (PMS) (Molleman, Citation2007).
Therefore, we should look beyond just recording numbers while using BSC as a performance measurement tool (Gama, Citation2017). This tool can also facilitate leadership vision, maintain business values, enable prudent decision-making, contribute to developing an effective management structure, and implement best practices at all levels. All the above initiatives must be transformed into measurable goals, objectives, and actions for implementation. Of the many possible measures, this performance in sales, cash flow, and total assets is for mediation analysis. Each will now be discussed and justified in turn.
Healthcare industry in PRC
China launched a healthcare reform in 2009 (Yip et al., Citation2019). The PRC government increased its funding for healthcare services from RMB19 billion in 2008 to RMB197 billion in 2018 (Li et al., Citation2020). The healthcare reform system has been supported by expanding state-backed insurance, licensing private for-profit clinics and introducing private health insurance. The operation of healthcare reform is a public-private collaboration (Daemmrich, Citation2013). The state provides most healthcare services while providing medicines, diagnostic tests, surgical implants, and special care treatment shifts to privately owned profit entities.
As a result, healthcare services have improved, such as public health prevention for non-communicable diseases (NCDs) and infectious diseases, primary nursing care, the combined use of Chinese and Western medicines treatments, shortening the waiting time for hospitalization and fee-to-service standard in hospital administration, particularly benefitting to the low economic status population and minority living the rural areas (Jia et al., Citation2020).
However, many management challenges must be solved in China’s healthcare system. Li et al. (Citation2020) pointed out that the performances of healthcare companies, particularly public-listed health-related companies, should adopt KPI indicators for further improvement in China. The relevant KPIs are medical staff training, leadership and management development, medical records management, R&DI for 5 G, and other financial and non-financial incentive mechanisms (Zhang, Wang, Jiang, & Wang, Citation2018).
Since 1994, the BSC model has been widely implemented in healthcare organizations (Zelman, Pink, & Matthias, Citation2003). Many studies supported the importance of using the BSC model for performance (Chan & Ho, Citation2000; Habidin, Khaidir, Shazali, Ali, & Jamaludin, Citation2015; Inamdar, Kaplan, & Reynolds, Citation2002; Kollberg & Elg, Citation2011). Zhijun, Zengbiao, and Zhang (Citation2014) conducted BSC applications in public hospitals and found positive performance results in China. However, little research uses mediation analysis to investigate the connections between financial and non-financial aspects of the BSC model, particularly in PRC healthcare organizations. Research gaps exist for moderating, mediating and non-linear impacts among targeted variables, namely CEO tenure, the expenditures relationships between marketing and R&D and employee size for measuring PRC healthcare performance, as suggested by Preacher, Rucker, and Hayes (Citation2007). We selected these four targeted variables to investigate the BSC model for implementation. The CEO tenure and employee size map as variables of the non-financial side of the BSC model, while the spending patterns of marketing and R&D are grouped for financial aspects of the Model.
Besides the Introduction of this paper as Section “Introduction,” it also consists of Section “Model development and its hypotheses,” a description of model development and its hypotheses; Section “Research methods, findings, and data analysis,” a discussion of the research method, findings and data analysis from the empirical study; Section “Conclusion and discussion,” an explanation of the findings and a discussion of the potential implications of them and Section “Limitations and directions for future research,” a description of limitations and directions for future research.
Model development and its hypotheses
Integrating the gaps in the previous discussion, we present a conceptual model in , comprising five essential variables. On the right-hand side of the Figure are two exogenous variables, company size (EMPN) and tenure (TENR), which affect the three endogenous variables on the left-hand side, forming Hypotheses 1–6. The Model’s causality between variables is indicated by arrows showing the postulated influence direction.
Figure 1. The conceptual model of this study.
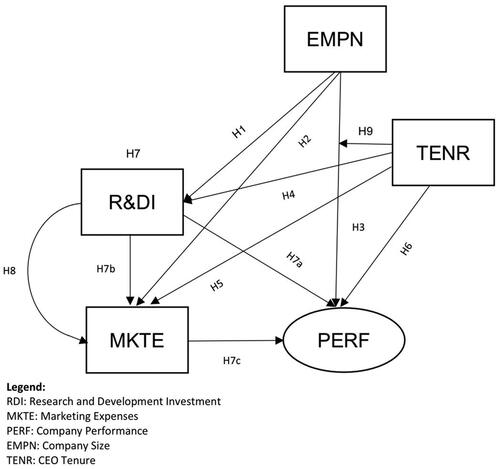
Further, the research development investment (R&DI) has an impact on firm performance (PERF) and marketing expenses (MKTE), while MKTE affects PERF. These three relations lead us to examine the mediation effect of MKTE, that is, Hypothesis 7. Hypothesis 8 postulates a quadratic effect from R&DI to MKTE, while Hypothesis 9 indicates how CEO tenure enhances the impact of company size on company performance
The model hypotheses that will be presented reflect only a small number of potential links that could be made. The empirical study, discussed in the next section, cannot deal with all the variables and possible combinations of relationships in the Model. Therefore, only those relationships which will be formally tested in this article are presented as hypotheses. This specific Model was mainly determined by prior research and by the primary objective of this article. We will first discuss the various components of the Model, starting from the exogenous variables and then their relationships with endogenous variables forming the nine hypotheses in the following sections.
Company size
Does company size matter? Jónsson (Citation2007) found that size affects performance based on agency, strategic, and institutional theories. Agency theory suggests that self-interested managers influence firm size (Zheng, Shen, Zhong, & Lu, Citation2020). Porter’s three generic strategies indicate that cost leadership affects firm size by utilizing economies of scale or scope (Islami, Mustafa, & Topuzovska Latkovikj, Citation2020). Usually, the firm must be larger than its competitors. However, larger firms may be less flexible (Besanko, Dranove, Shanley, & Schaefer, Citation2004). As companies compete for limited resources, the institutional theory posits that larger organizations are better than smaller organizations’ highly competitive institutional environment (Chu, Xu, Lai, & Collins, Citation2018). However, organizational theorists propose seeking the optimal size of a firm’s bureaucracy in terms of employee numbers for profit maximization (Sardana, Gupta, Kumar, & Terziovski, Citation2020). In addition to these bodies of theory are critical resources theory and competence theory. Niman (Citation2004) argues that a “small” firm can be just as profitable as a “large” firm if they have unique argues that a "small" firm can be just as profitable as a "large" firm if they have unique competencies that lead them both to earn surplus turnover.
Moreover, we can also define company size in financial accounting terminology. Adiputra and Hermawan (Citation2020) stated that its market value represents the firm size. The market value equals the cash flow discounted value on assets over time.
Company size has two notions: capital and labor force. Capital measures total assets, and labor force measures the number of employees hired. Total assets determine the companies’ size and measure them in absolute financial terms to compare every industry (Juárez, Citation2018). Patience and Boffito (Citation2020) found that controlling the firm size in terms of the number of employees minimizes the average production cost, except in capital-intensive businesses. Gazioglu and Tansel (Citation2012) and Camisón-Zornoza, Lapiedra-Alcamí, Segarra-Ciprés, and Boronat-Navarro (Citation2004) found that employee size can impact innovation. This study uses employee size as a proxy for company size.
CEO tenure
The upper echelons theory contends that senior management characteristics affect a firm’s Performance (Mwangi, Awino, Ogollah, & Pokhariyal, Citation2021). They find that a manager’s attributes, such as age, education, functional background, and tenure, can predict performance. First, age is associated with experience, rigidity, and resistance to change (Tihanyi, Ellstrand, Daily, & Dalton, Citation2000). Herrmann and Datta (Citation2005) note that age could be a proxy for a person’s experience and tendency to take risks. Sannino, Di Carlo, and Lucchese (Citation2020) find that the age of CEOs of leading firms is typically five years older than the CEOs’ age in emerging firms. Second, Herrmann and Datta (Citation2005) find that individuals with higher education can process information faster when making decisions, are more innovative, and are more willing to embrace change. However, they also note that an individual’s higher education background could lead to excess analysis in management decisions. Third, the CEO's values and personality influence the company’s outcomes (H. Wang, Tsui, & Xin, Citation2011).
Tenure indicates the duration of employment, affecting individual CEO performance (Simsek, Citation2007). Behr and Fehre (Citation2019) find that long-term CEO tenure leads to a high commitment to the status quo and organizational values that enhance performance. One disadvantage is that the longer a person stays in an organization, the more this person becomes habituated and less challenged to the new environment (Herrmann & Datta, Citation2005). Also, CEOs with long tenures seem more likely to have inappropriate structures and strategies mismatched by their company’s ever-changing business environment (Mwangi, Citation2019). Under short-term tenure for CEOs, firms seemed to disclose more corporate governance information to shareholders than those with longer-tenured CEOs, mainly when a firm’s performance was weak (Mohd–Saleh, Mohd–Sanusi, Abd–Rahman, & Bukit, Citation2012).
Since organizations are continually facing economic ups and downs and need to handle new financial challenges, it is unavoidable that organizations will strive to change their CEO. Shen and Cannella (Citation2002) point out that outsider succession (rather than insider succession) can bring negative feelings toward the new CEO and an overall unpleasant atmosphere within the Senior Management Team (SMT). The literature on CEO tenure is plentiful, and more studies are being published exploring different contexts and cultural settings. This variable, CEO tenure, affects company performance significantly. Therefore, we have investigated its mediation effects on this study’s other variables,
R&D investment
We proceed with the first endogenous variable, R&D investment (R&DI).
Any technological innovation relies on R&DI investment, and innovation increases and improves outputs (Liu & Xia, Citation2018). Early studies found that R&D focuses on technology innovation through product and process improvement (Bergfors & Larsson, Citation2009). Vaona and Pianta (Citation2008) found that either incremental or radical change, product improvement creates new demand for a product. Technological process improvement also lowers overall costs, reduces product defects, and increases production.
Although R&D investment improves a company’s capabilities, it requires strong governance and other safeguards to minimize investment risks (Ciabuschi, Dellestrand, & Martín, Citation2015). Three types of hazards in R&D Investment are:
The nature of R&D Investments are intangible assets that serve as inadequate collateral, and some lenders are reluctant to fund such investments (Seo & Kim, Citation2020).
The risks associated with R&D investment are high because of the substantial time lag between investment and payoff (Beladi, Deng, & Hu, Citation2021). Besides, many external factors and events may arise during the interim and affect ultimate payoffs (Alam, Uddin, Yazdifar, Shafique, & Lartey, Citation2020).
R&D investment decision-making is often nontransparent, as any information leakage about a company’s proposed R&D projects could lead to imitation by competitors (Hafeez, Foroudi, & Nguyen, Citation2019). As a result, R&D projects find it challenging to obtain funding from lenders because they cannot disclose detailed information on the R&D projects to the lender and the public.
The above hazards may erode management decisions on R&D investments because of the management’s high monitoring costs. Furthermore, Chen (Citation2013) found an inverted-U CEO tenure in the R&D investment relationship that showed that the CEO life cycle directly affects R&D investment. Many studies also found that CEO characteristics, CEO tenure, and compensation package impact R&D investment (Barker & Mueller, Citation2002; Cheng, Citation2004; H. L. Chen, Citation2013).
Thus, the literature finds that while CEO Tenure and R&D Investment are partly related to the company’s performance, few studies on the mediation effects of R&D investment relate to other KPIs (Barasa, Kinyanjui, Knoben, Vermeulen, & Kimuyu, Citation2020; Dahiyat, Citation2015; Duan, Wang, & Zhou, Citation2020). We will hypothesize their relationship in the coming sections.
Employee size and R&D investment
Companies can borrow funds from two sources: internal funds and external funds. Borrowing external funds is more expensive than utilizing internal funds (Z. Zhu, Zhu, Xu, & Xue, Citation2019). Small companies have limited resources and financial capital, including internal and external funds (Jung & Kwak, Citation2018). Small companies may not have the intention or resources to conduct R&D activities. We will explore this relationship between EMPN and R&DI in the healthcare industry.
Therefore, we propose the following hypothesis.
Hypothesis 1:
Employee size has a positive impact on R&D investment.
Marketing expenses
Decisions made by management today on investment in research and development can influence a firm’s viability and growth into the 21st century. Coad and Grassano (Citation2019) reported a strong association between R&D spending and a subsequent increase in sales. His study also determined that the investment level of R&D should be higher than the marketing expenses, implying that there may be a relationship between R&D investment and marketing expenses. Sharma and Husain (Citation2015) also found that marketing expenses and profitability are highly related variables. Furthermore, marketing expenses build marketing capabilities (Krizanova et al., Citation2019). Later, Martin, Javalgi, and Ciravegna (Citation2020) pointed out that from the theory of the Resource-Based value point of view, focusing on higher-order marketing capabilities (culture and strategy) is more critical than marketing operational capabilities (tactics), which brings superior competitive performance. Thus, marketing management literature confirms that marketing expenses and company performance are positively related. However, the mediation effects study on marketing expenses and capabilities requires more investigation.
Employee size and marketing expenses
As discussed earlier, marketing expenses refer to the total expenditures spent on advertising and promotion and related marketing activities, comprising selling, general, and administrative expenses (SGA) in marketing in listed healthcare companies (Mishra & Ewing, Citation2020; Ptok, Jindal, & Reinartz, Citation2018; Traina, Citation2018).
In the study by Jeng and Pak (Citation2016), they found that EMPN directly affects the keenly competitive industry’s marketing capabilities. As explained earlier, MKTE is a part of the marketing capabilities, as Vaid, Ahearne, and Krause (Citation2021) suggested. Therefore, EMPN may have a positive relationship with MKTE.
Hence, we propose the following hypothesis.
Hypothesis 2:
Employee size has a positive impact on marketing expenses.
Company performance
In the 1990s, the BSC model integrates financial and non-financial measures into a management framework for company performance (Alswalmeh & Dali, Citation2020; Kaplan & Norton, Citation1992). Khan, Halabi, and Sartorius (Citation2011) found that about 78% of Asian companies use non-financial indicators for company performance besides financial measures. Measures in BSC, referred to as Key Performance Indicators (KPIs), measure how well the actual Performance matches determined business goals. There are two types of KPIs: leading and lagging indicators. The leading KPIs affect future performance, such as non-financial metrics, whereas lagging indicators are primarily financial metrics. The common uses of financial KPIs include:
Cash Flow (Park & Jang, Citation2013)
Total Assets (Ma, Citation2019; Zhang & Jia, Citation2020)
Gross Profit (Nariswari & Nugraha, Citation2020)
P.E. ratio (Khatin, Anjaswara, & Utami, Citation2016)
Book Value of Assets (Kim & Taylor, Citation2014)
Market Value of Equity (Pushpa Bhatt & Sumangala, Citation2012)
Tobin q as a proxy for firm value (Wolfe & Sauaia, Citation2003)
Return on Equity (Pan, Wang, & Weisbach, Citation2015)
Return on Assets (Garefalakis, Lappa, Mantalis, Xanthos, & Spinthiropoulos, Citation2015)
Sales (Lin, Lin, Song, & Li, Citation2011).
The non-financial KPIs are about return on management. The management return will likely focus on effectively allocating management energies, particularly optimizing alternatives within corporate goals and objectives (Buyya, Beloglazov, & Abawajy, Citation2010). Firms are increasingly implementing non-financial KPI metrics such as customer, employee satisfaction, compensation contract, quality, market share, productivity, and innovation (Banker & Mashruwala, Citation2007; Ittner & Larcker, Citation2003; Said, HassabElnaby, & Wier, Citation2003). They all found that a strong relationship between non-financial measures and firm performance is contingent on the firm’s operational and competitive characteristics.
As per company performance, although BSC measures financial and non-financial KPIs, financial goals are still valued more highly (Tuan, Citation2020); financial goals affect profitability, growth, and shareholder value. In other words, financial goals mean: to survive.
Employee size and company performance
Quo, Wang, and Shou (Citation2004) suggested that EMPN positively impacts PERF. However, we argue that individual measures such as Sales, Cash Flow, and ROE could be conservative and problematic (literature support). They may also be too subjective and risk introducing bias in the long run. To provide a more stringent measure for BSC or PERF's financial perspective, we propose adopting a latent variable by integrating three essential measures: sales, Cash flow, and Total Assets of listed healthcare companies. They are usually adopted as performance measures (Garefalakis et al., Citation2015; Lin et al., Citation2011; Ma, Citation2019; Park & Jang, Citation2013; Zhang & Jia, Citation2020).
Hence, the following hypothesis emerges.
Hypothesis 3:
Employee size has a positive impact on company performance.
CEO tenure and R&D investment
CEO tenure refers to the number of years of service of a CEO with a company. A CEO who plays the leading role in managing the listed company mostly directly impacts others. A CEO is powerful enough and has varied results in the company. In Silberzahn and Arregle’s (Citation2019) and Lin et al. (Citation2011) studies, the CEO positively influences R&DI. However, in some other studies, the relationship between TENR and R&DI is negative (Barker & Mueller, Citation2002). Some researchers found a negative non-linear relationship between TENR and R&DI (Wu, Levitas, & Priem, Citation2005). Similarly, Hsu, Chen, and Ho (Citation2020) found a negative non-linear relationship between hired TENR and R&DI. In this study, we reconfirm the positive relationship between TENR and R&DI.
CEOs with short tenure might not have sufficient company-specific experience and social networks to manage the company, especially at the beginning of the new job (Boling, Pieper, & Covin, Citation2016). Therefore, they are more short-term-oriented and risk-averse (Schuster, Nicolai, & Covin, Citation2020). We argue that these CEOs with short-tenure employment tend to spend less on R&D as they try not to make mistakes, and R&DI is risky (Lee & O'Neill, Citation2003).
Once TENR gets long, CEOs have already managed their initial learning curve (Souder, Simsek, & Johnson, Citation2012) and gained more trust from the board of directors through their performance. In addition, Barker and Mueller (Citation2002) found that the longer the CEO's tenure, the more effort will be spent on relative R&DI, as the longer the CEO tenure, CEOs will tend to use their authority to manipulate R&DI to accommodate their personal views. Eventually, CEOs in the longer term are more comfortable investing in more R&D.
Hence, we propose the following hypothesis.
Hypothesis 4:
CEO Tenure has a positive impact on R&D Investment.
CEO tenure and marketing expenses
The relationship between TENR and R&DI might apply to TENR and MKTE's relationship. For shorter TENR, CEOs tend to lack the expertise and network in the new company. Therefore, they are more cautious about spending on specific marketing types, such as socially responsible marketing campaigns.
The longer the CEO's tenure, the more expenses the CEO invests in marketing, as it takes time for CEOs to understand the new company (Boling et al., Citation2016). Short-term TENR tends not to spend much money on marketing campaigns as they are more risk-averse when they initially join the company. W. T. Chen, Zhou, and Zhu (Citation2019) found a significant positive relationship between TENR and PERF, which we interpret as a proxy of MKTE. There is a positive relationship between TENR and PERF. CEOs have extended regular employment periods, so they allocate more investment to improving the PERF. We aim to fill the gap by examining the relationship between TENR and MKTE.
Therefore, the following hypothesis emerges.
Hypothesis 5:
CEO tenure has a positive impact on marketing expenses.
CEO tenure and company performance
At the beginning of the CEO's tenure with a new company, they tend not to trust the board of directors and take time to explore the uncertainty confronted in the new environment (Chijoke-Mgbame, Citation2016). As a result, the relationship between TENR and PERF seems to have varied results.
In a longitudinal study of 98 CEOs, Henderson, Miller, and Hambrick (Citation2006) found that TENR positively impacts PERF in a stable environment.
However, in another study of 228 CEOs, TENR significantly negatively impacts PERF in a competitive and dynamic environment, as CEOs’ long tenure can burden the company’s ability to adapt to the changing environment (Henderson et al., Citation2006).
Further, there is a non-linear relationship between TENR and its performance in another empirical study in the film industry. The optimum years of performance are 8–10 years of CEOs’ service (Miller & Shamsie, Citation2001). Since the relationship between TENR and PERF is mixed, we seek to reconfirm this relationship.
Hence the following hypothesis is proposed.
Hypothesis 6:
CEO tenure has a positive impact on company performance.
Mediating relationship of marketing expenses between R&D investment and company performance
Previous findings have shown that MKTE is an understated factor that boosts R&DI in PERF (Chirumalla, Oghazi, & Parida, Citation2018; Fortune & Shelton, Citation2012; Ganguli, Citation2009; Krishnan, Tadepalli, & Park, Citation2009). We argue that R&DI and MKTE are not a tradeoff but a synergetic relationship. Though the healthcare industry is heavily driven by R&D, marketing also plays an essential role in the healthcare industry (Tse, Sin, Yau, Lee, & Chow, Citation2003).
Again, there is a lack of examination of the impact of the synergetic results of MKTE and R&DI on a more comprehensive PERF with multiple indicators such as sales, cash flow, and total assets.
We propose the following hypothesis.
Hypothesis 7:
Marketing expenses mediate the relationship between R&D investment and company performance.
To test this hypothesis, we need to confirm Hypotheses 7b & 7c., but not necessary 7a. These three hypotheses are discussed in the following three sections.
R&D investment and company performance (hypothesis 7a)
Results of previous studies of the impact of R&DI on PERF based on single factors are mixed. However, many studies find positive effects of R&DI on PERF (Hall & Oriani, Citation2006; Lantz & Sahut, Citation2005; B. Lee, Tsui, & Yau, Citation2019; Ravselj & Aristovnik, Citation2019; Schwartz, Miller, Plummer, & Fusfeld, Citation2011; Sharma, Davcik, & Pillai, Citation2016; Špacek & Vacík, Citation2016; Y. Wang, Du, Koong, & Fan, Citation2017). Also, R&DI positively impacts PERF, measured by the Return on Assets in three European countries’ listed companies (Beld, Citation2014).
Nonetheless, R&DI can negatively influence PERF due to risk factors and time factors (Ravšelj & Aristovnik, Citation2020; Xiong, Wang, & Zhao, Citation2020; Yoo, Lee, & Park, Citation2019). In addition, one study finds that R&DI has a quadratic relationship with PERF (Ho, Keh, & Omg, Citation2005).
However, there is a lack of examination of R&DI on PERF with multiple indicators such as sales, cash flow, and total assets.
Hence, we propose to examine the following hypothesis:
Hypothesis 7a:
R&D investment has a positive impact on company performance.
R&D investment and marketing expenses (Hypothesis 7b)
The relationship between R&DI and MKTE is very close, but we found mixed results. On the one hand, some research studies have discovered that R&DI and MKTE work together to produce significant positive PERF (Akyüz & Berberoğlu, Citation2016; H. Zhu, Zhao, & Abbas, Citation2020). However, on the other hand, we also found that the increase in R&DI causes a significant decrease in advertising expenses (Akyüz & Berberoğlu, Citation2016). Therefore, as the previous findings are contradictory, a reexamining of the relationship between R&DI and MKTE is needed.
Therefore, the following hypothesis emerges:
Hypothesis 7b:
R&D investment has a positive impact on marketing expenses.
R&D investment and company performance (hypothesis 7c)
Reasonable marketing efforts in customer relationship management have received recognition as a cost-effective marketing tool for two decades (Meesala & Paul, Citation2018; Memarista & Gestanti, Citation2018; Rashwan, Mansi, & Hassan, Citation2019; Trif, Duțu, & Tuleu, Citation2019; Yan, Wang, Flores, & Su, Citation2019).
However, some previous studies also discovered contradictory findings: a decrease in the advertising budget will increase the companies’ stock returns (Edeling & Fischer, Citation2016; Tuli, Mukherjee, & Dekimpe, Citation2012).
Like H7a, there is a lack of examination of the impact of MKTE on a more comprehensive latent PERF, such as sales, cash flow, and return on assets.
Hence, we propose the following hypothesis:
Hypothesis 7c:
Marketing expenses have a positive impact on company performance.
Quadratic relationship between R&D investment and marketing expenses
As unveiled in the prior studies and mentioned in Hypothesis 7b, there is a mixed relationship between R&DI and MKTE. Therefore, we aim to fill the void by examining the quadratic relationship between R&DI and MKTE. Hence, we propose the following hypothesis.
Hypothesis 8:
There exists a quadratic relationship between R&D investment and marketing expenses.
Moderating effect of CEO tenure and employee size on company performance
As per earlier discussion, the longer the CEO's Tenure, the more likely the CEO would increase his workforce to affect company performance (Henderson et al., Citation2006). In this study, our focal point is to reexamine the impact of TENR and EMPN on a group of attributes representing PERF. Hence, we propose the following hypothesis.
Hypothesis 9:
There exists an interaction effect of CEO tenure with employee size on company performance.
Research methods, findings, and data analysis
Sample and data source
We collected the PRC's healthcare industry information from the China Stock Market & Accounting Research Database (CSMARD) for 2016–2019. CSMARD has been a reliable public information source about the listed company’s profiles and performance. In addition, renowned universities such as Hong Kong Polytechnic University, Chicago University, University of Hong Kong, and Tsinghua University have adopted their academic endeavors during the past ten years.
According to Global Industrial Classification Standard (GICS), the companies that we selected fell in Sector 35 (Health Care), industry groups 3510 (Health Care Equipment & Services), and 3520 (Pharmaceuticals, Biotechnology, & Life Sciences). The database in this sector comprises 305 listed companies, which we all included in this study. As such, we may assume that the sample represents the healthcare industry population in the PRC.
The healthcare industry provides an ideal setting for testing our Model and hypotheses for several reasons. First, R&D is considered an essential investment in the healthcare industry as it tremendously affects company performance. Second, board chair and CEO duality are likely crucial decisions for the healthcare industry because of the PRC's enormous population. Last, the healthcare industry integrates sectors that provide curative, preventive, rehabilitative, and palliative care (World Health Organization, Citation2018). Third, we note that the industry represents an enormous consumer market of almost 15 billion consumers in the PRC. As its products and services are necessary for day-to-day life, we cannot overlook their importance.
Operationalization of variables
As discussed in Section “Research methods, findings, and data analysis,” there are two exogenous and three endogenous variables in the proposed Model. The following section describes how we operationalize these variables.
Endogenous variables
The three endogenous variables are R&DI, MKTE, and PERF, as shown in and .
Table 1. Operationalization of exogenous and endogenous variables.
We operationalized R&DI as the number of R&D investments, representing the amount of know-how and private expropriation hazards (Delios & Henisz, Citation2000). MKTE is the amount of money spent on promotion and other marketing activities. PERF is a construct measured by three individual variables: total assets, sales, and cash flow.
Exogenous variables
We have two exogenous variables in the Model, EMPNO, and TENR, as shown in and . EMPNO represents the company size, whereas TENR indicates the period a CEO has been hired.
Analysis methods
The literature on the choices of gender in the executive board, R&D investment, and marketing expenses have indicated that the regression and two-stage least square methods are the two most frequently employed techniques in data analysis. However, in this study, we adopted SmartPls 3.3.1, a structural equation modeling software, to test whether the data fit the Model and its hypotheses while controlling for the year’s fixed effect. Missing values were first replaced by linear interpolation, and then to reduce multicollinearity, we standardized most variables in the analysis.
We have several justifications for using SmartPls 3.3.1. First, this paper’s econometric Model consists of a series of regression equations. SmartPls, by itself, is software to handle structural equation modeling. It can perform the same job as the two-stage least square regression method, not to mention the simple regression analysis. Therefore, we considered it appropriate to assess the Model and test the hypotheses we postulated.
Second, in assessing models without latent variables, the use of SmartPls may provide extra information on how an exogenous variable contributes to explaining an endogenous variable (f2 effect size), and the relative predictive relevance (q2 effect size), which other econometric and structural equation modeling software do not provide.
Last, SmartPls has a particular characteristic of handling small samples. Although this study’s sample size (305) is medium, this is yet a specific case. Many other countries may have much smaller sample sizes in the healthcare industry. For example, NYSE has about 90 companies in the healthcare industry. As such, the use of SmartPls 3.3.1 serves to help compare the same Model across different countries in the future, regardless of their sample sizes.
Results
We present descriptive statistics and correlation coefficients in . EMPNO has a mean of about 3256 with a broad standard deviation of 4250, indicating that companies in the sample have a large employee size. On the one hand, it strongly correlates with all other variables in the Model except for TENR, showing a good sign as EMPNO and TENR are exogenous variables. Along the same line, the three variables, ZTASSET, ZSALES, and ZSCF_1, are highly correlated, signifying that they all contribute to measuring PERF. These three variables are also strongly and significantly related to ZMEXP. On the other hand, ZCEOTenure, which measures TENR, shows no relationship with other model variables. All these relationships are consistent with what we have discussed in Section “Model development and its hypotheses.”
Table 2. Descriptive statistics and correlation coefficient matrix.
Assessing the Model
Testing the Model and its hypotheses, we have slightly modified the procedures suggested by Hair, Hult, Ringle, and Sarstedt (Citation2016), which have three parts of evaluation: reflective measurement models, formative measurement models, and structural models. Since the Model does not deal with formative measures, we skipped the second part. The third part consists of six steps, as shown in .
Figure 2. Structural model assessment procedure.
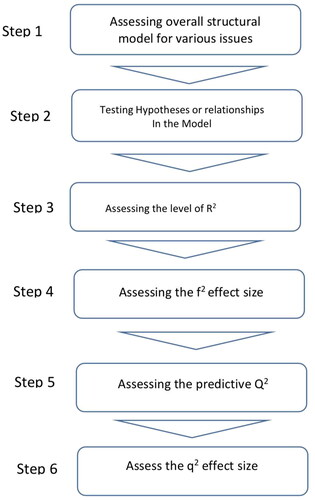
Step 1. Assess the structural Model for various issues
To assess collinearity, we need to examine each predictor separately for each structural model’s subpart. However, since we have standardized some variables before data analysis, their VIF values become 1. Overall, we do not have multicollinearity with VIF higher than 5. Hence, multicollinearity is not a problem.
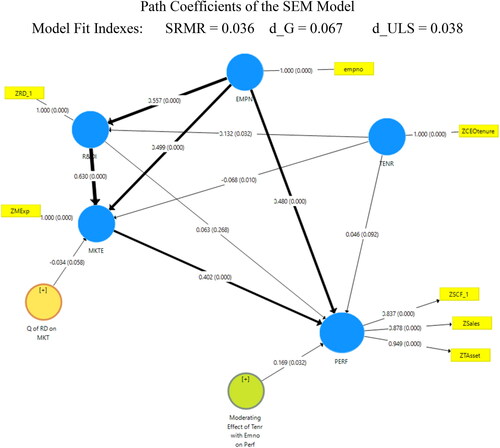
The standardized-root-mean-square-residual (SRMR) was a model fit measure suggested by Henseler et al. (Citation2014). It is the root mean square discrepancy between the observed and model-implied correlations. When applying Covariance-Structural Equation Modeling (CB-SEM), the threshold for SRMR was set as 0.08. Hair et al. commented that this value would be too low for Partial Least Square. Structural Equation Modeling (PLS-SEM) the purpose of PLS-SEM is to maximize the explained variance of the endogenous variables or constructs. In assessing the Model, we found SRMR 0.079 and NFI 0.823. The former is smaller than the threshold of 0.08, while the latter is larger than the threshold of 0.6. Further, two fit indexes for PLS-SEM, d_ULS, and d_G were found to be 0.038 and 0.067, respectively. As such, we may conclude that the data fit the Model well with a small amount of residual.
As PERF is a construct, we checked its relevance using the following three indicators. The first is its composite reliability, which we found 0.920 with t statistic, 63.37, p = 0.000, higher than the threshold level of 0.7. The second is its AVE, which we found at 0.794 with a t-statistic, 25.19, p = 0.000, higher than the threshold level of 0.5. The two statistics and their significance were found using the bootstrapping procedure of SmartPls 3.3.1 with 7500 samples. As shown in , we found high outer loadings of PERF, more prominent than 0.8, indicating that these three reflective measures integrate to represent PERF.
Figure 3. Path coefficients of the SEM model. Model Fit Indexes: SRMR = 0.036 d_G = 0.067 d_ULS = 0.038.
Step 2. Testing hypotheses or relationships in the Model
Submitting the structural model data () to SmartPls 3.3.1, we set the algorithm iteration equal to 500 and bootstrapping samples to 7,500. and indicate that the analysis outputs with all paths are significant at p < 0.05, except for two paths, R&DI →PERF and TENR→PERF.
Table 3. Assessing the mediating effect of MKTE.
Now we discuss the significance of each hypothesis in turn.
Hypothesis 1:
This hypothesis postulates the impact of EMPNO on R&DI. As shown in , the path coefficient was found to be 0.557, significant at p < 0.000. Therefore, Hypothesis 1 is supported.
Hypothesis 2:
This hypothesis postulates the impact of EMPNO on MKTE. We found the path coefficient 0.499, significant at p < 0.000, as shown in . Therefore, Hypothesis 2 is supported.
Hypothesis 3:
In this hypothesis, we try to test if EMPN has a significant effect on PERF. In , the path coefficient was found to be 0.480, which is significant at p < 0.000. Thus, the relationship in this hypothesis is confirmed.
Hypothesis 4:
We postulate a significant causal relationship between TENR and R&DI. The path coefficient was found to be 0.132, significant at p < 0.032. We recommend that this hypothesis receive support.
Hypothesis 5:
We propose the relationship between TENR and MKTE in this hypothesis. The result of the data analysis shows a significant coefficient of −0.068 at p < 0.010. Hence, this hypothesis receives support.
Hypothesis 6:
This is a crucial hypothesis relating TENR with PERF. We found a weak relationship of 0.045, which is not significant at p < 0.05, but at p < 0.10. As such, we cannot confirm the hypothesis at the usual level of p < 0.050.
Hypothesis 7a:
To confirm Hypothesis 7, we do not mind if this hypothesis is rejected or not. However, the indirect effects (Hypothesis 7b and & 7c) tend to be more crucial if MKTE is considered a mediator. Therefore, we would consider the four hypotheses (7a, 7b, 7c, and 7) together.
The path coefficient, R&DI on PERF, was found to be 0.063, insignificant at p < 0.10. This result is consistent with the literature (Ravšelj & Aristovnik, Citation2020; Xiong et al., Citation2020; Yoo et al., Citation2019). Therefore, this hypothesis is rejected.
Hypotheses 7b and 7c
To confirm MKTE as a mediator, we require that these two hypotheses be significant. As shown in , the path coefficients of R&DI → MKTE and MKTE → PERF were found to be 0.63 and 0.402, respectively, both significant at p < 0.005. Thus, the total indirect effect of these two paths is 0.253 (0.63 × 0.402). Accordingly, these two hypotheses are confirmed.
Hypothesis 7:
H7a, H7b, and H7c were integrated to form this hypothesis. Consider the red triangle in . In three steps, we evaluate this hypothesis using the procedure suggested by Yue et al. (Citation2021). As shown in , we adopted Sobel’s Z-test and calculated the Z-statistic = 3.886, significant at p < 0.001. This initial step tentatively confirms MKTE as a mediator. In the second step, we reran the Model without the direct effect, R&DI → PERF, and found its path coefficient equal to 0.228, significant at p < 0.000. Step 3 is crucial as we need to perform several calculations. First, we calculated the combined direct effect (0.253) as shown in Hypotheses 7b and 7c. Its standard deviation was calculated using the 7500-samples bootstrapping data and found to be 0.044. Second, the total effect (0.316) was imputed by adding the direct effect (0.063) and indirect effect (0.253). The VAF (variance accounted for) was found to be 0.800, with t = 5.75, significant at p < 0.001. As the VAF is more prominent than 0.20, the threshold for a mediator’s existence, we conclude that Hypothesis 7 is confirmed. We call it Significant Mediation.
Hypothesis 8:
This hypothesis examines the non-linear relationship between R&DI and MKTE. SmartPls provides a straightforward approach to obtaining the quadratic path coefficient. As a result, the coefficient was found to be −0.034, which is significant at p < 0.059. The quadratic equation is MKTE = 0.630 R&DI − 0.034 R&DI2, a U-reversed curve with a maxima (see ).
Figure 4. Quadratic effect of R&DI on marketing expenses.
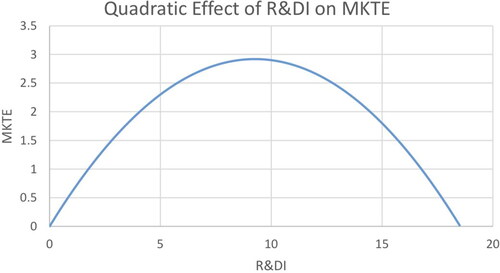
As the coefficient is insignificant at p < 0.050, we tend to reject the hypothesis or marginally accept it at p < 0.10.
Hypothesis 9:
Again, this hypothesis deals with the interaction effect of EMPN with TENR on PERF. That is to say, we would test if EMPN enhances the effect of TENR on PERF. This is paramount, especially when Hypothesis 6 is on the verge of rejection. We will discuss this later. The present result indicates that the interaction effect is significant, with a coefficient of 0.190 at p < 0.032. That means CEO tenure tends to enhance company performance in large companies.
We summarize the results in . Out of the 12 hypotheses that we postulated, nine were supported. H7a that R&DI → PERF were rejected at p < 0.268, H6 that TENR affected PERF was accepted at p < 0.092, and H8 that the quadratic effect from R&DI on MKTE was only accepted at p < 0.058. As such, we conclude that H7a was rejected without a doubt. H8 and H7a were weakly supported, so further examination of these links seems necessary in the future.
Table 4. Results of hypotheses testing.
We further delve into the structural model relationships by examining the total and indirect effects. After testing the twelve hypotheses primarily by assessing the direct effects (see , we found in that out of the Model’s fourteen total effects, only three were insignificant at p > 0.05. The first two are R&DI → PERF and TENR → PERF. The third is R&DI’s quadratic effect on MKTE, which we have partially confirmed in .
Table 5. Total effects of the model.
On the other hand, shows five indirect effects in the Model, statistically significant at p < 0.05, indicating that paths in the Model are well linked together.
Table 6. Five significant and relevant indirect effects.
The next thing to do is to assess the cross-validation of the Model. By dividing the dataset into two groups, we coded odd-numbered companies as one (1) and even-numbered companies as two (2). The multi-group procedure of the SmartPls Program was employed to compare whether path coefficients in the Model are significantly different across the two groups. shows the results of the cross-validation analysis. Column 4 provides p-values for assessing differences across two groups for all paths in the Model. S1 in the column’s header represents the first group, while S2 represents the second group. Except for the link between TENR and R&DI, all path coefficients are not significantly different across the two groups. These indicate that the two samples are statistically insignificant in all path coefficients. Hence, we have successfully cross-validated the Model.
Table 7. Two-sample cross-validation.
Step 3. Assessing k the level of R2
We examine the R2 values of the endogenous variables, as shown in . As all variables explain PERF, it has a high R2 value of 0.812. Furthermore, as MKTE is affected by EMPNO, R&DI, and TENR, it also has a good R2 of 0.726. In contrast, R&DI, which EMPNO and TENR influence, has a relatively weak R2 value of 0.319. However, evaluating R2 values is not enough, as an endogenous variable may be explained by more than one exogenous variable. Therefore, we must delineate which exogenous variables may contribute more variance than the others.
Table 8. Summary results of R2 and Q2.
Step 4. Assessing the f2 effect size
Hair et al. commented that the f2 effect size allows for assessing an exogenous variable’s contribution to an endogenous variable’s R2 value. For example, a value of 0.02 represents a small effect, whereas an amount of 0.35 has a strong impact.
shows the effect sizes f2 for all combinations of endogenous variables (represented by the columns) and corresponding exogenous variables (defined by the rows). EMPN has a considerable effect size of 0.703, 0.509, and 0.493 on MKTE, PERF, and R&DI, respectively. MKTE has a medium effect size of 0.267 on PERF and R&DI and an effect size of 0.309. Further, the moderating and non-linear effects are weak in contributing to MKTE and PERF, respectively. The contribution of TENR to RD&I, MKTE, and PERF is weak as their f2 effect sizes only reach less than 0.03.
Table 9. Results of f2 and q2.
Step 5. Assess the predictive relevance Q2
Q2 value is an indicator of a model’s out-of-sample predictive power or predictive relevance, as defined by Hair et al. (Citation2016). When a structural model shows predictive relevance, it accurately predicts data not used in the model estimation. Therefore, we expect Q2 values larger than zero for a specific endogenous variable in a structural model, indicating the path model’s predictive relevance for a particular dependent variable. Conversely, that Q2 value equal to or smaller than zero shows a lack of predictive relevance. The blindfolding procedure in SmartPls can be adopted to calculate the Q2 value in two ways: the cross-validated redundancy approach and the cross-validated communality approach. However, Hair et al. (Citation2016) advised adopting the first approach to predict eliminated data points because it includes the structural and path Model’s critical elements.
We applied the blindfolding procedure to the path model shown in . We obtained the Q2 values for all endogenous variables, as shown in . All Q2 values are more significant than zero, indicating that all endogenous variables have predictive relevance.
R&DI has a Q2 value of 0.294, showing an acceptable predictive relevance. In contrast, MKTE and PERF show strong predictive relevance as their Q2 values are 0.664 and 0.600, respectively.
Overall, we have found the three endogenous variables with solid predictive relevance. However, having predictive relevance is not enough. We need to find the effect size q2, which measures the relative predictive relevance by comparing the Q2 values obtained after including and excluding the predictors.
Step 6. Assess the q2 effect size
According to Hair et al. (Citation2016), q2 effect size is a measure to assess a predictor variable’s relative predictive relevance on an endogenous construct. We can obtain it through three steps based on calculating two different forms of Q2. First, we can receive a Q2 value using the blindfolding procedure that measures the path model by including the exogenous variable. We call it Q2 (included). The second step is to get a Q2 value that measures the path model but excludes the exogenous variable. We call it Q2 (excluded). The third step is to calculate q2 using the following formula: [Q2(included) – Q2(excluded)]/(1-Q2(included).
As such, the effect size q2 allows for examining an exogenous variable’s contribution to an endogenous variable’s Q2 value. Hair et al. (Citation2016) suggest that q2 values of 0.02, 0.15, and 0.35, respectively, reflect that an exogenous variable has a small, medium, or considerable predictive relevance for a particular endogenous variable.
After applying the blindfolding procedure several times, we obtain the q2 effect size for the Model depicted in by alternatively deleting one exogenous variable after another. shows the results of these blindfolding iterations.
According to the size of q2s, both TENR and R&DI tend to have weak predictive relevance to their endogenous variables. In contrast, EMPN and MKTE have strong predictive relevance as they have q2 effect sizes ranging between 0.25 and 0.45.
Section summary
We employed SmartPls 3.3.1 to assess our Model and test the twelve hypotheses that we postulated in Section 3. There are several findings worth noting. First, the indicators SRMR and d_ULS suggested that the data fit the Model well. Second, all hypotheses except Hypotheses 6 and 7a were rejected at p < 0.05 or supported at p < 0.1. The f2 effect sizes indicated that exogenous variables have contributed to explaining their endogenous variable, except that TENR does not contribute to R&DI and MKTE. Concerning relative predictive relevance, all predictors in the model exhibit medium to considerable strength in predicting their respective endogenous variables. Concerning Hypothesis 7, we have tested Hypotheses 7a, 7b, and 7c together and concluded that MKTE belongs to a type of significance mediator between R&DI and PERF.
Conclusion and discussion
This paper aims to review the empirical literature on BSC implementation. Our study supports that the BSC is very versatile and applicable internationally. As shown in , we designed a model for the interactions and formulated and tested twelve hypotheses. Nine were fully supported, two hypotheses were rejected, and one was only marginally supported.
Table 10. Results of hypothesis testing.
Shih-Jen & Kidwell (Citation2000) found many successful BSC implementations in the USA, with only a few exceptions. Such evidence has not yet been fully documented in non-US firms. Our study begins to fill this gap by examining BSC use in China, a country with a unique operating environment and business practices differing from the USA. Overall, our results were consistent with the USA's BSC implementation. Chinese companies may use the BSC model as a management communication tool with their global partners for benchmarking purposes. This study addresses the mediation effects on the implementation of the BSC model. It makes the following contributions to enriching the literature and enhancing managerial practices as described in the BSC model:
A company should keep an appropriate size of the employee. Miller et al. (Citation2020) pointed out that downsized organizations harm layoff survivors’ willingness to learn and implement the organization’s changes. The survivors perceived the downsizing as a psychological contract violation that impacted their engagement in innovative work behaviors (Hammond et al., Citation2019). Our study found that employee size has a direct positive impact on R&D investment and company performance. It implied that the quality of human capital in terms of qualification and headcount was a crucial success factor described in the learning and growth aspect of BSC (Manville, Karakas, Polkinghorne, & Petford, Citation2019).
A company’s performance should be assessed by employee size and CEO tenure. This study found two results. First, there was a weak effect between CEO tenure and company performance. Second, there was a moderating effect of employee size with CEO tenure on company performance. The evidence of positive moderating effects on human and social capital affected CEO’s managerial choices and, consequently, their company’s performance
Our study examined the CEO tenure’s effects on R&D investment and marketing expenses with both positive supports. First, R&D investment was often unstable yearly, creating materials and directionally different performance measures, particularly in the technology and healthcare industry. The evidence of a long CEO tenure would provide a stable and predictable corporate governance environment that stimulated and strengthened innovation activities. Second, R&D investment must be marketable. Thus, the evidence of the positive effects of marketing expenses on R&D efforts influenced the CEO’s decision-making capabilities and, consequently, their R&D decision as part of the BSC model’s customer and internal process aspects (Mohd–Saleh et al., Citation2012; Sannino et al., Citation2020).
The notion of balance in the BSC usage was often a result of mindset, leading to enhanced focus and better work performance. In our study, Marketing Expenses were the enhanced focus and directly affected Company Performance, whereas R&D Investment did not affect Company Performance directly. Our study produced two results. First, Marketing Expenses mediated R&D Investment and Company Performance; second, it had a negative quadratic relationship with R&D Investment. The mediation role of Marketing Expenses implied that a marketing-led company interacted with and affected the capacity and capability of the CEO’s decision-making process on R&D investment. Second, the quadratic effect finding of Marketing Expenses on R&D Investments depicted the feasibility of R&D investments. There was a maximum of 30% marketing expenses limits on the growth of R&D investments. The evidence of marketing function played a vital role in guiding R&D efforts as part of the customer and internal process aspects of BSC (Walters & Rainbird, Citation2007).
Finally, but not least, the primary purpose of BSC usage is company performance. Traditionally, sales turnover is the dominant factor for measuring company performance. However, in this study, two additional measures of cash flow and total assets used for company performance indicated high relevancy to survive, succeed, and prosper (Kaplan & Norton, Citation2005).
Limitations and directions for future research
The selection of variables was consistent with other previous studies (Tsui, Lee, & Yau, Citation2022). However, there are some limitations to this study.
First, the data of this study were collected from 2016 to 2019, which were most updated when we conducted this study. Therefore, we should retest the Model when the most updated data are available.
Second, other variables, such as the gender of CEOs in publicly listed companies and owners of privately owned healthcare companies, were not included in this study due to the unavailability of data. Future research should consider including the gender of the CEO, digital healthcare service systems, IPO for financing private healthcare businesses, 5 G for remote medical treatments, the prevention-first healthcare policy such as the dynamic zero policy of Covid-19, zero-makeup drug reform policy, and China-Western medical schools reform.
Third, this study found the mediation effects among the selected variables applicable in China’s healthcare industry, such as the quadratic effect between R&DI and MKTE. We need further verification in a different data set.
Fourth, this cross-sectional research may undermine the changes of various variables in the Model, such as the performance for profit or service standard. Therefore, future researchers should consider conducting a longitudinal study to confirm the Model and track the changes in the results.
Fifth, the influence of external facts, such as the state’s policy on healthcare reform, was not considered as our research was based on an available dataset we purchased. Future studies should include the public-private collaboration business model that bears many hallmarks in healthcare reform in China. For instance, patients’ medical information can be shared between public hospitals and private clinics in Hong Kong.
Finally, we anticipate that researchers may want to replicate our study in other Asian and non-Asian countries to explore their specific differences and similarities.
Disclosure statement
The authors state that there is no conflict of interest as this research received no specific grant from the public, commercial, or not-for-profit funding agencies.
Additional information
Notes on contributors
Bernard Lee
Dr. Bernard Lee obtained his Doctor of Philosophy (Ph.D.) in Marketing from The University of Nottingham, Doctor of Business Administration (D.B.A.) from The University of Newcastle, Master of Business Administration (M.B.A.) from The University of Edinburgh, and a Master of Science (M.Sc.) from The University of Hong Kong. Having more than ten years of Marketing experience, Dr. Lee is a Chartered Marketer and a Member of The Chartered Institute of Marketing (MCIM), and a Life Member of the Internet Professional Association (iProA). His research interests include Chinese Value, Services Marketing, Consumer Behavior, Marketing Strategy, and Leadership.
Anthony S. C. Tsui
Dr. Anthony S. C. Tsui is the founder of Zhuhai Ocean Bright Education Consulting Co., Ltd, an Associate Professor of Business and Management, Director of Academy of Continuing Education of Beijing Normal University-Hong Kong Baptist University, United International College.
Dr. Tsui was also a Programme Director for The University of Hong Kong, School of Professional and Continuing Education. He received his Doctor in Business Administration from the University of Newcastle, Australia, Master of Arts, Master of Management from Macquarie University, Australia, and Master of Business Administration (Finance Option) from California State University, USA, as well as several professional titles such as Chartered Marketer, Fellow Chartered Financial Practitioner, and MBTI trainer. Before his academic career, Dr. Tsui has over twenty years of business development experience in the real estate industry in Hong Kong and Canada. In Hong Kong, he was employed as a senior manager by two public listed companies. In Canada, Dr. Tsui was a self-employed SME engaged in health food restaurants, electronic games & entertainment, and real estate & insurance businesses.
Oliver H. M. Yau
Prof. Oliver H. M. Yau is now a Distinguished and Honorary Professor at The Metropolitan Open University of Hong Kong. He is a retired Chair Professor of Marketing at City University of Hong Kong (CityU) where he had served as Associate Dean (Graduate Programmes) ofthe Faculty of Business for seven years and Head of the Department of Business and Management for two years. After his retirement, he joined the University of Nottingham and had served as a Professor of Marketing at its Ningbo Campus in China during 2014-15. Being an Australian Chinese, he holds a B.B.A. degree with honors and an MBA degree from the Chinese University of Hong Kong, an International Teacher’s Certificate from CESA (now HEC), France, and a Ph.D. degree in marketing from the Management Center, University of Bradford, England.
References
- Adiputra, I. G., & Hermawan, A. (2020). The effect of corporate social responsibility, firm size, dividend policy and liquidity on firm value: Evidence from manufacturing companies in Indonesia. International Journal of Innovation, Creativity and Change, 11(6), 325–338.
- Akyüz, A. M., & Berberoğlu, M. (2016). The moderator effect of R&D expenses on the relationship between companies advertising expenses and market values. Gümüshane University Electronic Journal of the Institute of Social Science/Gümüshane Üniversitesi Sosyal Bilimler Enstitüsü Elektronik Dergisi, 7(17), 249–263.
- Alam, A., Uddin, M., Yazdifar, H., Shafique, S., & Lartey, T. (2020). R&D investment, firm performance and moderating role of system and safeguard: Evidence from emerging markets. Journal of Business Research, 106, 94–105.
- Alswalmeh, A. A. A., & Dali, N. R. S. M. (2020). The effects of accounting and market indicators towards company’s performance: A conceptual framework. Asian Journal of Accounting and Finance, 2(2), 85–89.
- Arnaboldi, F., Casu, B., Kalotychou, E., & Sarkisyan, A. (2020). The performance effects of board heterogeneity: What works for EU banks? The European Journal of Finance, 26(10), 897–924.
- Banker, R. D., & Mashruwala, R. (2007). The moderating role of competition in the relationship between nonfinancial measures and future financial performance. Contemporary Accounting Research, 24(3), 763–793. doi:10.1506/car.24.3.4
- Banker, R. D., Chang, H., & Pizzini, M. J. (2004). The balanced scorecard: Judgmental effects of performance measures linked to strategy. The Accounting Review, 79(1), 1–23. doi:10.2308/accr.2004.79.1.1
- Barasa, L., Kinyanjui, B., Knoben, J., Vermeulen, P., & Kimuyu, P. (2020). Innovation and exporting: The case of mediation effects in Sub-Saharan Africa. Industry and Innovation, 28, 1–23. doi:10.1080/13662716.2020.1768514
- Barker, V. L., III, & Mueller, G. C. (2002). CEO characteristics and firm R&D spending. Management Science, 48(6), 782–801. doi:10.1287/mnsc.48.6.782.187
- Behr, H., & Fehre, K. (2019). CEO succession and the CEO’s commitment to the status quo. Business Research, 12(2), 355–381. doi:10.1007/s40685-018-0064-4
- Beladi, H., Deng, J., & Hu, M. (2021). Cash flow uncertainty, financial constraints and R&D investment. International Review of Financial Analysis, 76, 101785. doi:10.1016/j.irfa.2021.101785
- Beld, B. (2014). The effect of R&D investment on firm performance (Bachelors dissertation, University of Twente). University of Twente student theses. http://purl.utwente.nl/essays/66303.
- Bergfors, M. E., & Larsson, A. (2009). Product and process innovation in process industry: A new perspective on development. Journal of Strategy and Management, 2(3), 261–276. doi:10.1108/17554250910982499
- Besanko, D., Dranove, D., Shanley, M., & Schaefer, S. (2004). Economics of strategy (3rd ed.). New York: Wiley.
- Bisbe, J., & Barrubés, J. (2012). The balanced scorecard as a management tool for assessing and monitoring strategy implementation in health care organizations. Revista Española de Cardiología (English Edition), 65(10), 919–927. doi:10.1016/j.rec.2012.05.011
- Boling, J. R., Pieper, T. M., & Covin, J. G. (2016). CEO tenure and entrepreneurial orientation within family and nonfamily firms. Entrepreneurship Theory and Practice, 40(4), 891–913. doi:10.1111/etap.12150
- Buyya, R., Beloglazov, A., & Abawajy, J. (2010). Energy-efficient management of data center resources for cloud computing: A vision, architectural elements, and open challenges. arXiv preprint arXiv:1006.0308
- Cakir, G., Bezbradica, M., & Helfert, M. (2019). The Shift from financial to non-financial measures during transition into digital retail–A systematic literature review. In International conference on business information systems (pp. 189–200). Cham: Springer.
- Camisón-Zornoza, C., Lapiedra-Alcamí, R., Segarra-Ciprés, M., & Boronat-Navarro, M. (2004). A meta-analysis of innovation and organizational size. Organization Studies, 25(3), 331–361. doi:10.1177/0170840604040039
- Chan, Y. C. L., & Ho, S. J. K. (2000). Performance measurement and the use of balanced scorecard in Canadian hospitals. Advances in Management Accounting, 9, 145–170.
- Chen, H. L. (2013). CEO tenure and R&D investment: The moderating effect of board capital. The Journal of Applied Behavioral Science, 49(4), 437–459. doi:10.1177/0021886313485129
- Chen, W. T., Zhou, G. S., & Zhu, X. K. (2019). CEO tenure and corporate social responsibility performance. Journal of Business Research, 95, 292–302. doi:10.1016/j.jbusres.2018.08.018
- Cheng, S. (2004). R&D expenditures and CEO compensation. The Accounting Review, 79(2), 305–328. doi:10.2308/accr.2004.79.2.305
- Chijoke-Mgbame, A. M. (2016). The effect of CEO background risks on risk taking and firm performance (Doctoral dissertation). Middlesex University.
- Chirumalla, K., Oghazi, P., & Parida, V. (2018). Social media engagement strategy: Investigation of marketing and R&D interfaces in the manufacturing industry. Industrial Marketing Management, 74, 138–149. doi:10.1016/j.indmarman.2017.10.001
- Chu, Z., Xu, J., Lai, F., & Collins, B. J. (2018). Institutional theory and environmental pressures: The moderating effect of market uncertainty on innovation and firm performance. IEEE Transactions on Engineering Management, 65(3), 392–403. doi:10.1109/TEM.2018.2794453
- Ciabuschi, F., Dellestrand, H., & Martín, O. M. (2015). Internal embeddedness, headquarters involvement, and innovation importance in multinational enterprises. In Knowledge, networks, and power (pp. 284–317). London: Palgrave Macmillan.
- Coad, A., & Grassano, N. (2019). Firm growth and R&D investment: SVAR evidence from the world’s top R&D investors. Industry and Innovation, 26(5), 508–533. doi:10.1080/13662716.2018.1459295
- Daemmrich, A. (2013). The political economy of healthcare reform in China: Negotiating public and private. SpringerPlus, 2(1), 1–13. doi:10.1186/2193-1801-2-448
- Dahiyat, S. E. (2015). An integrated model of knowledge acquisition and innovation: Examining the mediation effects of knowledge integration and knowledge application. International Journal of Learning and Change, 8(2), 101–135.
- Delios, A., & Henisz, W. I. (2000). Japanese firms’ investment strategies in emerging economies. Academy of Management Journal, 43(3), 305–323.
- Duan, Y., Wang, W., & Zhou, W. (2020). The multiple mediation effect of absorptive capacity on the organizational slack and innovation performance of high-tech manufacturing firms: Evidence from Chinese firms. International Journal of Production Economics, 229, 107754.
- Edeling, A., & Fischer, M. (2016). Marketing’s impact on firm value: Generalizations from a meta-analysis. Journal of Marketing Research, 53(4), 515–534.
- Folan, P., & Browne, J. (2005). Development of an extended enterprise performance measurement system. Production Planning & Control, 16(6), 531–544.
- Fortune, A., & Shelton, L. (2012). R&D effort, effectiveness, and firm performance in the pharmaceutical sector. Journal of Business and Management, 18(1), 97–115.
- Gama, A. P. D. (2017). A balanced scorecard for marketing. International Journal of Business Performance Management, 18(4), 476–494.
- Ganguli, S. (2009). Impact of R&D versus marketing on sales growth in Indian industrial sectors. IUP Journal of Management Research, 8(2), 55–64.
- Garefalakis, A., Lappa, E., Mantalis, G., Xanthos, G., & Spinthiropoulos, K. (2015). How IFRS affects the return on asset? & is more value relevant constructed based on IFRS than based on local GAAP? (Doctoral dissertation). Technological Education Institute of Western Macedonia.
- Gazioglu, S., & Tansel, A. (2012). Managerial attitudes towards employees, firm size and job satisfaction in britain. ERC Working Paper. Ankara: Department of Economics Middle East Technical University.
- Habidin, N. F., Khaidir, N. A., Shazali, N. A., Ali, N., & Jamaludin, N. H. (2015). The development of process innovation and organizational performance in the Malaysian healthcare industry. International Journal of Business Innovation and Research, 9(2), 148–162.
- Hafeez, K., Foroudi, P., & Nguyen, B. (2019). An integrated core competence evaluation framework for portfolio management in the oil industry. International Journal of Management and Decision Making, 18(3), 229–256.
- Hair, J. F., Jr., Hult, G. T. M., Ringle, C., & Sarstedt, M. (2016). A primer on partial least squares structural equation modeling (PLS-SEM). New York: Sage publication.
- Hall, B. H., & Oriani, R. (2006). Does the market value R&D investment by European firms? Evidence from a panel of manufacturing firms in France, Germany, and Italy. International Journal of Industrial Organization, 24(5), 971–993.
- Hammond, M., Cross, C., Farrell, C., & Eubanks, D. (2019). Burnout and innovative work behaviours for survivors of downsizing: An investigation of boundary conditions. Creativity and Innovation Management, 28(3), 306–317. 10.1111/caim.12327.
- Han, M. P., Seok, B. I., & Kim, J. H. (2017). Effects of six personality factors of CEOs at small and medium-sized enterprises on performance in business management: Focusing on learning and growth. Asian Academy of Management Journal, 22(2), 97–128.
- Henderson, A. D., Miller, D., & Hambrick, D. C. (2006). How quickly do CEOs become obsolete? Industry dynamism, CEO tenure, and company performance. Strategic Management Journal, 27(5), 447–460.
- Henseler, J., Dijkstra, T. K., Sarstedt, M., Ringle, C. M., Diamantopoulos, A., & Straub, D. W. (2014). Common beliefs and reality about PLS. Organizational Research Methods, 17(2), 182–209. 10.1177/1094428114526928
- Herrmann, P., & Datta, D. K. (2005). Relationships between top management team characteristics and international diversification: An empirical investigation. British Journal of Management, 16(1), 69–78.
- Ho, T. K., Keh, H. T., & Omg, J. M. (2005). The effects of R&D and advertising on firm value: An examination of manufacturing and nonmanufacturing firms. IEEE Transactions on Engineering Management, 52, 1–12.
- Hsu, W. T., Chen, H. L., & Ho, M. H. C. (2020). CEO tenure and R&D investment: Founders vs. agents and the role of independent directors. Technology Analysis & Strategic Management, 32(10), 1209–1222.
- Inamdar, N., Kaplan, R. S., & Reynolds, K. (2002). Applying the balanced scorecard in healthcare provider organizations/practitioner’s response. Journal of Healthcare Management, 47(3), 179.
- Islami, X., Mustafa, N., & Topuzovska Latkovikj, M. (2020). Linking porter’s generic strategies to firm performance. Future Business Journal, 6(1), 1–15.
- Ittner, C. D., & Larcker, D. F. (2003). Coming up short on nonfinancial performance measurement. Harvard Business Review, 81(11), 88–95, 139.
- Jeng, D. J. F., & Pak, A. (2016). The variable effects of dynamic capability by firm size: The interaction of innovation and marketing capabilities in competitive industries. International Entrepreneurship and Management Journal, 12(1), 115–130.
- Jia, L., Quan, M., Fu, Y., Zhao, T., Li, Y., Wei, C., … Shi, S. (2020). Dementia in China: Epidemiology, clinical management, and research advances. The Lancet Neurology, 19(1), 81–92.
- Jónsson, B. (2007). Does the size matter? The relationship between size and profitability of Icelandic firms. Bifröst Journal of Social Science, 1, 43.
- Juárez, F. (2018). The growth of companies as a function of total assets. WSEAS Transactions on Business and Economics, 15(29), 301–310.
- Jung, S., & Kwak, G. (2018). Firm characteristics, uncertainty and research and development (R&D) investment: The role of size and innovation capacity. Sustainability, 10(5), 1668.
- Kaplan, R. S., & Norton, D. P. (2005). The balanced scorecard: Measures that drive performance. Harvard Business Review, 83(7), 172.
- Kaplan, R. S., & Norton, D. P. (1992). The balanced scorecard – Measures that drive performance. Harvard Business Review, 70(1), 71–79.
- Kaplan, R. S., & Norton, D. P. (1996). Using the balanced scorecard as a strategic management system. Harvard Business Review, 74(1), 75–76.
- Kaplan, R. S., & Norton, D. P. (2004). Strategy maps: Converting intangible assets into tangible outcomes. Boston, MA: Harvard Business School Press.
- Khan, M. H. U. Z., Halabi, A. K., & Sartorius, K. (2011). The use of multiple performance measures and the balanced scorecard (BSC) in Bangladeshi firms. Journal of Accounting in Emerging Economies, 1(2), 160.
- Khatin, K. N., Anjaswara, B., & Utami, S. R. (2016). The effect of return on asset, current ratio, price-to-earnings ratio, and stock price on sustainable growth rate of firms in business-27 index and Sri Kehati Index in Indonesia Stock Exchange. International Journal of Advanced Research in Management and Social Sciences, 5(8), 130–144.
- Kim, S. H., & Taylor, D. (2014). Intellectual capital vs. the book value of assets: a value-relevance comparison based on productivity measures. Journal of Intellectual Capital, 15 (1), 65–82.
- Kollberg, B., & Elg, M. (2011). The practice of the balanced scorecard in health care services. International Journal of Productivity and Performance Management, 60(5), 427–445.
- Kožená, M., & Chládek, T. (2012). Company competitiveness measurement depending on its size and field of activities. Procedia-Social and Behavioral Sciences, 58, 1085–1090.
- Krishnan, H. A., Tadepalli, R., & Park, D. (2009). R&D intensity, marketing intensity, and organizational performance. Journal of Managerial Issues, 21(2), 232–244.
- Krizanova, A., Lăzăroiu, G., Gajanova, L., Kliestikova, J., Nadanyiova, M., & Moravcikova, D. (2019). The effectiveness of marketing communication and importance of its evaluation in an online environment. Sustainability, 11(24), 7016.
- Lantz, J. S., & Sahut, J. M. (2005). R&D investment and the financial performance of technological firms. International Journal of Business, 10(3), 251.
- Lee, P. M., & O'Neill, H. M. (2003). OOwnership structures and R&D investments of U.S. and Japanese firms: agency and stewardship perspectives. Academy of Management Journal, 46(2), 212–225. 10.2307/30040615.
- Lee, B., Tsui, A. S. C., & Yau, O. H. M. (2019). Higher-order goals, trust-in-leader, and self-efficacy as moderators of transformational leadership performance: The case of multi-level marketing organizations in China. Journal of Euromarketing, Vo, 28(3–4), 76–97.
- Li, X., Krumholz, H. M., Yip, W., Cheng, K. K., De Maeseneer, J., Meng, Q., … Zhang, Q. (2020). Quality of primary health care in China: Challenges and recommendations. The Lancet, 395(10239), 1802–1812.
- Lin, C., Lin, P., Song, F. M., & Li, C. (2011). Managerial incentives, CEO characteristics, and corporate innovation in China’s private sector. Journal of Comparative Economics, 39(2), 176–190.
- Liu, C., & Xia, G. (2018). Research on the dynamic interrelationship among R&D investment, technological innovation, and economic growth in China. Sustainability, 10(11), 4260.
- Ma, X. (2019). Impact of leverage buyouts on target companies (Doctoral dissertation). Massachusetts Institute of Technology.
- Manville, G., Karakas, F., Polkinghorne, M., & Petford, N. (2019). Supporting open innovation with the use of a balanced scorecard approach: A study on deep smarts and effective knowledge transfer to SMEs. Production Planning & Control, 30(10–12), 842–853.
- Marshall, W. M. (2002). Rethinking performance measurement: Beyond the balanced scorecard. Cambridge: Cambridge University Press.
- Martin, S. L., Javalgi, R. R. G., & Ciravegna, L. (2020). Marketing capabilities and international new venture performance: The mediation role of marketing communication and the moderation effect of technological turbulence. Journal of Business Research, 107, 25–37.
- Meesala, A., & Paul, J. (2018). Service quality, consumer satisfaction, and loyalty in hospitals: Thinking for the future. Journal of Retailing and Consumer Services, 40, 261–269.
- Memarista, G., & Gestanti, L. (2018). Sunk Cost dilemma behavior: The contribution of marketing expenses towards financial performance. Jurnal Keuangan Dan Perbankan, 22(4), 625–642.
- Meyer, M. W. (2003). Rethinking performance measurement: Beyond the balanced scorecard. Cambridge: Cambridge University Press.
- Miller, D., & Shamsie, J. (2001). Learning across the life cycle: Experimentation and performance among the Hollywood studio heads. Strategic Management Journal, 22(8), 725–745.
- Miller, S. M., Kim, J., & Lim, D. H. (2020). “Everybody needs everyone”: A case study of workplace learning after a downsize. European Journal of Training and Development, 44(2/3), 159–170.
- Mio, C., Costantini, A., & Panfilo, S. (2022). Performance measurement tools for sustainable business: A systematic literature review on the sustainability balanced scorecard use. Corporate Social Responsibility and Environmental Management, 29(2), 367–384.
- Mishra, S., & Ewing, M. T. (2020). Financial constraints and marketing investment: Evidence from text analysis. European Journal of Marketing, 54(3), 525–545.
- Mohd–Saleh, N., Mohd–Sanusi, Z., Abd–Rahman, R., & Bukit, R. (2012). Firm performance, CEO tenure, and corporate governance reporting in Malaysia. International Journal of Management Practice, 5(2), 170–189.
- Molleman, B. (2007). The challenge of implementing the Balanced Scorecard [Paper presentation]. The proceedings of the 6th Twente Student Conference on IT, Enschede, 2nd February.
- Mwangi, P. G. (2019). Does top management team heterogeneity pay? International Journal of Humanities and Social Science, 9(4), 54–60.
- Mwangi, P. G., Awino, Z. B., Ogollah, K. O., & Pokhariyal, G. P. (2021). Competitive repertoire complexity: A potential mediator in the upper Echelons propositions? International Journal of Business and Management, 13(10), 1–83.
- Namazi, M. (2016). Emergence of the time-driven activity-based costing. International Review of Management and Business Research, 5(3), 1008–1020.
- Nariswari, T. N., & Nugraha, N. M. (2020). Profit growth: Impact of net profit margin, gross profit margin, and total assets turnover. International Journal of Finance & Banking Studies (2147-4486, )9(4), 87–96.
- Niman, N. B. (2004). The evolutionary firm and Cournot’s dilemma. Cambridge Journal of Economics, 28(2), 273–289.
- Ozcan, Y. A. (2008). Health care benchmarking and performance evaluation: An assessment using data envelopment analysis (DEA). New York, NY: Springer Science Business Media.
- Pan, Y., Wang, T. Y., & Weisbach, M. S. (2015). Learning about CEO ability and stock return volatility. The Review of Financial Studies, 28(6), 1623–1666.
- Park, K., & Jang, S. S. (2013). Capital structure, free cash flow, diversification and firm performance: A holistic analysis. International Journal of Hospitality Management, 33, 51–63.
- Patience, G. S., & Boffito, D. C. (2020). Distributed production: Scale‐up vs experience. Journal of Advanced Manufacturing and Processing, 2(2), e10039.
- Preacher, K. J., Rucker, D. D., & Hayes, A. F. (2007). Addressing moderated mediation hypotheses: Theory, methods, and prescriptions. Multivariate Behavioral Research, 42(1), 185–227.
- Ptok, A., Jindal, R. P., & Reinartz, W. J. (2018). Selling, general, and administrative expense (SGA)-based metrics in marketing: Conceptual and measurement challenges. Journal of the Academy of Marketing Science, 46(6), 987–1011.
- Pushpa Bhatt, P., & Sumangala, J. K. (2012). Impact of earnings per share on market value of an equity share: An empirical study in Indian capital market. Journal of Finance, Accounting & Management, 3(2), 1–14.
- Quo, B., Wang, Q. Z., & Shou, Y. Y. (2004). Firm size, R&D, and performance: An empirical analysis on software industry in China. 2004 IEEE International Engineering Management Conference (IEEE Cat. No. 04CH37574), 2, 613–616.
- Rashwan, H. H. M., Mansi, A. L. M., & Hassan, H. E. (2019). The impact of the E-CRM (expected security and convenience of website design) on E-loyalty field study on commercial banks. Journal of Business and Retail Management Research, 14(1), 102–122.
- Ravselj, D., & Aristovnik, A. (2019). The impact of R&D accounting treatment on firm’s market value: Evidence from Germany. The Social Sciences, 14(6), 247–254.
- Ravšelj, D., & Aristovnik, A. (2020). The impact of public R&D subsidies and tax incentives on business R&D expenditures. International Journal of Economics and Business Administration, 8(1), 160–179.
- Rigby, D., & Bilodeau, B. (2015). Management tools & trends 2015. Retrieved from https://www.bain.com/contentassets/f8361c5cd99e4f40bbbf83c17d6a91b9/bain_brief-management_tools_and_trends.pdf.
- Rouse, P., & Putterill, M. (2003). An integral framework for performance measurement. Management Decision, 41(8), 791–805.
- Russo, J., & Martins, A. (2005). The Balanced Scorecard in SMEs: The case of plastic industry in the Portuguese Central Region [Paper presentation]. Trabajo presentado en AOEF 2005 Conference. Recuperado de http://joaorusso.com.sapo.pt/AOEFo5fulltext.pdf.
- Said, A. A., HassabElnaby, H. R., & Wier, B. (2003). An empirical investigation of the performance consequences of nonfinancial measures. Journal of Management Accounting Research, 15(1), 193–223.
- Sannino, G., Di Carlo, F., & Lucchese, M. (2020). CEO characteristics and sustainability: A business model in financial technologies firms. Management Decision, 58(8), 1779–1799. (2020 doi:10.1108/MD-10-2019-1360
- Sardana, D., Gupta, N., Kumar, V., & Terziovski, M. (2020). CSR ‘sustainability’ practices and firm performance in an emerging economy. Journal of Cleaner Production, 258, 120766.
- Schuster, C. L., Nicolai, A. T., & Covin, J. G. (2020). Are founder-led firms less susceptible to managerial myopia?. Entrepreneurship Theory and Practice, 44(3), 391–421.
- Schwartz, L., Miller, R., Plummer, D., & Fusfeld, A. R. (2011). Measuring the effectiveness of R&D. Research-Technology Management, 54(5), 29–36.
- Seo, H. S., & Kim, Y. (2020). Intangible assets investment and firms’ performance: Evidence from small and medium-sized enterprises in Korea. Journal of Business Economics and Management, 21(2), 421–445.
- Sharma, J. K., & Husain, S. (2015). Marketing expenses & profitability: Evidence from the telecom sector in the Kingdom of Saudi Arabia. Marketing, 7(35), 69–70.
- Sharma, P., Davcik, N. S., & Pillai, K. G. (2016). Product innovation as a mediator in the impact of R&D expenditure and brand equity on marketing performance. Journal of Business Research, 69(12), 5662–5669.
- Shen, W., & Cannella, A. A. Jr. (2002). Power dynamics within top management and their impacts on CEO dismissal followed by inside succession. Academy of Management Journal, 45(6), 1195–1206.
- Shih-Jen, K. H., & Kidwell, L. A. (2000). A survey of management techniques implemented by municipal administrators. The Journal of Government Financial Management, 49(1), 46. 675.
- Silberzahn, C., & Arregle, J. L. (2019). The career-horizon problem in capital investments for lone-founder and long-tenure acquirer CEOs in their final career stage. Strategic Organization, 17(3), 334–362.
- Simsek, Z. (2007). CEO tenure and organizational performance: An intervening model. Strategic Management Journal, 28(6), 653–662.
- Souder, D., Simsek, Z., & Johnson, S. G. (2012). The differing effects of agent and founder CEOs on the firm’s market expansion. Strategic Management Journal, 33, 23–41.
- Špacek, M., & Vacík, E. (2016). Company value creation through effective innovation process management. Journal of Innovation Management, 4(3), 65–78.
- Spiller, R. (2000). Ethical business and investment: A model for business and society. Journal of Business Ethics, 27(1–2), 149–160.
- Tihanyi, L., Ellstrand, A. E., Daily, C. M., & Dalton, D. R. (2000). Composition of the top management team and firm international diversification. Journal of Management, 26(6), 1157–1177.
- Traina, J. (2018). Is aggregate market power increasing? Production trends using financial statements [Paper presentation]. Production Trends Using Financial Statements. New Working Paper, Series No. 17. The University of Chicago.
- Trif, S. M., Duțu, C., & Tuleu, D. L. (2019). Linking CRM capabilities to business performance: A comparison within markets and between products. Management & Marketing. Challenges for the Knowledge Society, 14(3), 292–303.
- Tse, A. C., Sin, L., Yau, O. H. M., Lee, J., & Chow, R. (2003). Market orientation and business performance in a Chinese business environment. Journal of Business Research, 56(3), 227–239.
- Tsui, A. S. C., & Lee, B. (2018). Higher-order goals, trust-in-leader, and self-efficacy as mediators of transformational leadership performance: The case of multi-level marketing organizations in China. Journal of Information Technology Applications and Management, 25(4), 79–114.
- Tsui, A. S. C., Lee, B., & Yau, O. H. M. (2022). The impact of executive board gender diversity, R&D investment, marketing expenses on company performance in the healthcare industry. Journal of Transnational Management, 21(1), 3–36.
- Tuan, T. T. (2020). The impact of balanced scorecard on performance: The case of Vietnamese commercial banks. The Journal of Asian Finance, Economics and Business, 7(1), 71–79.
- Tuli, K. R., Mukherjee, A., & Dekimpe, M. G. (2012). On the value relevance of retailer advertising spending and same-store sales growth. Journal of Retailing, 88(4), 447–461.
- Vaid, S., Ahearne, M., & Krause, R. (2021). Operations‐related structural flux: Firm performance effects of executives’ appointments and exits. Production and Operations Management, 30(7), 2188–2210.
- Vaona, A., & Pianta, M. (2008). Firm size and innovation in European manufacturing. Small Business Economics, 30(3), 283–299.
- Walters, D., & Rainbird, M. (2007). Strategic Operations Management - A Value Chain Approach. London, Palgrave Macmillan.
- Wang, H., Tsui, A. S., & Xin, K. R. (2011). CEO leadership behaviors, organizational performance, and employees’ attitudes. The Leadership Quarterly, 22(1), 92–105.
- Wang, Y., Du, R., Koong, K. S., & Fan, W. (2017). Effects of R&D policy choice on accounting performance and market value. R&D Management, 47(4), 545–556.
- Wolfe, J., & Sauaia, A. C. A. (2003). The Tobin q as a company performance indicator [Paper presentation]. Developments in Business Simulation and Experiential Learning: Proceedings of the Annual ABSEL Conference (Vol. 30).
- World Health Organization. (2018). A vision for primary health care in the 21st century: Towards universal health coverage and the Sustainable Development Goals (No. WHO/HIS/SDS/2018.15). Geneva: World Health Organization.
- Wu, S., Levitas, E., & Priem, R. L. (2005). CEO tenure and company invention under differing levels of technological dynamism. Academy of Management Journal, 48(5), 859–873. doi:10.5465/amj2005.18803927.
- Xiong, Z., Wang, P., & Zhao, Y. (2020). Re-innovation from failure, institutional environmental differences, and firm performance: evidence from China. Anfiteatro Economic, 22(53), 197–219.
- Yan, M. R., Wang, C. H., Flores, N. J. C., & Su, Y. Y. (2019). Targeting open market with strategic business innovations: A case study of growth dynamics in essential oil and aromatherapy industry. Journal of Open Innovation: Technology, Market, and Complexity, 5(1), 7.
- Yip, W., Fu, H., Chen, A. T., Zhai, T., Jian, W., Xu, R., … Mao, W. (2019). 10 Years of healthcare reform in China: Progress and gaps in universal health coverage. The Lancet, 394(10204), 1192–1204.
- Yoo, J., Lee, S., & Park, S. (2019). The effect of the firm life cycle on the relationship between R&D expenditures and future performance, earnings uncertainty, and sustainable growth. Sustainability, 11(8), 2371.
- Yue, C., Liu, C., Wang, J., Zhang, M., Wu, H., Li, C., & Yang, X. (2021). Association between social support and anxiety among pregnant women in the third trimester during the coronavirus disease 2019 (COVID-19) epidemic in Qingdao, China: The mediating effect of risk perception. International Journal of Social Psychiatry, 67(2), 120–127.
- Zelman, W. N., Pink, W. G., & Matthias, C. B. (2003). Using balanced scorecard in health care. Journal of Health Care Finance, 29(4), 1–16.
- Zhang, Y., & Jia, Y. (2020). A discriminant analysis of the financial indicators of innovative pharmaceutical enterprises. E&ES, 440(2), 022039.
- Zhang, Y., Wang, Q., Jiang, T., & Wang, J. (2018). Equity and efficiency of primary health care resource allocation in mainland China. International Journal for Equity in Health, 17(1), 1–12.
- Zheng, W., Shen, R., Zhong, W., & Lu, J. (2020). CEO values, firm long-term orientation, and firm innovation: Evidence from Chinese manufacturing firms. Management and Organization Review, 16(1), 69–106.
- Zhijun, L. I. N., Zengbiao, Y. U., & Zhang, L. (2014). Performance outcomes of balanced scorecard application in hospital administration in China. China Economic Review, 30, 1–15.
- Zhu, H., Zhao, S., & Abbas, A. (2020). Relationship between R&D grants, R&D investment, and innovation performance: The moderating effect of absorptive capacity. Journal of Public Affairs, 20(1), 1–10, e1973. doi:10.1002/pa.1973Accessed on 15 October 2020.
- Zhu, Z., Zhu, Z., Xu, P., & Xue, D. (2019). Exploring the impact of government subsidy and R&D investment on financial competitiveness of China’s new energy listed companies: An empirical study. Energy Reports. 5, 919–925.