
 ?Mathematical formulae have been encoded as MathML and are displayed in this HTML version using MathJax in order to improve their display. Uncheck the box to turn MathJax off. This feature requires Javascript. Click on a formula to zoom.
ABSTRACT
We report a high-sensitivity cell secretome detection method using competitive immuno-aggregation and a micro-Coulter counter. A target cell secretome protein competes with anti-biotin-coated microparticles (MPs) to bind with a biotinylated antibody (Ab), causing decreased aggregation of the functionalized MPs and formation of a mixture of MPs and aggregates. In comparison, without the target cell secretome protein, more microparticles are functionalized, and more aggregates are formed. Thus, a decrease in the average volume of functionalized microparticles/aggregates indicates an increase in cell secretome concentration. This volume change is measured by the micro-Coulter counter, which is used to quantitatively estimate the cell secretome concentration. Vascular endothelial growth factor (VEGF), one of the key cell secretome proteins that regulate angiogenesis and vascular permeabilization, was used as the target protein to demonstrate the sensing principle. A standard calibration curve was generated by testing samples with various VEGF concentrations. A detection range from 0.01 ng/mL to 100.00 ng/mL was achieved. We further demonstrated the quantification of VEGF concentration in exogenous samples collected from the secretome of human mesenchymal stem cells (hMSCs) at different incubation times. The results from the assay agree well with the results of a parallel enzyme-linked immunoabsorbent assay (ELISA) test, indicating the specificity and reliability of the competitive immuno-aggregation assay. With its simple structure and easy sample preparation, this assay not only enables high sensitivity detection of VEGF but also can be readily extended to other types of cell secretome analysis as long as the specific Ab is known.
INTRODUCTION
The cell secretome, which contains multiple cell-secreted proteins, plays an important role in cell signaling and matrix remodeling. Quantitative detection of cell-secreted proteins has huge potential in disease diagnosis and therapeutic applications. Among the cell secretome proteins, vascular endothelial growth factor (VEGF) is one of the key regulators of angiogenesis and vascular permeabilization.Citation1,Citation2 VEGF is often used as a biomarker to quantify clinical stagesCitation3-Citation7 and therapeutic efficacy.Citation8-Citation11 In the clinic, elevated VEGF serum concentrations correlate with various cancers,Citation12-Citation17 while abnormal VEGF concentrations have been found in patients with Alzheimer's disease.Citation7,Citation18,Citation19 VEGF is typically measured in serum,Citation14,Citation17 tissue,Citation13,Citation15 cell secretome,Citation20,Citation21 and cyst fluid,Citation13,Citation17 where its concentration varies by several hundred fold (from pg/mL to ng/mL).Citation22 On the other hand, the VEGF level within cell culture has been used to study the survival,Citation23,Citation24 proliferation,Citation25-Citation27 and differentiationCitation28-Citation31 of cells and has potential applications in cell therapy.Citation32-Citation34 Thus, quantification of secreted VEGF protein and other cell secretome proteins with high sensitivity and a wide dynamic range is needed for both clinical and research studies.
Various analytical methods have been successfully used for the study of VEGF, including western blot,Citation35 immunohistochemistry,Citation36 and enzyme-linked immunosorbent assay (ELISA).Citation37 To date, ELISA has remained the most widely used method for measuring specific macromolecules, including cell-secreted proteins, biomarkers, and DNA.Citation38-Citation43 ELISA is based on a series of reactions that capture a target protein, bind the specific enzyme-linked antibody (Ab) to the protein, and label the enzyme to create detectable signals (i.e., color change). A specific protein can be identified and quantified from the measured signals. To generate detectable signals with high specificity, ELISA typically requires multiple washing steps, complex external optical components, and highly trained personnel. Moreover, most ELISA kits have a relatively narrow detection range (∼3 orders) due to the limited extent of enzyme conjugation and require extra dilution steps. Recently, immunoassays including Luminex,Citation44-Citation46 surface plasmon resonance imaging (SPRI),Citation47 surface-enhanced Raman scattering (SERS),Citation48-Citation50 and electrochemical assaysCitation36-Citation38 were also developed for VEGF detection. Although these methods have achieved similar sensitivity as traditional ELISA, they still require fluorescent tags, complex optical components or surface modifications, which limit their applications in resource-poor areas.
To overcome the above limitations, we introduce a microfluidic assay based on competitive immuno-aggregation for high-sensitivity cell secretome detection by measuring the average volume change of microparticle (MP) aggregates induced by a specific cell secretome protein. The volume change can be accurately detected using a micro-Coulter counter. With easy sample preparation steps and simple sensor structure, this method is capable of general cell secretome detection yet with a wide dynamic range and high sensitivity.
RESULTS
Sensing principle of competitive immuno-aggregation assay
We used a target protein (i.e., VEGF) to validate the detection concept. As shown in , in the absence of VEGF, MPs functionalized with biotinylated VEGF Ab form aggregates via biotin-streptavidin (SA) specific binding. Hence, the average volume of all particles/aggregates within the solution increases once SA is added. However, when VEGF is added, the VEGF protein competes with anti-biotin MPs to bind biotinylated VEGF Ab during the conjugation process, leading to decreased aggregation of the MPs (see ). Higher sample concentrations of VEGF result in the formation of fewer aggregates and a decrease in the average volume of particles/aggregates.
FIGURE 1. Schematic of the sensing principle of the competitive immuno-aggregation assay. A) In the absence of VEGF, microparticles (MPs) functionalized with biotinylated VEGF antibody (Ab) form aggregates via biotin-streptavidin (SA) specific binding. Hence, the average volume of all particles/aggregates within the solution increases once SA is added. B) When VEGF is added, the VEGF protein competes with the anti-biotin MPs to bind biotinylated VEGF Ab during the conjugation process, leading to decreased aggregation of the MPs. C) The average particle/aggregate volume can be accurately detected by the micro-Coulter counter. The average volume of all particles/aggregates from each sample can be used to estimate the VEGF concentration.
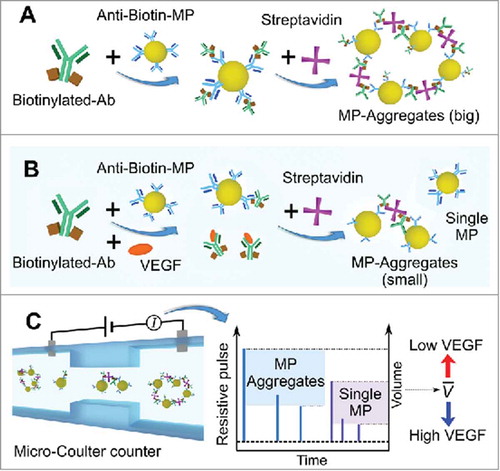
After the competitive binding reaction, the average particle/aggregate volume can be accurately detected by the micro-Coulter counter (see ). According to the Coulter counting principle,Citation65,Citation66 when a microparticle flows through a sensing channel and displaces some of an electrolyte, the current flow through the channel decreases, and a voltage pulse can be measured. The pulse width and the pulse height indicate the transit time and volume of a particle, respectively. Continuous measurement of the pulses from each loaded sample allows the calculation of the average volume of all particles/aggregates, from which the VEGF concentration can be estimated.
Device calibration
To ensure that the micro-Coulter counter can accurately detect the size and concentration of the loaded particles/aggregates, we calibrated the device with standard polystyrene MPs and the anti-biotin-MPs. The standard polystyrene MPs (78452 and 79633, Sigma-Aldrich) were suspended in 1X PBS buffer and tested with the device. The measured particles diameters were 1.97 ± 0.06 µm and 4.96 ± 0.18 µm, which agree well with the manufacturer's sizes of 2.00 ± 0.05 µm and 5.00 ± 0.10 µm, respectively. This indicates the high accuracy of the micro-Coulter counter in terms of particle size/volume measurement.
Additionally, to confirm that the micro-Coulter counter can accurately detect the MPs used for aggregation, we tested both the size and concentration of the pure anti-biotin-MPs (negative control group) on the device. The same number of single MPs (5 × 10⁴) and the same volume of final suspension (50 µL) were used for all the experiments. We set the particle concentration at 1000 counts/µL for the negative control groups and tested them on the device. The measured particle concentration was 1002 ± 40 counts/µL, indicating that the particles passing through the sensing channel were accurately counted. Additionally, from the measured particle diameter, we calculated the average volume of the negative control groups to be 19.59 ± 0.59 µm3. Note that based on the dimensions of the counting channel (100 µm long, 35 µm deep, and 30 µm wide), the volume of the sensing channel is calculated to be 0.12 nL. Given the maximum sample concentration (200 particles/µL) in our tests, there was one particle in the 5 nL fluid volume on average. The number of particles/aggregates was further decreased after aggregate formation. Hence, the probability of multiple particles/aggregates passing through one sensing channel at the same time was very low.
Development of competitive immuno-aggregation assay
As shown in , the design principle of our competitive immuno-aggregation assay is based on creating an inverse relationship between the degree of MP aggregation and protein target concentration. First, the anti-biotin functionalized MPs were reacted with biotinylated VEGF Ab, and we added SA protein to induce MP aggregation through the specific biotin-SA interaction (). We found the optimum concentration of SA that resulted the maximum number of MP aggregates and used that concentration to develop the competitive immuno-aggregation assay (Figure S-7 in the Supporting Information). The competitive immunoreaction occurs during the biotinylated VEGF Ab (∼ 150.977 kDa) conjugation step. When the target VEGF protein (∼ 19.2 kDa) is added, the biotinylated Abs compete to bind with the protein targets and anti-biotin MPs at the same time. The binding of the target protein to Abs increases the overall size of the Abs, resulting in the masking of the conjugated biotin molecules. Previous studies demonstrated that increasing the size of biotinylated macromolecules lowered the binding capacity and binding rate between the available biotin molecules and SA protein.Citation54,Citation55 Because of this phenomenon, the available number of Abs that are conjugated with the MPs will decrease and therefore reduce the volume of MP aggregates in the samples (). Notably, during our assay development, we chose the minimum concentration of VEGF Abs that provided the maximum conjugation efficiency (Table S-1 in Supporting Information). This step was critical to achieve maximal MP aggregation in the positive control while avoiding excess unbound Ab that could potentially quench the target protein during the conjugation procedure. From our calculation, each MP in the positive control was conjugated with ∼1.65 × 10⁷ biotinylated VEGF Abs, which correspond to ∼6.6 × 10⁷ biotin molecules on the surface. To validate the design concept of the competitive immuno-aggregation assay, we tested the negative control group (anti-biotin-MPs conjugated with biotinylated VEGF Ab only), positive control group (MPs mixed with biotinylated Ab and SA), and one competitive aggregation group containing a VEGF sample at 12.00 ng/mL (MPs mixed with biotinylated Ab, VEGF protein, and SA). After the reactions, we took microscopic images of the particles/aggregates (as shown in ) and measured the average volume of the particles () in each group using the micro-Coulter counter device. For the negative control group without SA, only single MPs can be found (). In comparison, for the positive control group, adding SA to bind with the Ab-functionalized MPs led to nearly all single MPs aggregating () due to non-competitive aggregation. Moreover, when VEGF protein was introduced, a mixture of both single MPs and small aggregates was observed () because of competitive aggregation. We measured three independent MP samples for each tested group. Our results showed that ∼92% of MPs formed aggregates in the positive control group during the conjugation process. Among the formed aggregates, ∼59% of the MP aggregates contained more than 2 MPs per aggregate. After the target VEGF protein was added, ∼67% of MPs formed aggregates in the competitive immuno-aggregation group (with a VEGF concentration of 12.00 ng/mL).
Validation of microfluidic immuno-aggregation assay
For each group (as shown in ), we 1) measured the resistive pulse generated by individual particles/aggregates when they passed through the sensing channel using the micro-Coulter counter and 2) calculated the volume of each particle/aggregate from the pulse amplitude, followed by calculation of the average volume of all particles/aggregates from each group. The result is shown in . The lowest average volume was from the negative control group, while the highest average volume was achieved in the positive control group (non-competitive aggregation). As shown in , the average volumes for the negative control, positive control and 12.00 ng/mL VEGF groups were 19.59 ± 0.59 µm3, 40.05 ± 0.54 µm3 and 29.48 ± 0.56 µm3, respectively. Therefore, measuring the average volume of the sample enabled quantitative estimation of the competitive immuno-aggregation effect.
Next, we tested standard VEGF samples with known concentrations ranging from 0.01 ng/mL to 100.00 ng/mL. For each VEGF concentration, three independent samples were tested for the experiment groups. With the same batch, three positive control samples were also measured and used as a reference. From the testing results, the average volume of all the positive control groups was 40.05 ± 0.54 µm3; the standard deviation was caused by the slightly different room temperatures between batches. To compensate for batch-to-batch variance, we used the normalized volume change to assess the relative average volume changes induced by competitive aggregation, which is defined as:
The normalized volume change with various VEGF concentrations was calculated using equation 1 (black scatter points in ), indicating an injective relationship between the measured normalized volume change and the VEGF concentration. Each error bar indicates the standard deviation from three repeats of the same concentration. A standard curve (red curve) were fitted to the scatter points using the following sigmoidal function:
The coefficient of determination (R2 ) of the curve fitting is 0.9964. With this standard curve, VEGF concentrations ranging from 0.01 to 100.00 ng/mL can be estimated. Compared to a conventional ELISA kit for VEGF, this assay achieved a much wider dynamic range (∼5 orders: 10−2 to 102 ng/mL). This wide dynamic range is attributed to two reasons: 1) the high sensitivity of the competitive strategy because of the high binding reaction rate between VEGF and the biotinylated VEGF Ab. Theoretically, Abs with higher binding affinity will result in the strong binding with the target and hence high sensitivity and specificity. The equilibrium dissociation constant of the binding between VEGF and VEGF Ab was reported to be 9.94 pMCitation56 The commercial VEGF Abs have comparable binding affinities; 2) the high binding capacity of the MPs because of their large surface-to-volume ratio. Additionally, in contrast to the non-competing aggregation method,Citation57,Citation58 this assay generated a monotonic standard curve without any saturation effect; i.e., when the target protein saturated and blocked the surface of the MPs, fewer aggregates can be formed with the blocked microparticles.Citation57,Citation58 Thus, for the competitive immuno-aggregation method, the corresponding VEGF concentration and the average volume change of aggregates/particles forms an injective relation. The detection limit of this method (0.01 ng/mL) was also lower than that (0.1 ng/mL) of the non-competing aggregation method. Furthermore, the maximum sensitivity of the current method (7.84%/(ng/mL)) and (4.27%/(ng/mL)) in the measurement range from 0.1 ng/mL to 1 ng/mL and that from 1 ng/mL to 10 ng/mL, respectively, are several times higher than that of the non-competitive aggregation method (2.15%/(ng/mL)) and (1.07%/(ng/mL)) in the same measurement ranges. The higher sensitivity was achieved because of the competitive immunobinding of free floating biotinylated Abs by the target VEGF protein, which requires a small amount of target proteins to trigger the change in the status of MP aggregation. In this study, the normalized volume was decreased to ∼40%, which allows us to suitably measure VEGF at various concentrations found in the cell secretome. However, owing to the use of mild reaction conditions (temperature at 25 °C and pH at 7.2), the formed aggregates consisted of 2∼3 MPs (i.e., 2.59 ± 0.25 MPs/aggregate on average from our measurements) instead of 4 MPs (the theoretical maximal number of MPs per aggregate). This led to a reduced range of the normalized volume in the standard curve (), although the mild conditions can avoid potential negative effects on proteins (e.g., denaturation and conformation change). If a larger range of volume decrease is needed in future applications, it could be achieved by either tuning the reaction conditions to reach maximal aggregation or enlarging the volume ratio of the maximal aggregates to individual MP.
Cell secretome detection demonstration
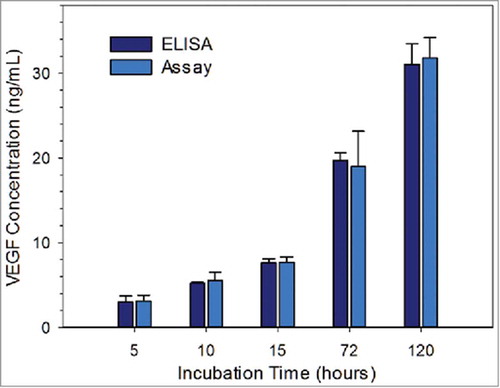
VEGF is a vital biomarker secreted by hMSCs during cell proliferation and differentiation; therefore, accurate detection of secreted VEGF can greatly facilitate cell status monitoring for stem cell study. To demonstrate the feasibility of the competitive immuno-aggregation assay for cell secretome detection, cell secretome samples were collected from cultured hMSCs at different incubation times (5, 10, 15, 72, and 120 hours). Parallel analysis of the collected samples was conducted with both a commercial ELISA kit and the competitive immuno-aggregation assay.
The VEGF concentrations were back-calculated from the standard curve (red curve in ) using the fitted function (equation 2). The concentrations calculated from the assay were plotted as light blue bars, which agree well with the ELISA results (dark blue bars). We also conducted Student's t-test on both methods. The results, which are summarized in Table S-3 in the Supporting Information, show no statistically significant difference between the corresponding VEGF protein concentrations. This indicated the reliability of the assay for detecting VEGF in an endogenous environment owing to the high sensitivity of the competitive immuno-aggregation strategy and high specificity of the Ab. Note that the error bars indicate the standard deviations of the results from different groups. For long-term cell culture, the differences are more obvious, as shown by the relatively larger error bars after 72 hours of incubation. Notably, the assay can be easily adapted to other cell secretome detection applications by simply changing the biotinylated Ab.
Here, we used VEGF as a model target protein found in the cell secretome to demonstrate the unique application of our assay to cell secretome analysis. The measured VEGF concentrations in the cell secretome (as shown in ) signify some of the common challenges in current cell secretome analysis the target protein expression is very sensitive to the stimulation that cells received, and the concentration range of the target protein is wide. When hMSCs were seeded on a biological scaffold, VEGF at a very low concentration was found in the cell secretions five hours after the seeding. The concentration of VEGF increased 10-fold after 5 days of culture on the biological scaffold. This dynamic VEGF expression profile is difficult to capture using currently available protein detection assays, which either have high sensitivity for the detection of low concentration protein but with a limited detection range or can detect a broad range of protein concentration with a relatively high lower detection limit. When applied to the cell secretome, our competitive immuno-aggregation assay could accurately measure the target protein with concentrations ranging from 0.01 to 100.00 ng/mL, which covers the known concentration range of proteins in the cell secretome.Citation59,Citation60 Moreover, the high specificity of our assay was confirmed by the results from the cell secretome detection experiments, where our assay could accurately detect and measure the target protein in a complicated cell culture medium environment containing numerous serum proteins and growth factors. In addition, our assay does not need sample pretreatments such as dilution or concentration and requires minimal sample volume (50 µL per test) for analysis. Nevertheless, previous work from our group demonstrated that multiple micro-Coulter counters can be integrated within a single device.Citation61–Citation64 Thus, there is a huge potential to expand this assay to simultaneous detection of multiple cell secretome samples with a much higher throughput.
DISCUSSION
In this study, we used VEGF as a model cell secretome protein to validate the feasibility of our detection concept. Our design principle involves the concept of competitive immuno-reaction to create an inverse relationship between the degree of MP aggregation and target protein. Specifically, without the presence of VEGF protein, MPs functionalized with biotinylated VEGF Ab form aggregates via biotin-streptavidin interaction which increases the average volume of all particles/aggregates within the mixture. However, when VEGF is added, the VEGF protein competes with anti-biotin MPs to bind biotinylated VEGF Ab during the conjugation process, leading to decreased aggregation of the MPs. The higher the concentration of target VEGF protein, the lower the average volume of MP aggregates and vice versa. After the competitive binding reaction, the average particle/aggregate volume was accurately detected with a micro-Coulter counter device.
Note that in our previously reported work, a biomarker detection device using the concept of immuno-aggregation was demonstrated.Citation57 In that work, the target biomarker was used as a linker that binds single antibody-functionalized MPs (Ab-MPs) and forms aggregated doublets or triplets. Higher target protein concentrations result in a greater fraction of single MPs that are aggregated. To enable the immuno-aggregation based biomarker detection, the size distribution of the aggregates must be clearly distinguished from that of single MPs. Instead of the target protein directly binding with the MPs, with the competitive immuno-aggregation strategy, the target protein was recognized by binding with free floating biotinylated Ab, and the reduction in Ab level was quantified from the decrease in aggregate volume. Therefore, the competitive immuno-aggregation method presented in this paper has three major advantages: 1) this method has a lower detection limit (0.01 ng/mL) than the method in our previous work.Citation57,Citation58 This is because our previous study used non-competitive molecular binding between recognition biomolecules and target proteins. Non-competitive binding usually requires a large amount of target proteins to initiate the formation of MP aggregates, which could compromise the sensitivity of the assay. In contrast, the competitive binding strategy requires a small amount of target proteins to trigger the change in MP aggregate volume. Therefore, the current approach based on a competitive immunoreaction could enable higher sensitivity, thereby facilitating the detection of low concentrations of molecular targets. Other recent studiesCitation67,Citation68 have also demonstrated similar trends; 2) this method is compatible with general cell secretome detection, especially for small proteins or proteins with only one epitope, which can barely/cannot bind with two or more Ab-MPs at the same time to form aggregates directly; 3) this method allows us to use any MPs without restriction on the particle size distribution (MPs with ultrahigh size uniformity must be used in previous work), which significantly broadens the selection of MPs and improves the assay compatibility.
In conclusion, we presented a new competitive immuno-aggregation assay for cell secretome detection. The presence and concentration of VEGF in a sample can be easily detected by measuring the average volume change induced by VEGF via a microfluidic device. We first obtained a standard curve of the average volume change as the VEGF concentration varied from 0.01 to 100.00 ng/mL. The dynamic range of the measurements is significantly improved compared to that of a traditional ELISA kit. Next, we tested endogenous VEGF proteins collected from hMSC secretome at different incubation times. The results of this assay and a commercial ELISA test performed in parallel were comparable, indicating the feasibility and reliability of this method for real cell secretome detection applications. The competitive immuno-aggregation method offers high sensitivity owing to the high binding reaction rate between VEGF and the biotinylated VEGF Ab, which could be especially powerful for small target proteins or proteins with only one epitope. In addition, using an Ab with high specificity and MPs with high binding capacity allowed accurate detection of VEGF in exogenous samples with a wide detection range to be achieved. With its high sensitivity for detecting low-concentration protein and broad measurable concentration range, this assay could be used as a promising tool for the fast-growing field of cell secretome analysis.
MATERIALS AND METHODS
Materials and reagents
Anti-biotin-coated MACSiBeads™ MPs and MACS bovine serum albumin (BSA) stock solution were obtained from Miltenyi Biotec (San Francisco, CA, USA). Biotinylated VEGF polyclonal Ab was purchased from ThermoFisher Scientific (Florence, KY, USA). Natural streptavidin (SA) protein was purchased from Abcam (Cambridge, MA, USA). The Human VEGF Quantikine ELISA kit and recombinant human VEGF – 165 protein were obtained from R&D Systems (Minneapolis, MN, USA). Phosphate buffered saline (PBS) was purchased from Corning (Manassas, VA, USA). Human mesenchymal stem cells (hMSCs) and the MSCGM Bulletkit were obtained from Lonza (Walkerville, MD, USA).
Device fabrication and testing procedures
The microfluidic Coulter counter was fabricated using a standard soft lithography method. As shown in , the device consists of one inlet reservoir, one channel and one outlet. Briefly, we first created an SU-8 (2025, MicroChem) master pattern containing the device structures by the photolithography method. Next, PDMS was poured over the master and cured in a vacuum oven, transferring the pattern to a PDMS slab. We then created interfaces for the electrodes, inlet reservoir and outlet by punching the PDMS slab with biopsy punches. Finally, the PDMS slab was bonded to a glass substrate (Plain Micro Slides, VWR, USA) after air plasma treatment (200 mTorr, 50 W, 50 s). The nominal dimensions of the sensing channel were 100 µm (length), 35 µm (depth), and 30 µm (width); the dimensions measured by the surface profilometer (Dektak 150, Veeco Instrument) were 99.88 ± 0.41 µm (length), 37.07 ± 0.21 µm (depth), and 32.10 ± 0.32 µm (width). For each test, 20 µL of the particle/aggregate suspension was loaded into the inlet reservoir and driven to pass through the device by a syringe pump at a flow rate of 130 µL/h. The testing circuit is shown in Figure S-1 (see the Supporting Information), and a DC bias of 1 V was applied to the micro-Coulter counter. The resistive pulse induced by the passage of each particle/aggregate was converted to voltage pulse output, which was amplified by an external circuit and recorded by an NI-DAQ board (PCI-6133, National Instrument, USA) at a sampling rate of 500 kHz. We used a custom Matlab program to analyze the recorded pulses. The equivalent diameter (d) of each particle or aggregate passing through the micro-Coulter counter was calculated from the voltage pulse amplitude (δR/R) using the equation below:
FIGURE 2. A) Picture of the micro-Coulter counter. B) Microscopic image of sensing channel.
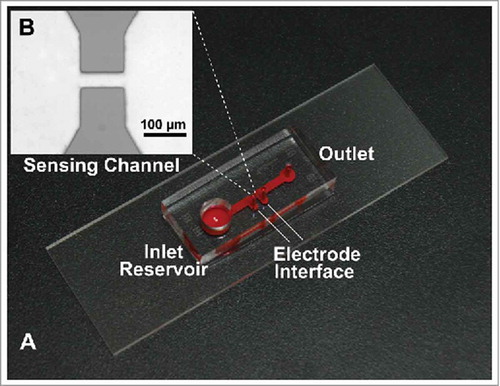
FIGURE 3. Microscopy images of microparticles (MPs)/aggregates from the A) negative control group, B) positive control group and C) competitive aggregation group with VEGF at 12.00 ng/mL. D) Average volume of MPs/aggregates measured from the corresponding groups.
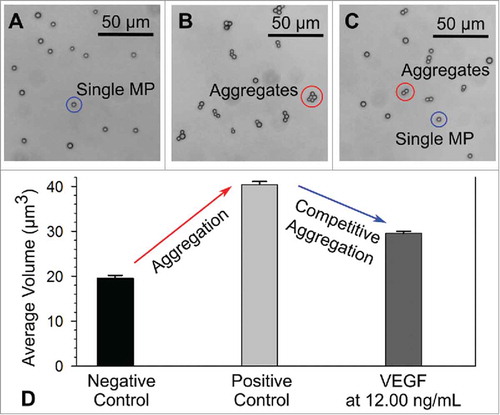
FIGURE 4. Standard VEGF sample testing results where the normalized volume change varied as a function of the VEGF concentration, which ranged from 0.01 to 100.00 ng/mL.
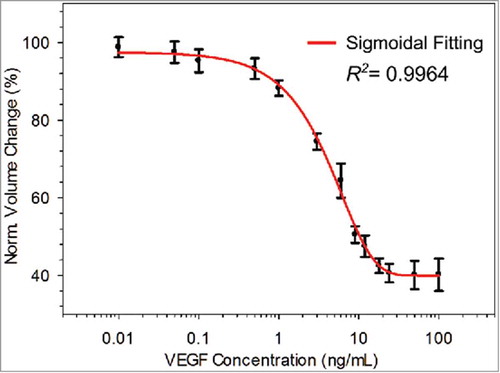
FIGURE 5. Measured VEGF concentration of cell secretome samples via ELISA and the competitive immuno-aggregation assay; the samples were collected at 5, 10, 15, 72, 120 hours. Student's t-test result (provided in the Supporting Information) showed no statistically significant difference between the corresponding VEGF protein concentrations.
Preparation of competitive immuno-aggregation
According to the sensing principle, the average volume of particles/aggregates is maximum in the absence of VEGF. To achieve high sensitivity, we first created the largest aggregate volume without VEGF (positive control) and then introduced VEGF protein to induce competitive aggregation.
For the positive control groups, anti-biotin functionalized MPs at a concentration of 2 × 10⁵ counts/mL were coated with 800.00 ng/mL biotinylated VEGF Ab according to the manufacturer's protocol. All the conjugation procedures were carried out using a buffer solution that consisted of cell culture grade 1X PBS containing 0.1% BSA. Briefly, the mixture solution was incubated at 2–8 °C for 2 hours with a constant rotation of 6 rpm using a mini tube rotator (Fisher Scientific, Florence, KY, USA). After incubation, the VEGF-Ab-conjugated MPs were washed once using buffer solution by centrifuging at 300 g for 5 min at 4 °C and re-suspended in fresh buffer solution. Next, different concentrations of natural SA protein varying from 250.00 ng/mL to 16000.00 ng/mL were used to induce the aggregation of 5 × 10⁴ MPs. The optimized SA concentration was found to achieve the maximum aggregation (see the Supporting Information, Figure S-7). The final reaction volume was maintained at 50 µL.
To induce competitive aggregation, various concentrations of VEGF protein were used in the samples. Anti-biotin-functionalized MPs at a concentration of 2 × 10⁵ counts/mL were mixed together with 800.00 ng/mL biotinylated VEGF Ab and various concentrations of recombinant human VEGF (rhVEGF) 165 protein ranging from 0.01 ng/mL to 100.00 ng/mL. The sample mixture was reacted for 2 hours at 2–8 °C with a constant rotation of 6 rpm. After incubation, the MPs were washed once and re-suspended in conjugation buffer solution. Aggregation of the VEGF-Ab-conjugated MPs was performed after adding 5 × 10⁴ MPs with 4000.00 ng/mL SA protein in the final reaction volume of 50 µL and reacting for 45 min at 25 °C with a constant rotation of 6 rpm.
Note that for all the experiments (both aggregation and competitive aggregation), we started with the same number of single MPs (5 × 10⁴) and maintained the same volume (50 µL) of the final samples. Microscopy images of the final MPs/aggregates were taken using an AxioVision A1 inverted microscope (Carl Zeiss, Oberkochen, Germany). In addition, the sizes of all microparticles/aggregates within each sample were measured by the micro-Coulter counter and an optical particle counter (AccuSizer™ 780 Particle Sizing Systems, USA).
Cell culture and secretome collection
To validate our assay with real cell secretome, we cultured hMSCs to prepare the cell secretome samples. Briefly, bone marrow-derived hMSCs were expanded in MSCGM Bulletkit medium supplemented with 1% antibiotic−antimycotic. The cells were maintained in a humidified cell culture incubator at 37 °C and 5% CO2 with medium change every 2 days. At 70%-80% confluence, the cells were harvested with 0.25% trypsin with EDTA (Gibco, Carlsbad, CA, USA) and expanded into a new flask to obtain the desired cell passage number. To prepare hMSC secretome, hMSCs (passage 7) were seeded bilaterally on sterilized 600 µm decellularized porcine myocardium slices (dPMSs) in a 12-well tissue culture plate as previously described.Citation69 Briefly, 2 × 10⁵ cells in 30 µL of culture medium were first seeded on one side of the dPMS restrained by an O-ring (10 mm inner diameter) placed on top of the dPMS. The seeded cells were incubated in a humidified cell culture incubator (37°C; 5% CO2) for 4 hours. After incubation, the dPMSs were flipped to seed cells at the same density on the other side and incubated another 4 hours before adding 1 mL of cell growth medium for continued culture. After adding the growth medium, the cells were then maintained in a humidified cell culture incubator (37°C; 5% CO2) for 5, 10, 15, 72, and 120 hours without replacing growth medium. Subsequently, the hMSC secretome was collected and centrifuged at 600 g for 5 min at 4°C to remove non-adherent cells. Following the same protocol, the medium control was prepared using dPMSs without incorporating cells and was used as the background for the ELISA test.
VEGF protein measurement by ELISA
Quantification of the VEGF level in hMSC secretome was performed using the Human VEGF Quantikine ELISA kit (R&D Systems, Minneapolis, MN, USA) according to the manufacturer's instructions. Briefly, hMSC secretome was diluted to 1:20 in calibrator diluent RD5K and loaded in duplicate onto a 96-well microplate coated with a monoclonal hVEGF Ab. The plate was covered with an adhesive strip and incubated for 2 hours at room temperature. Following incubation, we washed each well three times with washing buffer solution before adding human VEGF conjugate. Next, the plate was incubated for another 2 hours at room temperature and then washed three times with buffer solution. Subsequently, the plate was incubated with substrate solution for 20 min while protecting it from light at room temperature, and stop solution was then added. Each well was mixed thoroughly until color change was observed in the solution. Then, we measured the optical density at 450 nm within 30 min using a Synergy H1 hybrid microplate reader (Bio-Tek Instruments, Winooski, VT, USA). The background signal detected at 540 nm was subtracted from the determined absorbance values. All experiment groups were performed using three independent samples.
Statistical analysis
All data presented are mean ± standard deviation with three to six independent replicates. Statistical analysis was performed using Graphpad Prism 5 software (GraphPad Software Inc.). Student's t-test was used to compare the differences between two experiment groups. Analysis of variance (ANOVA) and Tukey's post hoc test was used to compare the differences between three or more experiment groups. A p-value of less than 0.05 was considered to be statistically significant.
DISCLOSURE OF POTENTIAL CONFLICT OF INTEREST
No potential conflicts of interest were disclosed.
SUPPLEMENTAL DATA
Supplemental data for this article can be accessed at: https://doi.org/10.1080/15476278.2018.1461306.
Additional information
Funding
REFERENCES
- Ferrara N, Gerber H-P, LeCouter J. The biology of VEGF and its receptors. Nat Med. 2003;9(6):669-76. doi:10.1038/nm0603-669. PMID:12778165.
- Kut C, Mac Gabhann F, Popel AS. Where is VEGF in the body? A meta-analysis of VEGF distribution in cancer. Br J Cancer. 2007;97(7):978-85. doi:10.1038/sj.bjc.6603923. PMID:17912242.
- Di Raimondo F, Azzaro MP, Palumbo GA, Bagnato S, Stagno F, Giustolisi GM, Cacciola E, Sortino G, Guglielmo P, Giustolisi R. Elevated vascular endothelial growth factor (VEGF) serum levels in idiopathic myelofibrosis. Leukemia. 2001;15(6):976-80. doi:10.1038/sj.leu.2402124. PMID:11417486.
- Botelho F, Pina F, Silva P, Figueiredo G, Cruz F, Lunet N. Vascular endothelial growth factor (VEGF) and prostate pathology. Int Braz J Urol. 2010;36(4):430-7. doi:10.1590/S1677-55382010000400006. PMID:20815949.
- Jung J, Kim S, Yoon K, Moon Y, Roh D, Lee S, Choi K, Jung J, Kim D. The Effect of Depression on Serum VEGF Level in Alzheimer's Disease. 2015;2015. doi: dx.doi.org/10.1155/2015/742612.
- Hsu MY, Yang CY, Hsu WH, Lin KH, Wang CY, Shen YC, Chen YC, Chau SF, Tsai HY, Cheng CM. Monitoring the VEGF level in aqueous humor of patients with ophthalmologically relevant diseases via ultrahigh sensitive paper-based ELISA. Biomaterials. 2014;35(12):3729-35. doi:10.1016/j.biomaterials.2014.01.030. PMID:24484673.
- Huang L, Jia J, Liu R. Decreased serum levels of the angiogenic factors VEGF and TGF-β1 in Alzheimer's disease and amnestic mild cognitive impairment. Neurosci Lett. 2013;550(August 2011):60-63. doi:10.1016/j.neulet.2013.06.031. PMID:23827227.
- Ferrara N, Hillan KJ, Novotny W. Bevacizumab (Avastin), a humanized anti-VEGF monoclonal antibody for cancer therapy. Biochem Biophys Res Commun. 2005;333(2):328-35. doi:10.1016/j.bbrc.2005.05.132. PMID:15961063.
- Osada T, Chong G, Tansik R, Hong T, Spector N, Kumar R, Hurwitz HI, Dev I, Nixon AB, Lyerly HK, Clay T, Morse MA. The effect of anti-VEGF therapy on immature myeloid cell and dendritic cells in cancer patients. Cancer Immunol Immunother. 2008;57(8):1115-24. doi:10.1007/s00262-007-0441-x. PMID:18193223.
- Jain RK, Duda DG, Clark JW, Loeffler JS. Lessons from phase III clinical trials on anti-VEGF therapy for cancer. Nat Clin Pract Oncol. 2006;3(1):24-40. doi:10.1038/ncponc0403. PMID:16407877.
- Kamba T, McDonald DM. Mechanisms of adverse effects of anti-VEGF therapy for cancer. Br J Cancer. 2007;96(12):1788-95. doi:10.1038/sj.bjc.6603813. PMID:17519900.
- Adams J, Carder PJ, Downey S, Forbes MA, MacLennan K, Allgar V, Kaufman S, Hallam S, Bicknell R, Walker JJ, et al. Vascular Endothelial Growth Factor (VEGF) in Breast Cancer: Comparison of Plasma, Serum, and Tissue VEGF and Microvessel Density and Effects of Tamoxifen 1. Cancer Res. 2000;60(36):2898-905. PMID:10850435.
- Stockhammer G, Obwegeser A, Kostron H, Schumacher P, Muigg A, Felber S, Maier H, Slavc I, Gunsilius E, Gastl G. Vascular endothelial growth factor (VEGF) is elevated in brain tumor cysts and correlates with tumor progression. Acta Neuropathol. 2000;100(1):101-5. doi:10.1007/s004010051199. PMID:10912927.
- Benoy I, Salgado R, Colpaert C, Weytjens R, Vermeulen PB, Dirix LY. Serum interleukin 6, plasma VEGF, serum VEGF, and VEGF platelet load in breast cancer patients. Clin Breast Cancer. 2002;2(4):311-5. doi:10.3816/CBC.2002.n.008. PMID:11899364.
- Fujimoto J, Sakaguchi H, Hirose R, Ichigo S, Tamaya T. Biologic implications of the expression of vascular endothelial growth factor subtypes in ovarian carcinoma. Cancer. 1998;83(12):2528-33. doi:10.1002/(SICI)1097-0142(19981215)83:12<2528::AID-CNCR18>3.0.CO;2-N. PMID:9874459.
- Obermair A, Tempfer C, Hefler L, Preyer O, Kaider A, Zeillinger R, Leodolter S, Kainz C. Concentration of vascular endothelial growth factor (VEGF) in the serum of patients with suspected ovarian cancer. Br J Cancer. 1998;77(11):1870-4. PMID:9667661.
- Harlozinska A, Sedlaczek P, Kulpa J, Grybos M, Wojcik E, Van Dalen A, Einarsson R. Vascular endothelial growth factor (VEGF) concentration in sera and tumor effusions from patients with ovarian carcinoma. Anticancer Res. 2004;24(2C):1149-57. PMID:15154640.
- Lange C, Storkebaum E, de Almodóvar CR, Dewerchin M, Carmeliet P. Vascular endothelial growth factor: a neurovascular target in neurological diseases. Nat Rev Neurol. 2016;12(8):439-54. doi:10.1038/nrneurol.2016.88. PMID:27364743.
- Mateo I, Llorca J, Infante J, Rodriguez-Rodriguez E, Fernandez-Viadero C, Pena N, Berciano J, Combarros O. Low serum VEGF levels are associated with Alzheimer's disease. Acta Neurol Scand. 2007;116(1):56-58. doi:10.1111/j.1600-0404.2006.00775.x. PMID:17587256.
- Boomsma RA, Geenen DL. Mesenchymal Stem Cells Secrete Multiple Cytokines That Promote Angiogenesis and Have Contrasting Effects on Chemotaxis and Apoptosis. PLoS One. 2012;7(4):e35685. doi:10.1371/journal.pone.0035685. PMID:22558198.
- Potapova IA, Gaudette GR, Brink PR, Robinson RB, Rosen MR, Cohen IS, Doronin SV. Mesenchymal Stem Cells Support Migration, Extracellular Matrix Invasion, Proliferation, and Survival of Endothelial Cells In Vitro. Stem Cells. 2007;25(7):1761-8. doi:10.1634/stemcells.2007-002. PMID:17395769.
- Takano S, Yoshii Y, Kondo S, Suzuki H, Maruno T, Shirai S, Nose T. Concentration of vascular endothelial growth factor in the serum and tumor tissue of brain tumor patients. Cancer Res. 1996;56(9):2185-90. PMID:8616870.
- Byrne AM, Bouchier-Hayes DJ, Harmey JH. Angiogenic and cell survival functions of vascular endothelial growth factor (VEGF). J Cell Mol Med. 2005;9(4):777-94. doi:10.1111/j.1582-4934.2005.tb00379.x. PMID:16364190.
- Gerber H-P, Malik AK, Solar GP, Sherman D, Liang XH, Meng G, Hong K, Marsters JC, Ferrara N. VEGF regulates haematopoietic stem cell survival by an internal autocrine loop mechanism. Nature. 2002;417(6892):954-8. doi:10.1038/nature00821. PMID:12087404.
- Segi-Nishida E, Warner-Schmidt JL, Duman RS. Electroconvulsive seizure and VEGF increase the proliferation of neural stem-like cells in rat hippocampus. Proc Natl Acad Sci. 2008;105(32):11352-7. doi:10.1073/pnas.0710858105. PMID:18682560.
- Xiao Z, Kong Y, Yang S, Li M, Wen J, Li L. Upregulation of Flk-1 by bFGF via the ERK pathway is essential for VEGF-mediated promotion of neural stem cell proliferation. Cell Res. 2007;17(1):73-79. doi:10.1038/sj.cr.7310126. PMID:17211450.
- Lee EY, Xia Y, Kim WS, Kim MH, Kim TH, Kim KJ, Park BS, Sung JH. Hypoxia-enhanced wound-healing function of adipose-derived stem cells: Increase in stem cell proliferation and up-regulation of VEGF and bFGF. Wound Repair Regen. 2009;17(4):540-7. doi:10.1111/j.1524-475X.2009.00499.x. PMID:19614919.
- Yamashita J, Itoh H, Hirashima M, Ogawa M, Nishikawa S, Yurugi T, Naito M, Nakao K, Nishikawa S. Flk1-positive cells derived from embryonic stem cells serve as vascular progenitors. Nature. 2000;408(6808):92-96. doi:10.1038/35040568. PMID:11081514.
- Claffey KP, Wilkison WO, Spiegelman BM. Vascular endothelial growth factor. Regulation by cell differentiation and activated second messenger pathways. J Biol Chem. 1992;267(23):16317-22. PMID:1644816.
- Zeng L, Xiao Q, Margariti A, Zhang Z, Zampetaki A, Patel S, Capogrossi MC, Hu Y, Xu Q. HDAC3 is crucial in shear- and VEGF-induced stem cell differentiation toward endothelial cells. J Cell Biol. 2006;174(7):1059-69. doi:10.1083/jcb.200605113. PMID:16982804.
- Wijelath ES, Rahman S, Murray J, Patel Y, Savidge G, Sobel M. Fibronectin promotes VEGF-induced CD34+ cell differentiation into endothelial cells. J Vasc Surg. 2004;39(3):655-60. doi:10.1016/j.jvs.2003.10.042. PMID:14981463.
- Das H, George JC, Joseph M, Das M, Abdulhameed N, Blitz A, Khan M, Sakthivel R, Mao HQ, Hoit BD, et al. Stem cell therapy with overexpressed VEGF and PDGF genes improves cardiac function in a rat infarct model. PLoS One. 2009;4(10):1-10. doi:10.1371/journal.pone.0007325.
- Tang YL, Zhao Q, Zhang YC, Cheng L, Liu M, Shi J, Yang YZ, Pan C, Ge J, Phillips MI. Autologous mesenchymal stem cell transplantation induce VEGF and neovascularization in ischemic myocardium. Regul Pept. 2004;117(1):3-10. doi:10.1016/j.regpep.2003.09.005. PMID:14687695.
- Nakagami H, Maeda K, Morishita R, Iguchi S, Nishikawa T, Takami Y, Kikuchi Y, Saito Y, Tamai K, Ogihara T, et al. Novel autologous cell therapy in ischemic limb disease through growth factor secretion by cultured adipose tissue-derived stromal cells. Arterioscler Thromb Vasc Biol. 2005;25(12):2542-7. doi:10.1161/01.ATV.0000190701.92007.6d. PMID:16224047.
- Slongo ML, Molena B, Brunati AM, Frasson M, Gardiman M, Carli M, Perilongo G, Rosolen A, Onisto M. Functional VEGF and VEGF receptors are expressed in human medulloblastomas. Neuro Oncol. 2007;9:384-92. doi:10.1215/15228517-2007-032. PMID:17704359.
- Wimazal F, Krauth M-T, Vales A, Bohm A, Agis H, Sonneck K, Aichberger KJ, Mayerhofer M, Simonitsch-Klupp I, Mullauer L, et al. Immunohistochemical detection of vascular endothelial growth factor (VEGF) in the bone marrow in patients with myelodysplastic syndromes: correlation between VEGF expression and the FAB category. Leuk Lymphoma. 2006;47(3):451-60. doi:10.1080/10428190500353083. PMID:16396768.
- Vernes J-M, Meng YG. Detection and Quantification of VEGF Isoforms by ELISA. In: Methods in Molecular Biology. 2015;1332:25-37. doi:10.1007/978-1-4939-2917-7_2.
- Lee RH, Pulin AA, Seo MJ, Kota DJ, Ylostalo J, Larson BL, Semprun-Prieto L, Delafontaine P, Prockop DJ. Intravenous hMSCs Improve Myocardial Infarction in Mice because Cells Embolized in Lung Are Activated to Secrete the Anti-inflammatory Protein TSG-6. Cell Stem Cell. 2009;5(1):54-63. doi:10.1016/j.stem.2009.05.003. PMID:19570514.
- Mosmann TR, Cherwinski H, Bond MW, Giedlin MA, Coffman RL. Two types of murine helper T cell clone. I. Definition according to profiles of lymphokine activities and secreted proteins. J Immunol. 1986;136(7):2348-57. doi:10.1111/j.1442-9071.2011.02672.x. PMID:2419430.
- Nickerson DA, Kaiser R, Lappin S, Stewartt J, Hood L, Landegrent U. Automated DNA diagnostics using an ELISA-based oligonucleotide ligation assay (DNA amplification/gene detection/genome mapping). Genetics. 1990;87(November):8923-7. doi:10.1073/pnas.87.22.8923.
- Emlen W, Jarusiripipat P, Burdick G. A new ELISA for the detection of double-stranded D N A antibodies. J Immunol Methods. 1990;132:91-101. doi:10.1016/0022-1759(90)90402-H. PMID:2391439.
- Stokes RP, Cordwell A, Thompson RA. A simple, rapid ELISA method for the detection of DNA antibodies. J Clin Pathol. 1982;35(5):566-73. doi:10.1136/jcp.35.5.566. PMID:6979559.
- Zangar RC, Daly DS, White AM. ELISA microarray technology as a high-throughput system for cancer biomarker validation. Expert Rev Proteomics. 2006;3(1):37-44. doi:10.1586/14789450.3.1.37. PMID:16445349.
- Keyes KA, Mann L, Sherman M, Galbreath E, Schirtzinger L, Ballard D, Chen YF, Iversen P, Teicher BA. LY317615 decreases plasma VEGF levels in human tumor xenograft-bearing mice. Cancer Chemother Pharmacol. 2004;53(2):133-40. doi:10.1007/s00280-003-0713-x. PMID:14593497.
- Zhang J, Yin L, Wu J, Zhang Y, Xu T, Ma R, Cao H, Tang J. Detection of serum VEGF and MMP-9 levels by luminex multiplexed assays in patients with breast infiltrative ductal carcinoma. Exp Ther Med. 2014;8(1):175-80. doi:10.3892/etm.2014.1685. PMID:24944618.
- Keyes KA, Mann L, Cox K, Treadway P, Iversen P, Chen YF, Teicher BA. Circulating angiogenic growth factor levels in mice bearing human tumors using Luminex Multiplex technology. Cancer Chemother Pharmacol. 2003;51(4):321-7. doi:10.1007/s00280-003-0572-5. PMID:12721760.
- Li Y, Lee HJ, Corn RM. Detection of Protein Biomarkers Using RNA Aptamer Microarrays and Enzymatically Amplified Surface Plasmon Resonance Imaging. Anal Chem. 2007;79(3):1082-8. doi:10.1021/ac061849m. PMID:17263339.
- Amouzadeh Tabrizi M, Shamsipur M, Farzin L. A high sensitive electrochemical aptasensor for the determination of VEGF(165) in serum of lung cancer patient. Biosens Bioelectron. 2015;74:764-9. doi:10.1016/j.bios.2015.07.032. PMID:26217879.
- Zhao S, Ma W, Xu L, Wu X, Kuang H, Wang L, Xu C. Ultrasensitive SERS detection of VEGF based on a self-assembled Ag ornamented-AU pyramid superstructure. Biosens Bioelectron. 2015;68:593-7. doi:10.1016/j.bios.2015.01.056. PMID:25643599.
- Zhao Y, Li X, Liu Y, Zhang L, Wang F, Lu Y. High performance surface-enhanced Raman scattering sensing based on Au nanoparticle-monolayer graphene-Ag nanostar array hybrid system. Sensors Actuators, B Chem. 2017;247:850-7. doi:10.1016/j.snb.2017.03.063.
- Nonaka Y, Abe K, Ikebukuro K. Electrochemical detection of vascular endothelial growth factor with aptamer sandwich. Electrochemistry. 2012;80(5):363-6. doi:10.5796/electrochemistry.80.363.
- Kim GI, Kim KW, Oh MK, Sung YM. Electrochemical detection of vascular endothelial growth factors (VEGFs) using VEGF antibody fragments modified Au NPs/ITO electrode. Biosens Bioelectron. 2010;25(7):1717-22. doi:10.1016/j.bios.2009.12.015. PMID:20047825.
- Zhao S, Yang W, Lai RY. A folding-based electrochemical aptasensor for detection of vascular endothelial growth factor in human whole blood. Biosens Bioelectron. 2011;26(5):2442-7. doi:10.1016/j.bios.2010.10.029. PMID:21081271.
- Huang S-C, Stump MD, Weiss R, Caldwell KD. Binding of Biotinylated DNA to Streptavidin-Coated Polystyrene Latex: Effects of Chain Length and Particle Size. Anal Biochem. 1996;237(1):115-22. doi:10.1006/abio.1996.0208. PMID:8660545.
- Välimaa L, Pettersson K, Vehniäinen M, Karp M, Lövgren T. A High-Capacity Streptavidin-Coated Microtitration Plate. Bioconjug Chem. 2003;14(1):103-11. doi:10.1021/bc020058y. PMID:12526699.
- Walker A, Chung C-W, Neu M, Burman M, Batuwangala T, Jones G, Tang CM, Steward M, Mullin M, Tournier N, et al. Novel Interaction Mechanism of a Domain Antibody-based Inhibitor of Human Vascular Endothelial Growth Factor with Greater Potency than Ranibizumab and Bevacizumab and Improved Capacity over Aflibercept. J Biol Chem. 2016;291(11):5500-11. doi:10.1074/jbc.M115.691162. PMID:26728464.
- Han Y, Wu H, Liu F, Cheng G, Zhe J. Label-free biomarker assay in a microresistive pulse sensor via immunoaggregation. Anal Chem. 2014;86(19):9717-22. doi:10.1021/ac502270n. PMID:25226582.
- Han Y, Wu H, Liu F, Cheng G, Zhe J. A multiplexed immunoaggregation biomarker assay using a two-stage micro resistive pulse sensor. Biomicrofluidics. 2016;10(2):24109. doi:10.1063/1.4944456.
- Groessl M, Luksch H, Rösen-Wolff A, Shevchenko A, Gentzel M. Profiling of the human monocytic cell secretome by quantitative label-free mass spectrometry identifies stimulus-specific cytokines and proinflammatory proteins. Proteomics. 2012;12(18):2833-42. doi:10.1002/pmic.201200108. PMID:22837156.
- Pawitan JA. Prospect of Stem Cell Conditioned Medium in Regenerative Medicine. Biomed Res Int. 2014;2014:1-14. doi:10.1155/2014/965849.
- Jagtiani AV, Sawant R, Zhe J. A label-free high throughput resistive-pulse sensor for simultaneous differentiation and measurement of multiple particle-laden analytes. J Micromechanics Microengineering. 2006;16(8):1530-9. doi:10.1088/0960-1317/16/8/013.
- Zhe J, Jagtiani A, Dutta P, Hu J, Carletta J. A micromachined high throughput Coulter counter for bioparticle detection and counting. J Micromechanics Microengineering. 2007;17(2):304-13. doi:10.1088/0960-1317/17/2/017.
- Jagtiani AV, Carletta J, Zhe J. A microfluidic multichannel resistive pulse sensor using frequency division multiplexing for high throughput counting of micro particles. J Micromechanics Microengineering. 2011;21(6):65004. doi:10.1088/0960-1317/21/6/065004.
- Liu F, Han Y, Du L, Huang P, Zhe J. Airborne Mineral Dust Measurement Using an Integrated Microfluidic Device. Microfluid Nanofluidics. 2015:1-7. doi:10.1007/s10404-015-1672-3.
- DeBlois RW, Wesley RK. Sizes and concentrations of several type C oncornaviruses and bacteriophage T2 by the resistive-pulse technique. J Virol. 1977;23(2):227-33. PMID:196107.
- DeBlois RW. Counting and Sizing of Submicron Particles by the Resistive Pulse Technique. Rev Sci Instrum. 1970;41(7):909. doi:10.1063/1.1684724.
- Kim Thanh NT, Rosenzweig Z. Development of an aggregation-based immunoassay for anti-protein A using gold nanoparticles. Anal Chem. 2002;74(7):1624-8. doi:10.1021/ac011127p. PMID:12033254.
- Chen YP, Zou MQ, Qi C, Xie MX, Wang DN, Wang YF, Xue Q, Li JF, Chen Y. Immunosensor based on magnetic relaxation switch and biotin–streptavidin system for the detection of Kanamycin in milk. Biosens Bioelectron. 2013;39(1):112-7. doi:10.1016/j.bios.2012.06.056. PMID:22854330.
- KC P, Shah M, Liao J, Zhang G. Prevascularization of decellularized porcine myocardial slice for cardiac tissue engineering. ACS Appl Mater Interfaces. 2017;9(3):2193-204. doi:10.1021/acsami.6b15291.