
Abstract
Overexpression of the oncogene HER2 occurs in 20–30% of invasive breast cancer and is associated with poor prognosis. A number of different splice variants of HER2 have been identified which produce functionally different proteins. Previously these splice variants have been investigated separately, but in the present study we collectively look at the expression and regulation of a group of HER2 splice variants produced by a splicing hotspot. Initial investigation in a cohort of tumor samples showed large variations in HER2 variant expression between patient samples. RNA interference studies identified 2 splicing factors involved in the regulation of splicing within this region, hnRNP H1 and SRSF3. siRNA targeting hnRNP H1 increases levels of X5 and the oncogenic variant Δ16HER2. Furthermore RNA chromatography assays demonstrated binding of hnRNP H1 to RNA in this region. Additionally the proto-oncogene SRSF3 was also identified as an important regulator of splicing with SRSF3 knockdown resulting in changes in all the splice variants located at the hotspot. Most notably knockdown of SRSF3 resulted in a switch from the oncogenic Δ16HER2 to p100 which inhibits cell proliferation. Binding of SRSF3 to RNA within this region was also demonstrated by RNA chromatography and more specifically 2 SRSF3 binding sites were identified within exon 15. SRSF3 and hnRNP H1 are the first splicing factors identified which regulate the production of these functionally distinct HER2 splice variants and therefore maybe important for the regulation of HER2 signaling.
Introduction
HER2 is one of the key prognostic and treatment indicators measured in breast cancer, and is overexpressed in 20–30% of breast cancer cases. These elevated levels of HER2 are associated with more aggressive tumors and a poor prognosis.Citation1 Specific treatments for HER2-positive patients such as the monoclonal antibody trastuzumab (Herceptin®) have improving outcomes. This is particularly the case in the early stages of the disease when there is reduced disease recurrence and significantly improved survival rates.Citation2,3 Despite these advances resistance to trastuzumab remains a problem, with only 26% of metastatic disease responding to trastuzumab when given as a single agent, and with almost all initial responders going on to develop resistance.Citation2,4 Therefore understanding HER2 biology is essential for determining the mechanism of resistance to these therapies.
HER2 (ErbB2) along with HER1 (ErbB1, EGFR), HER3 (ErbB3) and HER4 (ErbB4) are members of the erythroblastic oncogene B (ErbB) family of receptor tyrosine kinases. This family of receptors form homodimers and heterodimers after binding of ligands to their extracellular domain. Upon dimerization their intracellular tyrosine kinase domains are activated allowing for autophosphorylation. The phosphorylated tyrosines then act as docking sites for proteins which activate various signaling cascades including the RAS/RAF/MEK and PI3K/AKT pathways.Citation5 Although HER2 has no known ligand it maintains a continuously active conformation and can form heterodimers with other members of the EGF family, or homodimers when expressed at high concentrations. HER2 is the preferred binding partner of all the other ErbB receptors,Citation6,7 and also appears to amplify the signaling of the other receptors resulting in heterodimers with potent mitogenic activity.Citation8
Three splice variants of HER2 have currently been identified () and found to have vastly different biological activities and roles in cancer development.Citation9 Two of the splice variants p100 and herstatin produce secreted proteins, both of which inhibit cell proliferation.Citation10-12 Herstatin is produced by the inclusion of intron 8 which encodes an alternative 79 amino acid C-terminus,Citation10 whereas p100 is produced by inclusion of intron 15 which introduces a premature stop codon.Citation11 The other well documented splice variant of HER2 is Δ16HER2 which is produced through the skipping of exon 16.Citation13,14 Loss of exon 16 causes an in-frame deletion of 16 amino acids within the juxtamembrane domain resulting in the formation of disulphide-bonded homodimers which are constitutively active.Citation13,15 Consequently this variant has been shown to be highly tumorigenicCitation14-18 compared to the canonical HER2 isoform, as well as being associated with increased invasive properties and metastasis.Citation15,18 A number of studies have also linked Δ16HER2 with trastuzumab resistance.Citation15,16
Figure 1. Production of HER2 variants. (A) A regulation hotspot in HER2. The region between exon 14 and exon 17 produces of a number of different HER2 variants. Including Δ16HER2 which has exon 16 excluded, p100 which has intron 15 included, and X5 which splices in part of intron 14. In addition to these splice variants there are 2 further variants produced by alternative translation initiation in exon 15 and 17 (CTF-611 and CTF-687). (B) The other splice variant of HER2 (Herstatin) is produced by the inclusion of intron 8.
The splice variants p100 and Δ16HER2 involve splicing events that occur in close proximity to each other (), raising the possibility that they may be jointly regulated. Also within this region there is a predicted splice variant (NCBI predicted ERBB2 transcript variant X5 (XM_006721767)) which splices in part of intron 14 resulting in the inclusion of a stop codon. Therefore this variant is predicted to produce a truncated protein with an alternative 61 amino acid C-terminus. In addition to these splice variants there have also been reports of alternative translation initiation sites with exons 15 and 17 producing 611-CTF and 687-CTF.Citation19 These two proteins are also functionally different with 687-CTF appearing to be inactive and 611-CTF demonstrating potent oncogenic activity due to formation of disulphide-bonded constitutive active homodimers.Citation20 Additionally, 611-CTF has also been shown to promote migration, invasion and metastasis,Citation20,21 as well as being implicated in trastuzumab resistance.Citation19 The presence of these translation initiation sites within this highly spliced region may be significant as there are some RNA-binding proteins that can affect both splicing and IRES mediated translation initiation. Therefore it is important to understand how this region is regulated as it produces a range of HER2 proteins that are functionally very different.
Here we investigate both the expression of the HER2 variants produced by this region as well as studying their regulation. RNAi was used to demonstrate the central role of SRSF3 and hnRNP H1 in determining which variant is produced.
Materials and Methods
Cell culture
SKBR3 breast cancer cells (ATCC) were maintained in McCoy's 5a plus GlutaMAX medium (GIBCO by Life Technologies) supplemented with 10% Foetal Calf Serum (Sigma-Aldrich) and 1unit/ml Penicillin/Streptomycin (Sigma-Aldrich) and incubated at 37°C with 5% CO2.
Transfections
SKBR3 cells were transfected with Silencer® Select siRNA (Ambion; ), Silencer® Negative Control siRNA (Ambion), Silencer® Select GAPDH Positive Control siRNA (Ambion) using INTERFERin® Transfection Agent (Polyplus transfection™) according to the manufacturer's instructions. At least 2 siRNA oligonucleotides were used for each splicing factor. Following optimisation SKBR3 cells were seeded at 3.5 × 10⁴ cells/well in 24 well plates, or 1.75×10⁵ cells/well into 6 well plates. After 24 hours cells were transfected with 5nM siRNA with 4 µl/ml of INTERFERin® transfection agent. Cells and siRNA were incubated together at 37°C in an atmosphere of 5% CO2. RNA was collected 48 and 72 hours post-transfection and protein collected 72 hours post-transfection. In all experiments levels of knockdown by RNAi were assessed at the RNA and protein level by PCR and immunoblotting, as described. SKBR3 cells were also used for transfection experiments with SmartFlare™ RNA detection probes (Millipore) specific for HER2 and a negative control probe. Following optimisation 2 × 10⁴ cells/well were treated with 4 μL diluted probe (1:20 in sterile PBS) and Incubated overnight (16 hours) at 37°C in an atmosphere of 5% CO2. Intracellular HER2 mRNA expression was measured by Confocal Microscopy.
Table 1. siRNA sequences
Tissues
Frozen breast tumor tissue was obtained from a Newcastle University/Queen Elizabeth Hospital Gateshead tissue bank and used in accordance with Gateshead Local Research Ethics Committee approval Ref 52/02. Tissue was obtained from consenting patients and ‘snap-frozen’ in liquid nitrogen before storing at −80°C. Corresponding formalin fixed paraffin embedded (FFPE) breast tumor was used at Queen Elizabeth Hospital for histocytopathological analysis in accordance with local ethics approval.
The cohort of samples included ductal carcinoma in-situ (DCIS), and HER2 positive and HER2 negative invasive breast carcinomas of varied stage and grade. HER2 status was determined by HercepTest (DakoCytomation), which employs a C-terminal anti-HER2 antibody, at the Histocytopathology Department at Queen Elizabeth Hospital.
RNA isolation and PCR
Total RNA from cultured cells was extracted with RNeasy spin columns (Qiagen) and treated with DNase I (Qiagen) following manufacturer's instructions. For tumor samples 30mg of tissue was ‘snap-frozen’ in liquid nitrogen and ground to a powder then added to 175µl RNA Lysis Buffer (Promega). Total RNA was then isolated using the SV Total RNA Isolation System (Promega) according to manufacturer's instructions.
One µg of total RNA from cultured cells and 500 ng of total RNA from tissue samples was reverse transcribed using oligo (dT) primers and Superscript II Reverse Transcriptase (RT) (Invitrogen, Life Technologies) following manufacturer's instructions. PCRs were performed with the cDNA, specific primers () and PCR master mix (Promega). Primers for HER2 were designed so that they could detect specific splice variants of HER2. The primers to detect exon 16 inclusion or deletion were previously validated by Mitra et al.Citation15 The cDNA products were separated by electrophoresis on 1.5% (w/v) agarose gels and visualised under UV following ethidium bromide staining.
Table 2. Primer sequences
Real-time PCR was performed on cDNA using the QuantiFast SYBR Green PCR Kit (Qiagen) and HER2 splice-specific primers. GAPDH primers were used as an endogenous control. Standard curves were performed with all primer pairs to determine efficiency. The assay was performed in triplicate and the PCR amplification performed using the StepOnePlus real-time PCR system (Applied Biosystems). All experiments were performed in triplicate with a minimum of 3 independent experiments.
Protein extraction and Western Blotting
Tumor samples were ‘snap-frozen’ in liquid nitrogen and ground to a powder. 200µl of RIPA buffer (25 mM Tris-HCl, pH 7.6, 150 mM NaCl, 1% NP-40, 0.1% sodium deoxycholate and 0.1% SDS) supplemented with Protease Inhibitors (PI; Sigma-Aldrich) was added to each sample before being sonicated and centrifuged at 4°C, 9000xg for 10 minutes. The supernatant was aliquoted and stored at −20°C. Insufficient tissue was available to extract protein from sample 7. SKBR3 cells were washed in ice cold PBS and then collected in RIPA buffer supplemented with protease inhibitors. The cell lysate was passed through a 25 gauge needle, aliquoted and stored at −20°C.
Following protein quantification 30µg of protein extracted from tissue samples and 10µg of protein extracted from SKBR3 cells was heat denatured at 95°C for 5 minutes with SDS loading buffer (0.125M Tris-HCl pH6.8, 2% SDS, 10% glycerol, 10% (v/v) β-mercaptoethanol, 0.1% (v/w) bromophenol blue).
Protein lysates were separated using either 7% or 12% SDS-polyacrylamide gel electrophoresis (PAGE) gels and transferred electrophoretically onto nitrocellulose membranes. After blocking with 10% dried milk powder in 1x PBS membranes were probed with either rabbit anti-GAPDH (1:1000, Santa Cruz), rabbit anti-HER2/ErbB2 (C-terminal, 1:1000, Cell Signaling Technology), rabbit anti-HER2/ErbB2 XP (N-terminal, 1:1000, Cell Signaling Technology), mouse anti-SRp20 (1:1000, SRSF3, Zymed), rabbit anti-hnRNP H1 (1:1000, GeneTex) diluted in PBS plus 1% milk and incubated overnight at 4°C. After washing in PBS the appropriate HRP-conjugated secondary antibodies (Dako) diluted in PBS were added. ECL and Super Signal Femto ECL (Pierce) were used for protein detection.
RNA Immunoprecipitation
MCF-7 cells were washed in ice cold PBS and then collected in lysis buffer (10 mM Tris-HCl (pH 7.5), 150 mM NaCl, 0.5% NP-40, 1% Triton X-100) containing protease inhibitors (Sigma-Aldrich) and RNase OUT (Invitrogen). Equal amounts of cell lysate were then incubated overnight at 4°C with 2 µg of either rabbit anti-hnRNP H1 antibody (GeneTex) and rabbit IgG control (Santa Cruz) or mouse anti-SRSF3 antibody (LSBio) and mouse IgG control (Santa Cruz). Cell lysates and antibodies were then incubated with Dynabeads Protein G (Invitrogen) for a further hour at 4°C. Beads were then washed 5 times with lysis buffer before the immunoprecipitated RNA was collected in Trizol reagent (Invitrogen) according to manufacturer's instructions. RT-PCR and Real-time PCR experiments were performed as before but half of the RNA obtained from the immunoprecipitation was used in each reaction. Fold enrichment of target mRNA was determined after normalization to the input and rabbit IgG controls.
Nuclear extract
Cells (3 × 75 cm2 flasks) were washed with ice cold PBS before being collected in ice cold PBS using a cell scraper and centrifugation at 1000 rpm for 5 minutes at 4°C to pellet the cells. After removal of the PBS the pellet was resuspended in 500 µl of Buffer A (10 mM HEPES pH7.9, 1.5 mM MgCl2, 10 mM KCl, 0.5 mM DTT and 5 µl/ml Protease Inhibitor Cocktail), and incubate on ice for 15 minutes. NP-40 substitute was then added to a final concentration of 0.5 % and the cells were vortexed for 10 seconds. The nuclei were pelleted by centrifugation at 6500 rpm for 1 minute, and the supernatant (cytoplasmic fraction) recovered. The nuclear pellet was resuspended in 150 µl of Buffer C (20 mM HEPES pH7.9, 1.5 mM MgCl2, 420 mM NaCl, 0.2 mM EDTA, 25 % (v/v) Glycerol and 5 µl/ml Protease Inhibitor Cocktail) and incubate on ice with vigorous agitation for 30 minutes, followed by centrifugation at 12000 rpm for 10 minutes at 4 °C, and recovery of the supernatant (nuclear fraction).
RNase-assisted chromatography
Oligonucleotide sequences, containing potential binding sites for RNA-binding proteins were designed to be used in RNase-assisted chromatography. Sequences were positioned downstream from a T7 RNA promoter to promote transcription (). These oligonucleotides and a complementary T7 promoter oligonucleotide were annealed by diluted in annealing buffer (10 mM Tris, pH 7.5 - 8.0, 50 mM NaCl, 1mM EDTA), they were then heated to 95°C followed by slow cooling to room temperature.
Table 3. Oligonucleotide sequences for RNase-assisted chromatography
In-vitro-transcribed RNAs were synthesized from the oligonucleotide sequences by run-off transcription using a T7 RNA polymerase (NE Biolabs) according to manufacturer's instructions. DNA oligonucleotides were degraded with TURBO™ DNase (Ambion) and RNA was purified by phenol-chloroform extraction. RNA was then used for RNase assisted chromatography which was performed as previously described.Citation22 In brief, 1 nmole of each RNA was conjugated to adipic acid dihydrazide agarose beads followed by incubation with SKBR3 nuclear extract. After washing RNA bound proteins were removed from the beads by RNase digestion and then separated on a NuPage pre-cast gel (Invitrogen, Life Technologies) and visualised by with SimplyBlue Safestain (Invitrogen, Life Technologies) or by immunoblotting.
Results
Due to the close proximity of Δ16HER2, p100 and X5 splicing events within the HER2 RNA sequence there may be overlapping regulation. Therefore, the expression of these alternatively spliced HER2 mRNAs was investigated in a cohort of breast tumor samples and SKBR3 cells using conventional RT-PCR (). Tumor tissue was of varied grade, type and HER2 status; with three HER2 positive samples (HER2 overexpression), 6 HER2 negative samples (normal HER2 expression) and 2 ductal carcinoma in situ (DCIS) a non-invasive breast cancer. Splice-specific targeted primer sets which annealed to exon-exon or exon-intron junctions were used to ensure amplification of desired mRNA transcripts only.
Figure 2. HER2 mRNA expression in breast tumor tissue and SKBR3 breast cancer cells. (A) HER2 mRNA expression was investigated in a cohort of 12 breast tumor tissue samples and the HER2 positive SKBR3 breast cancer cell line. Splice-specific primers for exon16 inclusion (WT), exon16 exclusion (Δ16HER2), intron 15 inclusion (p100) and exon 15a inclusion (X5) were used to determine expression of HER2 splice variants along with 2 housekeeping genes GAPDH and β-actin. (B) Intracellular expression of WT HER2 mRNA in live SKBR3 breast cancer cells using SmartFlare™ RNA detection probes.
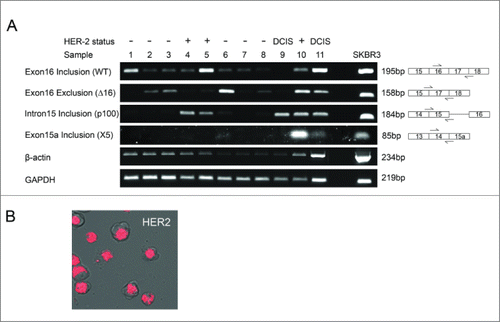
SKBR3 breast cancer cells expressed high levels of canonical HER2 (wild-type (WT)) mRNA as demonstrated by SmartFlare™ RNA detection probes which show levels of canonical HER2 transcript in live cells (). SKBR3 cells also showed strong expression of all 4 alternative splicing events by conventional PCR, while in comparison expression varied between tissue samples. Exon 16 inclusion (WT), exon 16 skipping (Δ16HER2), intron 15 inclusion (p100) and exon 15a inclusion (X5) occurred collectively within the same tumor samples. Two samples expressed mRNA for all 4 alternative splicing events; one sample was HER2 positive (sample 10) but the other was DCIS (sample 11). The rest of the sample cohort expressed alternatively spliced mRNA in varying ratios.
Three samples expressed strong bands for exon 16 inclusion (canonical HER2); a HER2 negative sample (sample 1), a HER2 positive sample (sample 5) and a DCIS sample (sample 11). This was also true for exon 16 skipping (Δ16HER2), for which strong bands were detected again in a HER2 negative sample (sample 6), a HER2 positive sample (sample 10) and a DCIS sample (sample 11). Strong bands for intron 15 retention (p100) were detected in both DCIS samples and the HER2 positive samples. Exon 15a retention was a less common splicing event only occurring in 2 samples, one of which was a HER2 positive (sample 10) and the other being a DCIS sample (sample 11).
HER2 protein variants were also investigated by immunoblotting with both C-terminal and N-terminal anti-HER2 antibodies. This was important to maximise detection of potential HER2 proteins specifically detection of truncated proteins such as p100 which does not encode the C-terminal. SKBR3 cells express a strong band corresponding to the molecular weight of canonical HER2 (185kDa), as well as bands denoting smaller potential HER2 proteins with both the C-terminal and N-terminal anti-HER2 antibodies. However, before these could be confirmed as HER2 proteins, the specificity of the anti-HER2 antibodies required verification. RNAi was employed to ‘knockdown’ HER2 in SKBR3 cells, with 2 different siRNAs targeting HER2. demonstrate verification of the specificity of C-terminal anti-HER2 antibody and N-terminal anti-HER2 antibody respectively. Efficient reduction of full length HER2 (185kDa) was achieved after treatment with both HER2 specific siRNA. Increased membrane exposure also demonstrated efficient ‘knockdown’ of smaller protein bands detected by Western blotting, confirming these were also HER2 proteins. These bands include bands at around 100kDa detected by the C-terminal antibody which may represent the CTF proteins (CTF-611, CTF-687, and CTF-648), and bands detected by the N-terminal antibody at around 95kDa which may be p100 or X5 and at 65kDa which may be Herstatin. Additionally both the N-terminal and C-terminal HER2 antibodies detected bands between 130–170kDa. Currently there are no known variants at this size therefore these may represent new uncharacterised HER2 variants.
Figure 3. HER2 proteins expressed in breast tumor tissues and SKBR3 cells. (A and B) Reduction of HER2 protein expressed by SKBR3 cells was achieved via RNA interference using 2 different siRNA sequences (lanes 1–4). Four controls comprising a positive transfection control (GAPDH siRNA (G)), a negative scrambled sequence control siRNA (NC), a vehicle only control (V) and untreated cells (UT) were included (lanes 5–8). Levels of HER2 proteins were determined by immunoblotting using C-terminal (A) and N-terminal (B) anti-HER2 antibodies (C) Immunoblotting using C-terminal and N-terminal anti-HER2 antibodies and protein extracted from tumor tissue samples and SKBR3 cells. GAPDH was used as a loading control.
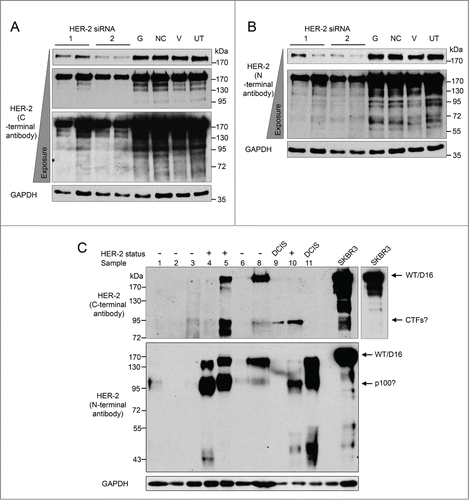
In addition to the SKBR3 cells the levels of HER2 protein variants were investigated in tumor samples by immunoblotting (). This was carried out on the same cohort of tumor samples used for RT-PCR, although one sample was not included in protein studies as insufficient tissue was available. HER2 proteins were expressed in 6 of 10 tumor samples available for protein studies, including all of the HER2 positive samples as well as the DCIS samples and one HER2 negative sample (sample 8). Of these, the C-terminal anti-HER2 antibody detected proteins in 4 samples. The N-terminal anti-HER2 antibody detected proteins in 5 samples. Significant levels of the smaller potential HER2 proteins were present in the tumor samples and often showing equal or greater expression compared to canonical HER2 (185kDa). Bands were detected at 100kDa with the N-terminal anti-HER2 antibody which may be p100 or X5 proteins. Additionally, bands were detected at 95kDa with the C-terminal anti-HER2 antibody and these may represent CTF proteins (CTF-611, CTF-687, and CTF-648) which are produced by both alternative translation initiation as well as proteolytic degradation. Finally as exon 16 is only 48bp, skipping of this exon has little effect on the size of the protein therefore it is difficult to estimate which samples express Δ16HER2. The expression profile of Δ16HER2, p100 and X5 in the breast tumors showed different ratios of the HER2 variants among the samples, therefore the mechanisms which might regulate these alternative splicing events needed to be investigated. Previously we have used siRNA screens to identify splicing factors involved in alternative splicing events in MCF7 and JAR cells.Citation23 cDNA from these screens was used with the HER2 specific primers and showed that knockdown of SRSF3 resulted in decreasing levels of the p100 splice variant in all cell lines (data not shown).
These screens were performed in cell lines with low levels of HER2 expression therefore the role of SRSF3 in HER2 splicing was investigated in the HER2 overexpressing SKBR3 cell line. SKBR3 cells were transfected with a siRNA targeting SRSF3 and knockdown was confirmed at 48 hours for SRSF3 mRNA () and at 72 hours for SRSF3 protein (). Resulting effects on HER2 splicing events were determined by using the splice-specific primers as canonical HER2 and Δ16HER2 variants cannot be separated by western blotting due to their similar sizes. Knockdown of SRSF3 resulted in a switch in splicing, increasing intron 15 inclusion (p100), decreasing exon 16 exclusion (Δ16HER2) and increasing exon 15a inclusion (X5) as shown by classical PCR (Supplementary Fig. 1A). This switch was also quantified by real-time PCR (n = 3 ) using the same splice-specific primers and showed that there was a significant increase in p100 and X5 and a significant decrease in Δ16HER2 after knockdown of SRSF3 (). Levels of canonical HER2 mRNA did not appear to change, but as the expression levels of canonical HER2 mRNA were much higher than the other variants the slight changes produced by the switch in splicing may not have been observable in the mRNA expression. In addition the switch in splicing seems to occur between p100 and Δ16HER2 and therefore canonical HER2 mRNA may remain unaffected. A second siRNA targeting SRSF3 was used to confirm to switch in splicing after knockdown of SRSF3 (Supplementary Fig. 1B). This siRNA also resulted in a significant increase in p100 and a significant decrease in Δ16HER2, although unlike the first siRNA there was no change in the X5 variant. Expression of SRSF3 was further investigated in the original cohort of breast tumor samples and did show some variability between different samples (Supplementary Fig. 2).
Figure 4. Effect of the splicing factor SRSF3 on HER2 mRNA transcripts in SKBR3 cells. RNA interference was used to reduce the levels of SRSF3 in SKBR3 cells (SRSF3 (1)). Four controls comprising a positive transfection control (GAPDH siRNA (G)), a negative scrambled sequence control siRNA (NC), a vehicle only control (V) and untreated cells (UT) were also used. Reduction of SRSF3 mRNA was determined at 48 hours by classical PCR (A) and reduction of SRSF3 protein was determined by immunoblotting at 72 hours after transfection (B). (C) Alternative splicing events were measured using splice specific primers by qPCR at 72 hours post-transfection. (mean (n = 3) ± SEM). * P ≤ 0.05, *** P ≤ 0.001.
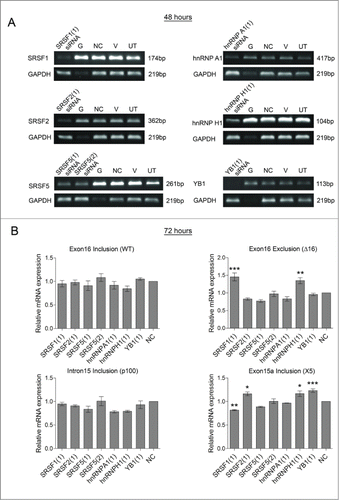
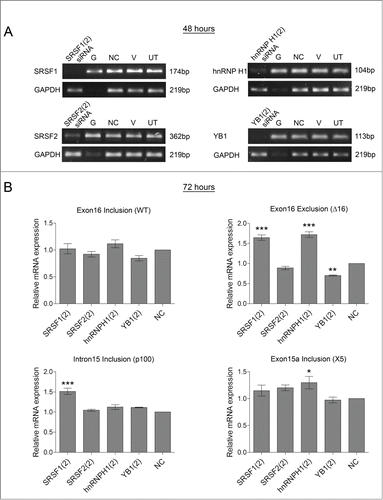
To try and identify more factors involved in splicing within this region of HER2, siRNAs targeting various RNA-binding proteins were screened for their effect on HER2 splicing in the SKBR3 cell line. RNA-binding proteins were selected for the screen which had predicted binding sites within this highly spliced region of HER2 (data not shown). shows the reduction in expression by classical RT-PCR of these selected RNA-binding proteins 48 hours after treatment with their specific siRNAs. The subsequent effects on the HER2 splice variants were determined at 72 hours by real time PCR using the splice-specific primers (). This showed no effect on the splicing of canonical HER2 isoform or p100 HER2 after knockdown of these RNA-binding proteins. However, expression of the Δ16HER2 and the X5 variants were significantly affected by the knockdown of a SRSF1, SRSF2, hnRNP H1 and YB1. Specifically levels of Δ16HER2 mRNA were increased by SRSF1 and hnRNP H1 siRNA and levels of the X5 variant increased with SRSF2, hnRNP H1 and YB1 siRNAs and decreased with SRSF1 siRNA.
Figure 5 . Screening splicing factors for effects on HER2 mRNA transcripts in SKBR3 cells. RNA interference was used to reduce the levels of splicing factors (SRSF1, SRSF2, SRSF5, hnRNP A1, hnRNP H1, and YB1) in SKBR3 cells. Four controls comprising a positive transfection control (GAPDH siRNA (G)), a negative scrambled sequence control siRNA (NC), a vehicle only control (V) and untreated cells (UT) were also used. (A) Reduction of mRNA was determined at 48 hours by classical PCR. (B) HER2 alternative splicing events were measured using splice-specific primers by qPCR at 72 hours post-transfection (mean (n = 3) ± SEM). * P ≤ 0.05, ** P ≤ 0.01, *** P ≤ 0.001.
To confirm these observations a second siRNA for each of these 4 proteins were used to knockdown the splicing factors and determine the effect on the HER2 spliced variants (). Both siRNAs targeting hnRNP H1 resulted in a significant increase in both Δ16HER2 and X5 variants without any effect on the levels of canonical HER2 isoform or p100 HER2. Again the lack of observable change in the canonical HER2 isoform may be due to its high expression levels compared with the other HER2 variants, making small switches in splicing difficult to observe. Δ16HER2 was also significantly upregulated by both of the SRSF1 siRNAs, although knockdown of SRSF1 also affects the levels of hnRNP H1 as both siRNAs targeting SRSF1 resulted in a decrease in hnRNP H1 mRNA (Supplementary Fig. 3). The second siRNA targeting SRSF1 (SRSF1(2)) also reduced the levels of SRSF3 mRNA, possibly resulting in the increase observed with this particular siRNA in the p100 variant. All of the other changes observed were only found with one siRNA and therefore are likely to be off target effects.
Figure 6. Confirming effect of splicing factors on HER2 mRNA transcripts in SKBR3 cells. A second siRNA sequence was used to reduce the levels of splicing factors (SRSF1, SRSF2, hnRNP H1, and YB1) in SKBR3 cells. Four controls comprising a positive transfection control (GAPDH siRNA (G)), a negative scrambled sequence control siRNA (NC), a vehicle only control (V) and untreated cells (UT) were also used. (A) Reduction of mRNA was determined at 48 hours by classical PCR. (B) HER2 alternative splicing events were measured using splice-specific primers by qPCR at 72 hours post-transfection (mean (n = 3) ± SEM). * P ≤ 0.05, ** P ≤ 0.01, *** P ≤ 0.001.
Since SRSF3 and hnRNP H1 appear to be involved in the control of these splicing events RNA immunoprecipitation was performed with anti-SRSF3 and anti-hnRNP H1 antibodies to demonstrate binding of their target proteins to the HER2 pre-mRNA transcript (). Both antibodies showed enrichment of the transcript with SRSF3 in particular showing strong binding with 577.63 fold enrichment over the control antibody.
Figure 7. Identification of RNA binding proteins bound to the splicing hotspot of HER2. (A) Binding of splicing factors to endogenous HER2 mRNA (exons exon16-exon17/18) and pre-mRNA (exon11-intron11) was determined by RNA immunoprecipitation using antibodies that target SRSF3 and hnRNP H1. Fold enrichment of target mRNA was determined by qPCR. (B) DNA oligonucleotides were designed to cover the regions surrounding exon 15 (B) and exon 16 (C). A further oligonucleotide was designed which is identical to oligonucleotide H3 apart from having 2 potential SRSF3 binding sites mutated. RNase-assisted RNA chromatography was carried out on RNA produced by the oligonucleotides along with a control (CT) where no RNA was added to the beads. Immunoblotting was performed with the RNase treated supernatant using antibodies against SRSF3, and hnRNP H1 and nuclear protein extract (NE) was included as a positive control.
Further confirmation of the binding of these 2 proteins to HER2 mRNA as well as pinpointing more defined regions to which they bind was achieved by using RNase-assisted RNA chromatography.Citation22 DNA oligonucleotides were initially designed to cover the region surrounding the p100 splice site (), including one oligonucleotide covering the beginning of intron 15 (H1) and 2 oligonucleotides covering exon 15 (H2 and H3). Two potential SRSF3 binding sites within H3 were also mutated as SRSF3 siRNA produced the strongest effect on the p100 variant (Intron 15 inclusion) and these 2 binding sites are located close to this splice site. RNA was synthesized from these oligonucleotides before being bound to adipic acid dihydrazide beads and protein extract. Proteins bound to RNA were collected by RNase treatment before electrophoretic separation. A control of beads and protein only (without RNA) was used to identify non-specific binding. Although some proteins do bind to the beads in the control there are no proteins released in the RNase supernatant (Supplementary Fig. 4A and B), as the only bands present are the RNases (20kDa band). A combination of mass spectrometry and protein gel blotting were then used to identify proteins bound to this region.
Immunoblotting with the RNase supernatant demonstrated binding of hnRNP H1 to the H2 RNA oligonucleotide which covers the beginning of exon15 (). The hnRNP H1 antibody detects 2 bands in the western blot but only the top band is hnRNP H1 as this is the only band reduced after hnRNP H1 siRNA treatment (Supplementary Fig. 4C). RNA interference using hnRNP F-specific siRNAs confirmed that the lower band is hnRNP F (Supplementary Fig. 4C)-hnRNP H1 and hnRNP F are highly homologous proteins. Immunoblotting was also performed using an anti-SRSF3 antibody and showed SRSF3 binding to H1 and H3 RNA oligonucleotides which cover the end of exon 15 and the beginning of intron 15 and overlap at a potential SRSF3 binding site (). Additionally, the deletion of the 2 SRSF3 binding sites on H3 (H3Δ) completely abolished the binding of SRSF3 to this RNA oligonucleotide.
DNA oligonucleotides were also designed to cover the region surrounding exon 16 () and include an oligonucleotide covering exon 16 (H4) and oligonucleotides covering the surrounding introns (H5 and H6). RNase-assisted chromatography followed by immunoblotting with an anti-SRSF3 antibody demonstrated binding of SRSF3 to exon 16 (H4) as well as the introns immediately upstream (H5) and downstream (H6) of exon 16. hnRNP H1 also bound to sequences in the region but its binding was restricted to the introns surrounding exon 16 (H5 and H6), with particularly strong binding to intron 16.
Additional proteins that bind to the regions were identified by mass spectrometry of protein bands produced by the RNase supernatant (Supplementary Fig. 4A and B). RNAs produced from the oligonucleotides showed multiple protein bands binding to them. Some of these proteins appear in all 6 lanes and therefore appear to be nonspecific binding to RNA, other bands appear to be specific for a particular oligonucleotide. A selection of these specific bands were identified by mass spectrometry and confirmed by immunoblotting. Some additional RNA-binding proteins were also identified by immunoblotting of the RNase supernatant. Proteins identified included PTBP1 which bound to H1 (intron 15) and H5 (intron 15), hnRNP A1 which bound to H2 (exon 15), H4 (exon 16), H5 (intron 15) and H6 (intron 16) and hnRNP K which bound to H4 (exon 16) and H6 (intron 16). A number of hnRNPs (A/B, A2/B1 and D) were also found to bind to RNA produced from the 3 oligonucleotides surrounding exon 16 (H4, H5 and H6).
Discussion
Here we demonstrate that RNA transcripts for canonical HER2, Δ16HER2, p100 and X5 can occur collectively within the same tumor sample, but potentially more significantly they can be present in varying ratios. Immunoblotting also confirmed the presence of different HER2 variants within different tumor samples. Some discrepancies did occur between mRNA and protein expression and may be due to either the heterogeneous nature of invasive breast tumors or differences in post-transcriptional or post-translational processes. Many of the HER2 variants currently characterized have been shown to be functionally different to each other as well as to canonical HER2. For example the secreted variants p100 and herstatin function as inhibitors of HER2 signaling and inhibit transformation,Citation10-12 whereas CTF-611 (p95) and Δ16HER2 can form constitutively active homodimers and have been found to be highly oncogenic variants.Citation13-21 Therefore the variations observed in HER2 variants may be clinically relevant, particularly as some of these truncated HER2 variants were expressed at fairly high levels sometimes showing equal or even stronger expression than canonical HER2.
The two HER2 antibodies used in this study detected a large number of bands, all of which were confirmed to be HER2 proteins by RNA interference. A number of bands corresponded to known variants, but there other bands at sizes where no known HER variant has been described. These new variants may also possess different properties to canonical HER2. Therefore future identification and characterization of these variants is important to fully understand HER2 biology within tumors.
Results presented here demonstrate that SRSF3 plays a central role in regulating the production of different splice variants within this region of the HER2 transcript. The switch in splicing in the presence of SRSF3 from p100 which is an inhibitor of tumor cell proliferation and oncogenic signalingCitation11 to the highly tumorigenic Δ16HER2Citation13-18 is likely to increase malignant transformation. This observed switch is consistent a previous report which described SRSF3 as a proto-oncogene.Citation24 SRSF3 has been shown to have increased expression in a range of different cancers including breast cancer.Citation24,25 SRSF3 expression in breast cancer has also been shown to be associated with tumor progression and a poorer prognosis.Citation24 Additionally, loss of SRSF3 had consistently been found to cause growth arrest by preventing cell cycle progression as well as increasing apoptosis.Citation24-26 Conversely, overexpression of SRSF3 is able to promote cell transformation and is able to induce tumor formation and maintenance in nude mice.Citation24
Through the use of RNA chromatography we have demonstrate binding of SRSF3 to RNA corresponding to exon 15 and intron 15 and more specifically identified 2 binding sites within exon 15 required for SRSF3 binding. Binding of SRSF3 to these exon splicing enhancer sites (ESE) may therefore inhibit production of the p100 variant through the recruitment of the spliceosome to this 5′ splice site therefore preventing intron inclusion. We were also able to demonstrate the SRSF3 bound to regions surrounding exon 16. This binding may be mediated through the 3 predicted SRSF3 binding sites within this region which are located in the region where H4 and H5 overlap and in the middle of the H6 oligonucleotide (2 binding sites). Although SRSF3, like most SR proteins, is traditionally thought of as a splicing enhancer, it has also been shown to bind to and silence the splicing of exons such as exon i9 within p53.Citation27 Another interesting possibility is that the binding sites within exon 15 may also control the splicing of exon 16, as SRSF3 has been shown in Caspase2 mRNA to cause the skipping of an exon (exon 9) by binding to ESS in an upstream exon (exon 8).Citation28 Therefore SRSF3 may promote the proximal splice site selection and inhibit distal splice site selection.
HnRNP H1 was also identified as a regulator of splicing within this region, significantly changed 2 of the 3 variants. Although currently the functional properties of the X5 variant are unknown, the increase observed in the oncogenic Δ16HER2 variant after knockdown of hnRNP H1 would indicate that loss of this splicing factor may trigger a more oncogenic phenotype. Evidence for the role of hnRNP H1 in cancer development is so far fairly mixed. On the one hand some studies have shown hnRNP H1 is overexpressed in some cancers implicating it in the process of malignant transformation,Citation29,30 however Hope et al have shown that in colorectal cancer strong nuclear hnRNP H1 staining was associated with increased patient survival.Citation31 hnRNP H1 has also been shown to regulate the splicing of cancer associated genes including genes involved in the regulation of apoptosis.Citation32 The action of hnRNP H1 remains complex since it is able to up regulate both anti-apoptotic isoforms such as MADDCitation30 as well as pro-apoptotic splice variants such as Bcl−xS.Citation33
The effect of hnRNP H1 on these 2 splicing events but not on the splicing of p100 which is positioned in the middle seems to indicate that hnRNP H1 may regulate these splicing events separately. hnRNP H1 has previously been shown to be able to both inhibit as well as promote the use of a splice site, with its activity often dependent on the location of its binding site. In general binding of hnRNP H1 to intronic regions particularly in the region downstream of the 5′ splice site usually results in enhance use of the splice site.Citation34,35 This is a possible mechanism by which hnRNP H1 increases the inclusion of exon 16 as RNA chromatography demonstrated hnRNP H1 binding to the introns surrounding exon 16 with particularly strong binding to intron 16. Indeed there are predicted binding sites for hnRNP H1 in introns 15 and 16 in the regions covered by H5 and H6 oligonucleotides. On the other hand when hnRNP H1 binds to exonic regions it usually acts as a silencer resulting in exon skipping.Citation30,35 As hnRNP H1 appears to increase exclusion of exon 15a this may be the mechanism by which the X5 variant is regulated. Despite hnRNP H1 not appearing to effect the splicing of p100 variant it was found to bind to H2 RNA, possibly at a predicted binding site within this RNA right at the start of exon 15. Whether or not this binding is important for the regulation of splicing within this region remains to be determined. Of course the binding of hnRNP H1 to this region may not be related to its splicing activity but to another function such as enhancing alternative polyadenylation. hnRNP H1 in particular but also other splicing factors such as SRSF3 have been implicated stimulation of alternative cleavage and polyadenylation.Citation36-38
hnRNP F and H1 are closely related proteins that bind to very similar sequences (usually G tracts). Therefore the identification of hnRNP F by mass spectrometry on the same RNA that hnRNP H1 binds to is unsurprising. Previously these 2 proteins have been shown to bind to the same region and have similar effects on splicing, indicating hnRNP F may also be involved in the regulation of this region. Binding of other members of the hnRNP H/F family to hnRNP H1 binding sites may also be able to partially compensate for the loss of hnRNP H1, therefore greater changes in spicing may be observed when more members of the family are reduced.
Although silencing of SRSF1 did affect the splicing within this region the effects observed appear to be mediated through other splicing factors. Firstly the second siRNA targeting SRSF1 (SRSF1(2) siRNA) also reduced SRSF3 mRNA to a similar level to that observed with SRSF3 targeted siRNA. This is likely to be an off target effects of this siRNA as SRSF3 was unaffected by the other siRNA targeting SRSF1. In addition both of the siRNA that targeted SRSF1 resulted in reductions in the levels of hnRNP H1, possibly resulting in the increases observed in the Δ16HER2 variant. Although the reductions may be due to off target effects of the siRNAs it is more likely that SRSF1 is involved in the regulation of hnRNP H1 as both siRNAs had the same affect. Many splicing factor have been shown to regulated themselves as well as each other, therefore it is highly likely that SRSF1 is involved in some form of regulation of hnRNP H1 mRNA.Citation39
This study demonstrates the key roles that SRSF3 and hnRNP H1 play in regulating this important splicing hotspot within HER2. Particularly the oncogene SRSF3 which switches the splicing of HER2 mRNA from the p100 variant to the oncogenic Δ16HER2 variant.
Disclosure of Potential Conflicts of Interest
No potential conflicts of interest were disclosed.
Supplemental_Figures.zip
Download Zip (1.9 MB)Acknowledgments
We would like to acknowledge Prof Gary Black and Dr Andrew Porter (Northumbria University) for performing the Mass spectrometry experiments.
Funding
This project was funded by the Royal Victoria Infirmary Breast Cancer Appeal.
Supplemental Material
Supplemental data for this article can be accessed on the publisher's website.
Related Research Data
References
- Slamon DJ, Godolphin W, Jones LA, Holt JA, Wong SG, Keith DE, Levin WJ, Stuart SG, Udove J, Ullrich A, et al. Studies of the HER-2/neu proto-oncogene in human breast and ovarian cancer. Science 1989; 244:707-12; http://dx.doi.org/10.1126/science.2470152
- Bartsch R, Wenzel C, Steger GG. Trastuzumab in the management of early and advanced stage breast cancer. Biologics 2007; 1:19-31.
- Romond EH, Perez EA, Bryant J, Suman VJ, Geyer CE, Jr., Davidson NE, Tan-Chiu E, Martino S, Paik S, Kaufman PA, et al. Trastuzumab plus adjuvant chemotherapy for operable HER2-positive breast cancer. N Engl J Med 2005; 353:1673-84; PMID:16236738; http://dx.doi.org/10.1056/NEJMoa052122
- Vogel CL, Cobleigh MA, Tripathy D, Gutheil JC, Harris LN, Fehrenbacher L, Slamon DJ, Murphy M, Novotny WF, Burchmore M, et al. Efficacy and safety of trastuzumab as a single agent in first-line treatment of HER2-overexpressing metastatic breast cancer. J Clin Oncol 2002; 20:719-26; PMID:11821453; http://dx.doi.org/10.1200/JCO.20.3.719
- Dittrich A, Gautrey H, Browell D, Tyson-Capper A. The HER2 Signaling Network in Breast Cancer-Like a Spider in its Web. J Mammary Gland Biol Neoplasia 2014; 19(3–4):253-70; PMID:25544707
- Graus-Porta D, Beerli RR, Daly JM, Hynes NE. ErbB-2, the preferred heterodimerization partner of all ErbB receptors, is a mediator of lateral signaling. EMBO J 1997; 16:1647-55; PMID:9130710; http://dx.doi.org/10.1093/emboj/16.7.1647
- Tzahar E, Waterman H, Chen X, Levkowitz G, Karunagaran D, Lavi S, Ratzkin BJ, Yarden Y. A hierarchical network of interreceptor interactions determines signal transduction by Neu differentiation factor/neuregulin and epidermal growth factor. Mol Cell Biol 1996; 16:5276-87; PMID:8816440
- Pinkas-Kramarski R, Soussan L, Waterman H, Levkowitz G, Alroy I, Klapper L, Lavi S, Seger R, Ratzkin BJ, Sela M, et al. Diversification of Neu differentiation factor and epidermal growth factor signaling by combinatorial receptor interactions. EMBO J 1996; 15:2452-67; PMID:8665853
- Jackson C, Browell D, Gautrey H, Tyson-Capper A. Clinical Significance of HER-2 Splice Variants in Breast Cancer Progression and Drug Resistance. Int J Cell Biol 2013; 2013:973584; PMID:23935627; http://dx.doi.org/10.1155/2013/973584
- Doherty JK, Bond C, Jardim A, Adelman JP, Clinton GM. The HER-2/neu receptor tyrosine kinase gene encodes a secreted autoinhibitor. Proc Natl Acad Sci U S A 1999; 96:10869-74; PMID:10485918; http://dx.doi.org/10.1073/pnas.96.19.10869
- Aigner A, Juhl H, Malerczyk C, Tkybusch A, Benz C, Czubayko F. Expression of a truncated 100 kDa HER2 splice variant acts as an endogenous inhibitor of tumour cell proliferation. Oncogene 2001; 20:2101-11; PMID:11360194; http://dx.doi.org/10.1038/sj.onc.1204305
- Scott GK, Robles R, Park JW, Montgomery PA, Daniel J, Holmes WE, Lee J, Keller GA, Li WL, Fendly BM, et al. A truncated intracellular HER2/neu receptor produced by alternative RNA processing affects growth of human carcinoma cells. Mol Cell Biol 1993; 13:2247-57; PMID:8096058
- Siegel PM, Ryan ED, Cardiff RD, Muller WJ. Elevated expression of activated forms of Neu/ErbB-2 and ErbB-3 are involved in the induction of mammary tumors in transgenic mice: implications for human breast cancer. EMBO J 1999; 18:2149-64; PMID:10205169; http://dx.doi.org/10.1093/emboj/18.8.2149
- Kwong KY, Hung MC. A novel splice variant of HER2 with increased transformation activity. Mol Carcinog 1998; 23:62-8; PMID:9808159; http://dx.doi.org/10.1002/(SICI)1098-2744(199810)23:2%3c62::AID-MC2%3e3.0.CO;2-O
- Mitra D, Brumlik MJ, Okamgba SU, Zhu Y, Duplessis TT, Parvani JG, Lesko SM, Brogi E, Jones FE. An oncogenic isoform of HER2 associated with locally disseminated breast cancer and trastuzumab resistance. Mol Cancer Ther 2009; 8:2152-62; PMID:19671734; http://dx.doi.org/10.1158/1535-7163.MCT-09-0295
- Castiglioni F, Tagliabue E, Campiglio M, Pupa SM, Balsari A, Menard S. Role of exon-16-deleted HER2 in breast carcinomas. Endocr Relat Cancer 2006; 13:221-32; PMID:16601290; http://dx.doi.org/10.1677/erc.1.01047
- Marchini C, Gabrielli F, Iezzi M, Zenobi S, Montani M, Pietrella L, Kalogris C, Rossini A, Ciravolo V, Castagnoli L, et al. The human splice variant Delta16HER2 induces rapid tumor onset in a reporter transgenic mouse. PLoS One 2011; 6:e18727; PMID:21559085; http://dx.doi.org/10.1371/journal.pone.0018727
- Alajati A, Sausgruber N, Aceto N, Duss S, Sarret S, Voshol H, Bonenfant D, Bentires-Alj M. Mammary tumor formation and metastasis evoked by a HER2 splice variant. Cancer Res 2013; 73:5320-7; PMID:23867476; http://dx.doi.org/10.1158/0008-5472.CAN-12-3186
- Anido J, Scaltriti M, Bech Serra JJ, Santiago Josefat B, Todo FR, Baselga J, Arribas J. Biosynthesis of tumorigenic HER2 C-terminal fragments by alternative initiation of translation. EMBO J 2006; 25:3234-44; PMID:16794579; http://dx.doi.org/10.1038/sj.emboj.7601191
- Pedersen K, Angelini PD, Laos S, Bach-Faig A, Cunningham MP, Ferrer-Ramon C, Luque-García A, García-Castillo J, Parra-Palau JL, Scaltriti M, et al. A naturally occurring HER2 carboxy-terminal fragment promotes mammary tumor growth and metastasis. Mol Cell Biol 2009; 29:3319-31; PMID:19364815; http://dx.doi.org/10.1128/MCB.01803-08
- Ward TM, Iorns E, Liu X, Hoe N, Kim P, Singh S, Dean S, Jegg AM, Gallas M, Rodriguez C, et al. Truncated p110 ERBB2 induces mammary epithelial cell migration, invasion and orthotopic xenograft formation, and is associated with loss of phosphorylated STAT5. Oncogene 2013; 32:2463-74; PMID:22751112; http://dx.doi.org/10.1038/onc.2012.256
- Michlewski G, Caceres JF. RNase-assisted RNA chromatography. RNA (New York, NY) 2010; 16:1673-8; http://dx.doi.org/10.1261/rna.2136010
- Gautrey HL, Tyson-Capper AJ. Regulation of Mcl−1 by SRSF1 and SRSF5 in cancer cells. PLoS One 2012; 7:e51497; PMID:23284704; http://dx.doi.org/10.1371/journal.pone.0051497
- Jia R, Li C, McCoy J, Deng C, Zheng Z. SRp20 is a proto-oncogene critical for cell proliferation and tumor induction and maintenance. Int J Biol Sci 2010; 6:806-26; PMID:21179588; http://dx.doi.org/10.7150/ijbs.6.806
- He X, Arslan AD, Pool MD, Ho TT, Darcy KM, Coon JS, Beck WT. Knockdown of splicing factor SRp20 causes apoptosis in ovarian cancer cells and its expression is associated with malignancy of epithelial ovarian cancer. Oncogene 2011; 30:356-65; PMID:20856201; http://dx.doi.org/10.1038/onc.2010.426
- Kurokawa K, Akaike Y, Masuda K, Kuwano Y, Nishida K, Yamagishi N, Kajita K, Tanahashi T, Rokutan K. Downregulation of serine/arginine-rich splicing factor 3 induces G1 cell cycle arrest and apoptosis in colon cancer cells. Oncogene 2014; 33:1407-17; PMID:23503458; http://dx.doi.org/10.1038/onc.2013.86
- Tang Y, Horikawa I, Ajiro M, Robles AI, Fujita K, Mondal AM, Stauffer JK, Zheng ZM, Harris CC. Downregulation of splicing factor SRSF3 induces p53beta, an alternatively spliced isoform of p53 that promotes cellular senescence. Oncogene 2013; 32:2792-8; PMID:22777358; http://dx.doi.org/10.1038/onc.2012.288
- Jang HN, Lee M, Loh TJ, Choi SW, Oh HK, Moon H, Cho S, Hong SE, Kim do H, Sheng Z, et al. Exon 9 skipping of apoptotic caspase-2 pre-mRNA is promoted by SRSF3 through interaction with exon 8. Biochim Biophys Acta 2014; 1839:25-32; PMID:24321384; http://dx.doi.org/10.1016/j.bbagrm.2013.11.006
- Honore B, Baandrup U, Vorum H. Heterogeneous nuclear ribonucleoproteins F and H/H' show differential expression in normal and selected cancer tissues. Exp Cell Res 2004; 294:199-209; PMID:14980514; http://dx.doi.org/10.1016/j.yexcr.2003.11.011
- Lefave CV, Squatrito M, Vorlova S, Rocco GL, Brennan CW, Holland EC, Pan YX, Cartegni L. Splicing factor hnRNPH drives an oncogenic splicing switch in gliomas. EMBO J 2011; 30:4084-97; PMID:21915099; http://dx.doi.org/10.1038/emboj.2011.259
- Hope NR, Murray GI. The expression profile of RNA-binding proteins in primary and metastatic colorectal cancer: relationship of heterogeneous nuclear ribonucleoproteins with prognosis. Hum Pathol 2011; 42:393-402; PMID:21194727; http://dx.doi.org/10.1016/j.humpath.2010.08.006
- Venables J, Koh C, Froehlich U, Lapointe E, Couture S, Inkel L, Bramard A, Paquet ER, Watier V, Durand M, et al. Multiple and specific mRNA processing targets for the major human hnRNP proteins. Mol Cell Biol 2008; 28:6033-43; PMID:18644864; http://dx.doi.org/10.1128/MCB.00726-08
- Garneau D, Revil T, Fisette JF, Chabot B. Heterogeneous nuclear ribonucleoprotein F/H proteins modulate the alternative splicing of the apoptotic mediator Bcl−x. J Biol Chem 2005; 280:22641-50; PMID:15837790; http://dx.doi.org/10.1074/jbc.M501070200
- Wang E, Aslanzadeh V, Papa F, Zhu H, de la Grange P, Cambi F. Global Profiling of Alternative Splicing Events and Gene Expression Regulated by hnRNPH/F. PLoS ONE 2012; 7:e51266.
- Xiao X, Wang Z, Jang M, Nutiu R, Wang ET, Burge CB. Splice site strength-dependent activity and genetic buffering by poly-G runs. Nat Struct Mol Biol 2009; 16:1094-100; PMID:19749754; http://dx.doi.org/10.1038/nsmb.1661
- Millevoi S, Decorsiere A, Loulergue C, Iacovoni J, Bernat S, Antoniou M, Vagner S. A physical and functional link between splicing factors promotes pre-mRNA 3′ end processing. Nucleic Acids Res 2009; 37:4672-83; PMID:19506027; http://dx.doi.org/10.1093/nar/gkp470
- Millevoi S, Vagner S. Molecular mechanisms of eukaryotic pre-mRNA 3′ end processing regulation. Nucleic Acids Res 2010; 38:2757-74; PMID:20044349; http://dx.doi.org/10.1093/nar/gkp1176
- Lou H, Neugebauer KM, Gagel RF, Berget SM. Regulation of alternative polyadenylation by U1 snRNPs and SRp20. Mol Cell Biol 1998; 18:4977-85; PMID:9710581
- Huelga SC, Vu AQ, Arnold JD, Liang TY, Liu PP, Yan BY, Donohue JP, Shiue L, Hoon S, Brenner S, et al. Integrative genome-wide analysis reveals cooperative regulation of alternative splicing by hnRNP proteins. Cell Rep 2012; 1:167-78; PMID:22574288; http://dx.doi.org/10.1016/j.celrep.2012.02.001