
ABSTRACT
hnRNPs are polyvalent RNA binding proteins that have been implicated in a range of regulatory roles including splicing, mRNA decay, translation, and miRNA metabolism. A variety of genome wide studies have taken advantage of methods like CLIP and RIP to identify the targets and binding sites of RNA binding proteins. However, due to the complex nature of RNA-binding proteins, these studies are incomplete without assays that characterize the impact of RBP binding on mRNA target expression. Here we used a suite of high-throughput approaches (RIP-Seq, iCLIP, RNA-Seq and shotgun proteomics) to provide a comprehensive view of hnRNP H1s ensemble of targets and its role in splicing, mRNA decay, and translation. The combination of RIP-Seq and iCLIP allowed us to identify a set of 1,086 high confidence target transcripts. Binding site motif analysis of these targets suggests the TGGG tetramer as a prevalent component of hnRNP H1 binding motif, with particular enrichment around intronic hnRNP H1 sites. Our analysis of the target transcripts and binding sites indicates that hnRNP H1s involvement in splicing is 2-fold: it directly affects a substantial number of splicing events, but also regulates the expression of major components of the splicing machinery and other RBPs with known roles in splicing regulation. The identified mRNA targets displayed function enrichment in MAPK signaling and ubiquitin mediated proteolysis, which might be main routes by which hnRNP H1 promotes tumorigenesis.
Introduction
RNA binding proteins regulate a series of integrated processes that begin while the RNA is still being transcribed. This diverse range of activities includes splicing, capping, polyadenylation, mRNA localization, and translation. The most recent compilation of RBPs in the human genome estimated circa 1,500 proteins.Citation1 As expected based on their multiple functions and versatile binding, RBPs form a highly diverse group of proteins. This is the case for the heterogeneous nuclear ribonucleoprotein (hnRNP) family, which consists of 20 proteins named hnRNP A-U. The biological functions exerted by the hnRNPs depend mostly on interactions between distinct hnRNP members and other proteins. Although the most well-known function of the family is direct involvement in alternative splicing events,Citation2-4 they also participate in telomere maintenance, transcription, polyadenylation, mRNA trafficking, mRNA degradation, and translational regulation.Citation2 Domain composition among hnRNP members is highly diverse. Some show classical RRM or KH domains,Citation3 while hnRNP H1, hnRNP H2 and hnRNP F exhibit the so called quasi-RRMs (or qRRM) domains.Citation3,5
In this study, we deeply characterize hnRNP H1. This protein tends to form a heterodimer with hnRNP F and shows preference for G-rich tracts of RNA.Citation2,6-8 It has also been shown that hnRNP H1 interacts with the DGCR8 complex and facilitates microRNA processing in HeLa cells.Citation9 The impact of hnRNP H1 binding on alternative splicing has been associated with several diseases, such as cystic fibrosis,Citation10 congenital myasthemic syndrome,Citation11 and amyotrophic lateral sclerosis (ALS).Citation12 Likewise, it has been shown that hnRNP H1 plays a critical role in cancer. In human hepatocellular carcinoma (HCC) cell lines, up-regulation of hnRNP H1 together with other splicing factors, such as CUGBP1, leads to exon skipping within the insulin receptor (IR) pre-mRNA. Dysregulation of IR splicing results in overexpression of an isoform which promotes cell proliferation.Citation13 High levels of hnRNP H1 have been linked also to glioblastoma development via increased expression of a Raf isoform (A-Raf) which results in apoptosis inhibition.Citation14 Other studies have linked hnRNP H1-mediated exon skipping of the RON mRNA to tumor migration and invasion,Citation15 and similarly hnRNP H1 activity has been shown to regulate the splicing of the IG20 mRNA, shifting the balance between the pro-apoptotic isoform (IG20) and the anti-apoptotic isoform (MADD/DENN) in glioblastoma cells.Citation15 Intron retention events have also been ascribed to the activities of hnRNP H1, such as the negative feedback control of the rpL3 and U11-48K pre-mRNAs.Citation16,17 In both cases, hnRNP H1-mediated alternative splicing causes the retention of introns containing premature termination codons (PTC). The presence of the PTC in the transcript decreases its stability and leads to its degradation by the nonsense-mediated decay pathway.Citation16,17 Moreover, hnRNP H1 has been associated with leukemia chemo-resistance via its impact on thymidine phosphorylase (TP) splicing.Citation18
In addition to these targeted analyses, genome-wide studies have revealed hnRNP H1s role, in conjunction with hnRNP F, in promoting both exon inclusion and skipping.Citation8 Other recent studies have linked hnRNP H1 to alternative cleavage and polyadenylation,Citation6 and established the cooperative roles of the hnRNP proteins in the regulation of splicing.Citation2 By employing a combined strategy with 4 different high-throughput approaches, we were able to provide a more refined and accurate picture for hnRNP H1 in splicing regulation and extend our understanding of its participation in polyadenylation and mRNA decay. Moreover, our examination of the hnRNP H1 target set has uncovered its role as a key regulator of RNA processing genes and identified novel routes by which it may contribute to cancer development and diseases.
Results and discussion
Identification of target transcripts and binding sites
Our ability to profile RBPs has improved dramatically in the last decade with the advent of high throughput approaches such as RIP, CLIP and RNA compete.Citation19-21 En masse characterization of targets, target sites and binding motifs has been described for a selected set of RBPs in a range of organisms.Citation22-24 Unfortunately, due to the complex nature of RBP-mediated regulation, studies employing only a single method fall short on providing a clear assessment of RBP function, as discussed in.Citation25 Effective analyses must therefore combine binding assays with strategies to verify their functional outcomes.Citation26
To identify a high-confidence set of RNA species associated with hnRNP H1, we combined 2 distinct high-throughput approaches: iCLIP and a modified RIP-Seq method devised by our lab (see Citation26 for detailed protocol). Although both methods are based on RNP immuno-precipitation, the protocols are substantially different and complement each other. RIP-Seq is a more sensitive assay. Its less stringent washing retains more interactions, but at the expense of higher false positives and RNAs recovered via indirect associations (it is for this reason that an IgG control is often employed in RIP-Seq experiments). In contrast, the cross-linking step and more stringent washing in iCLIP provides greater specificity, as well as much higher resolution, but is more likely to miss interactions. By combining both assays, we can identify transcripts that show enrichment for hnRNP H1 RIP-Seq reads over the control, as well as high-resolution, high-confidence (relative to the RIP-Seq) iCLIP sites. Both assays identified a large number of targets, i.e. 3924 and 3373 with RIP-Seq and iCLIP, respectively (sites/targets with p < 0.01, as determined by Piranha –see methods). To derive a high-confidence target set, we required support from both iCLIP and RIP-Seq datasets, resulting in 1086 common RNA species. The full list of iCLIP, RIP-Seq and consensus targets is reported in Table S1). The agreement between the methods is significant (p < 1.91 × 10⁻¹⁰, Fisher's exact test), and higher than observed in previous comparisons.Citation27 RIP-Seq targets that were absent in the iCLIP data tend to be transcripts with low expression levels (data not shown), confirming our expectation that RIP-Seq is the more abundance-sensitive method with higher coverage than iCLIP. Besides interactions with mRNAs and pre-mRNAs, we identified 2 miRNAs as putative hnRNP H1 targets (miR-612 and miR-3652), and 12 long non-coding RNAs (NEAT1, SNHG3, MALAT1, FTX, SNHG4, TUG1, HOTAIRM1, GNAS-AS1, MIR22HG, BDNF-AS, OIP5-AS1, MIR17HG). However, the consequence to the function and expression of these transcripts requires further investigation.
Binding site characteristics
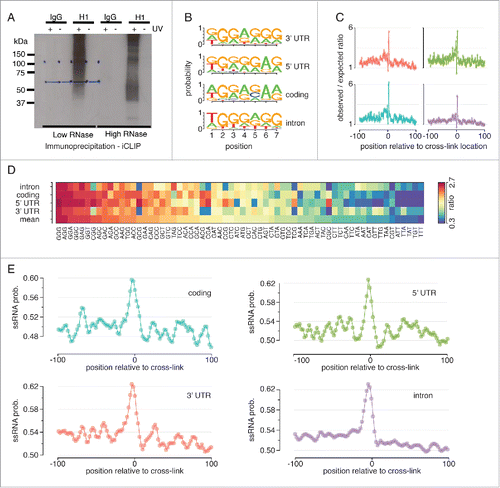
The high precision of the iCLIP data allows us to closely investigate the properties of the hnRNP H1 binding site. We performed de novo motif discovery within a 100nt window around all significant iCLIP sites identified. shows the most highly enriched motifs around the hnRNP H1 iCLIP sites in 3′UTR, 5′UTR, coding sequence and introns. Individual studies of hnRNP H1 function in specific examples of splicing have identified functional sites as containing either a poly-G run of varying length,Citation16 or the tetramer (T/G)GGG.Citation15 Genome-wide profiles have favored the former, correlating longer poly-G stretches with more confident changes in splicing,Citation6 and interspersion or termination of the binding site by adenosine.Citation2 Our data, however, is supportive of the TGGG tetramer as a prevalent component of the hnRNP H1 binding motif, with particular enrichment in intronic regions. When we looked for occurrences of these motifs around the iCLIP cross-link locations however, we noticed that enrichment was quite diffuse (data not shown), with no strong enrichment right at the iCLIP site. This is likely due to a combination of a uracil-poor binding motif and the preference of iCLIP to cross-link at triple-uracil,Citation28 meaning that the binding sites are displaced from the cross-link location. This offset between the cross-link site and the start of the binding site can be due to energy preferences of the ribonucleo-protein complex and can be a source of bias in the data.Citation28,29 Cautious of this, we also computed the enriched-over-expected ratio for the triple-G repeat at each position within a 100nt window of the cross-link location, using a set of iCLIP data sets for other proteins to estimate the expected number of occurrences (list provided in supplementary methods). This showed that the triple-G repeat was strongly enriched at the cross-link location (). Correcting for CLIP-seq biases in motif finding using a set of unrelated RBPs has been successfully applied to PAR-CLIP data.Citation30 Here we showed that using the same procedure could also help to correct for such biases in iCLIP data. We also calculated this ratio for all other trimers, and ranked them based on their maximum enrichment in a 3nt window centered on the cross-link location, again establishing the triple-G repeat as the strongest enrichment and confirming this as the core of the hnRNP H1 binding site (). Although we did not see stark variation in the putative primary sequence of the hnRNP H1 binding site in different regions of the mRNA, we did note some minor variation. In particular, the most enriched motif in coding regions was more variable than that in intronic regions, where the consensus TGGG(A/G)G dominated. We further explored the sequence at iCLIP cross-link locations with respect to RNA secondary structure, noting a preference for single stranded RNA at cross-link locations (). This is consistent with expectations based on hnRNP H1s RNA binding domains.Citation31 This structural preference is present across all of the different mRNA regions profiled, and is likely a requirement of the RBP, to provide access to its binding site.
Figure 1. Characterization of the hnRNP H1 binding site. (A) Autoradiograph showing radioactively labeled hnRNP H1 protein–RNA complexes after immunoprecipitation using anti-hnRNP H1 antibody. Normal rabbit IgG was used as negative control. (B) The top motifs identified by de novo motif finding around hnRNP H1 iCLIP sites in 3′UTR, 5′UTR, coding-sequence and intronic contexts (C) The observed/expected ratio of triple-G occurrences around hnRNP H1 iCLIP sites. Expected counts were estimated from a set iCLIP datasets for other RNA binding proteins (see methods). (D) The observed/expected ratio of trimers around hnRNP H1 iCLIP sites. Expected counts computed as in C. (E) Probability of RNA adopting single-stranded conformation around hnRNP H1 iCLIP sites.
hnRNP H1 targets are strongly enriched for spliceosome-associated genes
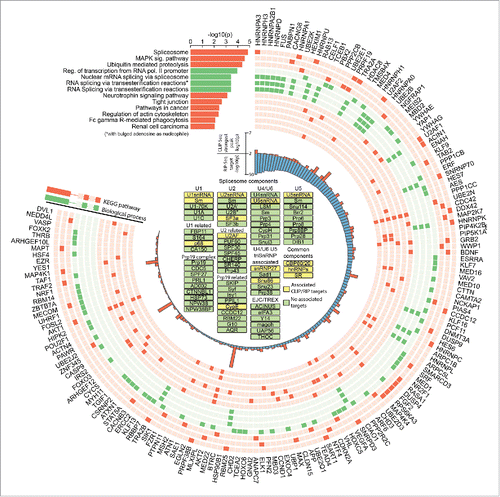
RNA species identified in both the RIP-Seq and iCLIP data show enrichment for transcripts encoding splicing related proteins (p < 1.35 × 10⁻⁵). The p-value is from DAVID,Citation32 and has been corrected for multiple hypothesis testing. shows a comprehensive list of enriched pathways. Several major regulators of mRNA processing have been identified as targets, notably several hnRNPs and SRSFs, hTra2, FUS and TDP43. Interestingly, it has been previously shown that TDP43 and hnRNP H1 act as partners to regulate apolipoprotein A-II (apoA-II) and Cystic Fibrosis Transmembrane Conductance Regulator (CFTR) splicing.Citation10,33 Two other biological functions stood out in our analysis: MAPK signaling and ubiquitin mediated proteolysis. Both pathways are highly linked to tumorigenesis, agreeing with the described role for hnRNP H1 in glioma.Citation15 The MAPK pathway encompasses key signaling components and phosphorylation events that transmit extracellular signals modulating cell growth, differentiation, proliferation, apoptosis and migration. Targeting MAPK signaling is currently being tested as a cancer treatment (reviewed in Citation34). Ubiquitin mediated proteolysis has been implicated in a large variety of human diseases, including cancer. The ubiquitin proteolytic pathway is implicated in the degradation of a large set of cellular proteins including short-lived, regulatory, and misfolded/denatured proteins. Ubiquitin-mediated proteolysis employs covalent attachment of multiple ubiquitin molecules to the protein substrate, followed by degradation of the targeted protein by the 26S proteasome.Citation35 A role for this pathway in genome instability and DNA damage has been recently reported.Citation36 The full details of biological process and pathway enrichment are provided in Table S2.
Figure 2. Heterogeneous nuclear ribonucleoprotein H1 is a master controller in a feed-forward network of splicing regulation. hnRNP H1 identified targets and significantly enriched KEGG pathways and biological processes (corrected p < 0.01). Components of the most enriched pathway (the spliceosome) are shown in the center and highlighted in yellow.
Involvement of hnRNP H1 in mRNA stability and splicing
Encouraged by the enrichment of splicing and mRNA processing transcripts among our set of hnRNP H1 targets, we conducted RNA-Seq upon knockdown of hnRNP H1 in an effort to map changes in mRNA levels and splicing triggered by hnRNP H1. Of the 16,279 genes expressed in our samples (defined as those having at least 1 read in all wild-type replicates), 1,180 genes showed significant down-regulation, and 1,800 showed significant upregulation (fold-change threshold of 2x) upon hnRNP H1 silencing – almost 20% of the transcriptome. shows mRNAs with or without hnRNP H1 sites displaying changes in expression levels organized according to fold-change and significance. There is a trend toward downregulation in hnRNP H1 knockdown samples in both target and non-target sets (see ). We found that 120 genes identified as hnRNP H1 targets from the combined RIP-Seq and iCLIP analysis display changes in mRNA levels upon hnRNP H1 knockdown. We observed that changes in mRNAs containing hnRNP H1 sites were more significant than in those mRNAs that were not identified as targets (). The two identified miRNA targets of hnRNP H1 did not show a significant change in their expression. However, among lncRNA targets of hnRNP H1, we observed decreased expression of NEAT and increased expression of MIR22HG upon knockdown of hnRNP H1 (see Table S3).
Figure 3. Impact of hnRNP H1 on mRNA stability. (A) Log fold-change and corrected p-values for all genes with significant changes in mRNA levels, colored by whether they were identified as direct targets of hnRNP H1. (B) The proportion of mRNA-level changes that are up- or down-regulation for each decile of FDR scores. High confidence changes are preferentially found among genes displaying downregulation upon hnRNP H1 knockdown. The same trend is observed for direct and indirect targets. (C) Corrected p-values for up- and down-regulated genes (direct and indirect targets) upon hnRNP H1 knockdown; target genes showed more significant changes in both up- and down-regulation upon hnRNP H1 knockdown. Outliers removed for visualization only. (D) The genes showing significant differential expression upon H1 knockdown significantly overlap those genes that are differentially expressed when transcription is stalled (** p< 0.001, Wilcoxon rank sum test, *** p < 0.001, Fisher's exact test).
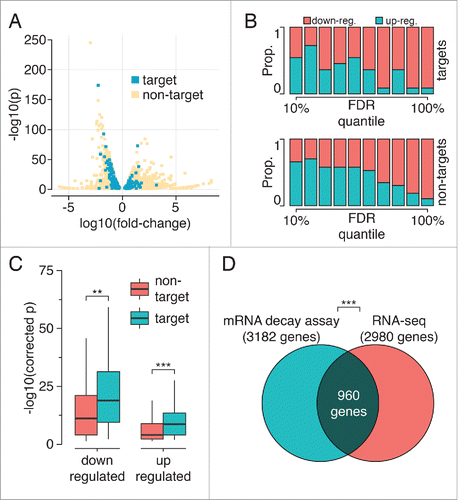
To further evaluate the impact of hnRNP H1 on mRNA decay, transcription was stalled in HeLa cells (control and hnRNP H1 knockdown) by using α-amanitin. RNA samples were obtained at time zero and 3 hours and analyzed by RNA-seq. Interestingly, analysis on the resulting data set showed a significant overlap between transcripts that display changes in expression upon hnRNP H1 knockdown and transcripts that show significant change in their decay rate after stalling transcription (). The full set of significant mRNA-level changes is provided in Table S3.
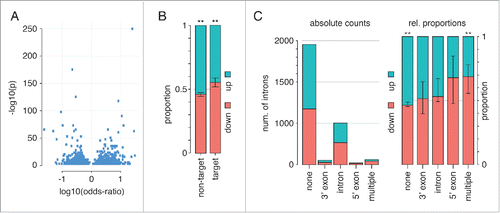
Significant changes in inclusion ratios for 1922 exons were observed upon hnRNP H1 knockdown, accounting for 1286 unique mRNAs (full list in Table S4). Of these, 201 transcripts contain hnRNP H1 sites according to the iCLIP and RIP-Seq data (approximately 15% of mRNAs with exon changes and 19% of targets; p < 3.23 × 10⁻³⁴, Fisher's exact test). Our results reinforce the direct involvement of H1 in the regulation of splicing. However, in addition to the RIP-Seq and iCLIP targets in which we observed splicing changes in our RNA-Seq data, the prevalence of a large number of splicing changes which lacked strong support for hnRNP H1 binding lead us to suggest that H1 also affects many down-stream splicing events. Previous results that suggested an even broader involvement of hnRNP H1 in direct splicing should be taken with some degree of caution as both less stringent approaches to target calling, and large window distances for correlating binding sites and changes in splicing were used.Citation2 shows the fold-change and significance of changes in exons with proximal hnRNP H1 sites and the ones that do not.
Figure 4. Impact of hnRNP H1 on RNA splicing. (A) Log fold-change and corrected p-values for all exons with significant changes in inclusion rates, colored by whether they were identified as targets of hnRNP H1. (B) The proportion of changes in exon-inclusion rate that are increases or decreases. Results are split by whether the exon is in a target of hnRNP H1 or not. (C) The proportions of exons, which show significant increased and decreased usage within hnRNP H1 targets that are in 3′ UTR, 5′ UTR or coding exons. (D) Frequency of hnRNP H1 iCLIP sites at exon/intron boundaries for exons showing up-regulation upon hnRNP H1 knockdown and those showing downregulation (E) Examples of increased exon inclusion and exclusion upon knockdown of hnRNPH1 respectively (from left to right). Highlighted are regions of strong RIP-Seq and iCLIP binding activity.
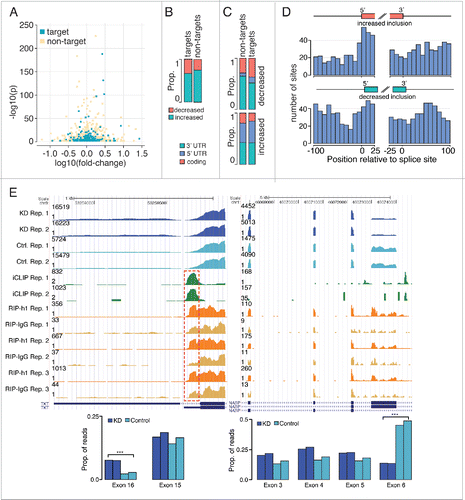
Previous studies have concentrated on cassette exons,Citation2 where hnRNP H1 was observed to primarily promote inclusion. Although we observe a greater proportion of exons showing increased usage upon hnRNP H1 knockdown (suggestive of skipping, see ), these changes are predominantly observed in 5′ UTR exons and 3′ UTR exons (). In contrast, exons with decreased usage upon hnRNP H1 silencing show a stronger preference toward being cassette exons. In general, we observe a greater tendency for exons showing increased usage on hnRNP H1 knockdown to be 5′ UTR exons than those showing decreased usage. Interestingly, we observed a change in exon inclusion within the lncRNA MIR22HG, with increased inclusion of a cassette exon and decreased inclusion of the transcript's first exon upon knockdown of hnRNP H1, suggesting hnRNP H1 may regulate splicing of this lncRNA. Moreover, we observed a change in splicing in the lncRNA SNHG4, with knockdown of hnRNP H1 promoting increased usage of the proximal final exon, suggesting that hnRNP H1 may promote splicing of the longer isoform of this RNA.
We also looked for the enrichment of hnRNP H1 iCLIP sites near the exon/intron boundaries of exons with changed inclusion rates. shows the frequency of iCLIP sites at the 3′ and 5′ splice-sites of differentially used exons. We observe an increased prevalence of exonic iCLIP sites proximal to the 5′ splice sites of exons that are up-regulated upon hnRNP H1 knockdown, while exons with decreased inclusion tended to exhibit more sites in the proximal 5′ intron. These findings are consistent with previous studies showing hnRNP H1 binding within exons represses splicing.Citation6
shows UCSC genome browser tracks of 2 splicing events regulated by hnRNP H1: an alternative final exon, and a cassette exon. The left panel shows the alternative (distal) final exon with significantly greater usage upon hnRNP H1 knockdown (p < 1.52 × 10−186, Fisher's exact test). A strong iCLIP site, at a locus which also shows enrichment in RIP-Seq, is nearby. The right panel shows the cassette exon with significantly reduced inclusion upon hnRNP H1 knockdown. Several significant iCLIP sites are within the exon and flanking introns, as well as several regions of RIP-Seq enrichment.
We identified significant changes in the number of RNA-Seq reads mapping to intronic regions of 2727 pre-mRNAs, which is approximately 1.4% of the introns defined in our reference. Evidence of both increased and decreased intron retention upon hnRNP H1 knockdown was observed with no strong preference toward either (see ). However, we noticed that introns with hnRNP H1 iCLIP sites present either in the intron or in flanking exons showed a small but significant tendency toward reduced inclusion upon hnRNP H1 knockdown, while those lacking iCLIP sites tended toward increased inclusion upon hnRNP H1 knockdown (). We further investigated whether the presence of iCLIP sites for hnRNP H1 correlated with particular changes in intron-retention in the RNA-Seq data. Introns with iCLIP sites only in the intron body, or 3′ flanking exon showed little preference toward either increased or decreased inclusions, while those with sites in the 5′ flanking exon or in more than one of the 3′ flanking exon, 5′ flanking exon and intronic body showed more marked preference toward decreased inclusion upon hnRNP H1 knockdown (). The complete set of significant intron retention events is provided in Table S6.
Figure 5. Impact of hnRNP H1 on intron retention. (A) Volcano plot showing the significance and strength of changes in intron levels for the 2727 introns with significant changes. There is little preference toward either down- or up- regulation on H1 knockdown. (B) The proportion of significantly changed exons that show increased inclusion versus decreased inclusion on hnRNP H1 knockdown based on whether they are putative iCLIP targets or not - here we consider an intron a putative target if it contains a significant iCLIP site in the intron body or either of the flaking exons. (C) The absolute number and relative proportions of exons showing up- or down-regulation on hnRNP H1 knockdown dependent on iCLIP target type. Those marked 3′ exon, 5′ exon or intron contain iCLIP sites only in those regions, while ‘multiple’ refers to exons with iCLIP sites in more than one of those regions.
Alternative polyadenylation
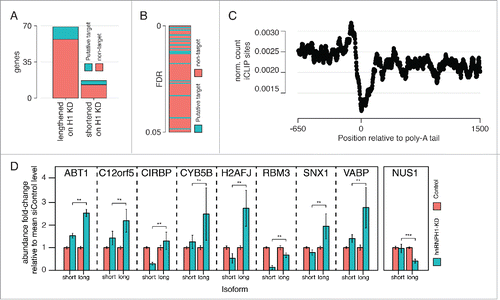
Next, we investigated the RNA-Seq data for changes in polyadenylation-site selection. We identified 86 mRNAs with significant changes, of which the majority (69 mRNAs) showed a shift to a more distal poly-A site upon hnRNP H1 knockdown (i.e., longer 3′ UTR), while the remainder (17 mRNAs) showed a shift to more proximal poly-A sites (i.e. shorter 3′ UTR). This bias might indicate hnRNP H1 promotes shorter transcripts, but this observation must be weighed against the greater statistical power for identifying changes in longer transcripts. Of the 86 changes, 16 mRNAs were identified by our RIP-Seq assay as hnRNP H1 targets, and contained significant iCLIP sites within the altered 3′UTR. Further, we noted that mRNAs displaying high-confidence changes preferentially contained hnRNP H1 iCLIP sites (), although the proportion of mRNAs with lengthened 3′UTRs that were identified as targets was not significantly different to the proportion with shortened 3′ UTRs (). In addition, we observed a preference for hnRNP H1 iCLIP sites to be enriched on the 5′ side of polyadenylation sites (). The complete list of changes is provided in Supplementary Table 5. Identified direct targets of hnRNP H1 were validated by qRT-PCR. We designed 2 probes per transcripts: one probe recognizes both the short and the long isoforms while the second one just recognizes the long isoform. As shown in the abundance fold-change relative to the control case is significantly different when hnRNP H1 is knocked down (p-value < 0.01, 2-way ANOVA). This result corroborates the involvement of hnRNP H1 in poly-A site selection.
Figure 6. Impact of hnRNP H1 on alternative polyadenylation. (A) The number of genes showing evidence of lengthened or shortened 3′ UTRs on hnRNP H1 knockdown and the proportion of each that have iCLIP sites in their 3′ UTR and were identified as RIP targets. (B) Changes in poly-adenylation sorted by confidence of change shows enrichment of putative targets in high-confidence changes. (C) Profile of normalized iCLIP site count around poly-A tail locations shows enrichment of binding in the proximal 5′ area. (D) qRT-PCR results, validating the effect of hnRNP H1 on the selection of poly-adenylation site for a set of predicted targets (**p < 0.01).
Interestingly, 2 mRNAs showing hnRNP H1-mediated alternative polyadenylation, CIRBP and RBM3, are also alternative polyadenylation regulators. iCLIP studies previously showed that mRNA targets of these 2 cold-induced proteins have enriched binding sites near polyadenylation sites and reduced expression of CIRBP and RBM3 resulted in shortened 3′UTRs.Citation37
Impact of hnRNP H1 on protein expression levels
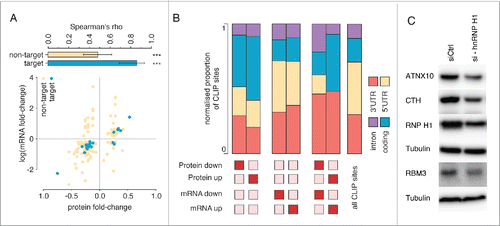
Lastly, we investigate global protein levels after hnRNP H1 knock-down by performing shotgun proteomic analysis. We reliably quantified 2,322 proteins across the 2 analyzed replicates (Table S7). Among them, 335 proteins with significant changes in abundance (FDR < 0.01, EdgeR) were identified. Of these, 181 decrease in protein concentration and 155 increase in concentration upon hnRNP H1 knockdown. Further, of the 335 proteins with significant changes, 148 (approx. 45%) also displayed significant changes at the mRNA-level as observed by RNA-Seq. Western blots were used to confirm changes detected by proteomics (). In the majority of these cases (114 of 148), changes in mRNA and protein levels are in the same direction. Of the transcripts showing changes in protein levels, 35 of the 335 transcripts (∼10%) displayed hnRNP H1 binding sites in their 3′UTRs. Even more so than non-target transcripts, we observed that these changes were in the same direction, with only 2 transcripts containing hnRNP H1 iCLIP sites and exhibiting changes in mRNA levels opposite to the trend in protein abundance (see ). This observation might be the result of a combined effect on mRNA stability and translation. We noted that mRNAs with significant changes in protein levels, but not in mRNA levels showed an enrichment of iCLIP sites in coding regions, while mRNAs with changes in both protein and mRNA levels exhibited an enrichment of iCLIP sites in 3′ UTRs ().
Figure 7. Changes in protein abundance upon hnRNP H1 knockdown. (A) Fold-change in mRNA levels vs. fold-change in protein concentrations for those transcripts where significant changes were detected in both data sets, stratified by whether the transcript was identified as a putative hnRNP H1 target or not. Shown above is Spearman's rank correlation coefficient for changes in putative targets and non-targets. Both correlations are significant (***p < 0.001), but stronger in the case of putative targets. Error-bars are at the 95% confidence interval. (B) Distribution of iCLIP sites within genes that show up- or downregulation of mRNA levels, protein levels, or both upon hnRNP H1 knockdown. (C) Decreased expression of ATNX10, CTH and RBM3 after hnRNP H1 knockdown as evaluated by immunoblotting. Each experiment was performed 3 times and tubulin was used as a loading control in each western analysis.
Conclusion
Our study corroborated the major role of hnRNP H1 in the regulation of splicing, and we showed this function is achieved through both direct and indirect mechanisms. Notably, this finding is the result of a multi-dimensional set of assays that characterized the splicing events which, in contrast to RNA-seq alone, can distinguish between direct and indirect changes and validate the functional outcome of RBP binding.
A characterization of the hnRNP H1 binding site is particularly important in the case of a protein such as hnRNP H1, which controls a large number of splicing events and has been implicated in a number of diseases, such as ALS,Citation12 cystic fibrosis,Citation10 leukemia Citation18 and glioma.Citation38 Future efforts to develop treatments targeting these diseases will rely on an understanding of the binding mechanisms of the protein. We have confirmed the strong presence of G-rich tracts around hnRNP H1 interactions sites. Most importantly, we have identified an enrichment of the TGGG tetramer, a site that has been shown to attract hnRNP H1 binding in isolated splicing examples previously, but has not previously been described in high-throughput studies. Our analysis establishes the TGGG tetramer as a very common primary sequence motif at hnRNP H1 interaction sites. We also showed that hnRNP H1 has preference for single-stranded RNA.
Our data also supports roles for hnRNP H1 in mRNA decay and polyadenylation. Although the number of targets for which we generated direct evidence is modest, they indicate that hnRNP H1 has a secondary, but important role in these 2 processes. On the other hand, we observed substantial changes in mRNA and protein levels upon knockdown of hnRNP H1, more likely to have transcripts harboring hnRNP H1 binding sites. These results were later corroborated by an RNA decay assay. Based on the enrichment of hnRNP H1 binding sites around poly-A sites, and the high proportion of changes in alternative polyadenylation we observed in our RNA-Seq data, we conclude that hnRNP H1 in addition to regulating other regulators of polyadenylation does indeed play a direct role in regulating alternative polyadenylation.
Studies that link hnRNP H1 to tumorigenesis explain its role as an oncogenic factor via its impact on a small number of targets.Citation14,15,39 Our analysis suggests a more elaborate scenario where hnRNP H1 regulates RNA operons located in the MAPK and ubiquitin mediated proteolysis pathways. However, this observation needs to be further investigated in the context of tumor models.
Material and methods
Cell culture
HeLa cells were maintained in RPMI with 10% FBS and 1% PS. Cells were reverse transfected using 50 nM hnRNP H1 SmartPool or 50 nM siRNA Control SmartPool (Dharmacon) with RNAiMAX (Invitrogen) per manufacturer suggestion. After 48 hours, cells were collected for RNA extraction (RNA-Seq analysis) or cytosolic protein and nuclear fractionation (Proteomics analysis).
RNA-Seq
Total RNA from HeLa hnRNP H1 knockdown and control cells was purified using Invitrogen PureLink mini kit. Libraries were prepared using the Illumina TruSeq RNA Sample Prep Kit per protocol. Samples were sequenced on Illumina HiSeq 2000.
iCLIP
HeLa cells for iCLIP experiments were grown in 10 cm dishes, washed with cold PBS and irradiated in 6 mL PBS on ice at 150 mJ/cm2 and 254 nm. Cells were scraped, transferred to microtubes and spun top speed for 10 seconds at 4°C. Pellets were snap frozen in dry ice. Following the protocol in,Citation40 HeLa cells were irradiated with UV and treated with low and high concentrations of RNase I. Then, cross-linked endogenous hnRNP H1-RNA complexes were immunoprecipitated using anti-hnRNP H1 antibodies and radiolabeled them in vitro with T4 polynucleotide kinase. Normal rabbit IgG was used as negative control. Immunoprecipitated hnRNP H1-RNA complexes were separated on SDS–PAGE and transferred onto nitrocellulose membranes. An autoradiogram of the equivalent gel shows the radiolabeled complexes (). Rabbit polyclonal against hnRNP H1 (abcam ab10374) was used in immunoprecipitations. Samples were sequenced on an Illumina GAIIx.
RIP-Seq
RIP-Seq experiments were performed according to the protocol described in.Citation26 Rabbit anti hnRNP H1 from Abcam (ab10374) and normal rabbit IgG from R&D were used in immuno-precipitations.
Preparation of lysates for proteomics analysis
Cytosolic and nuclear proteins from control and hnRNP H1 knockdown samples were extracted from ∼6 × 10⁶ cells. Cells were lysed with 400 μl lysis buffer (with 4 μl 50 mM DTT and 1x Roche (Nutley, NJ) Protease inhibitor), incubated on ice for 5 minutes and dounce homogenized with 25 strokes. Lysate was transferred to 1.5 ml tube and spun at 1, 000 g for 5 minutes at 4°C. Supernatant containing cytosolic proteins was collected. Nuclear pellet was resuspended in 1 ml of S1 buffer (0.25 M sucrose, 10 mM MgCL2). Resuspended sample was carefully laid on top of S3 buffer (0.88 M Sucrose, 0.5 mM MgCl2). Material was centrifuged at 3, 000 g for 10 min at 4°C. The supernatant was carefully separated from pellet and discarded. Intact nuclei were collected from the bottom of the tube. Pellet was resuspended in 500 μl lysis buffer and transfered to 1.5 ml tube and centrifuged at 3, 000 g for 5 min at 4°C; supernatant was discarded; pellet was frozen to be stored for mass spectrometric analysis.
Shotgun proteomics
From each sample, 50 μl of diluted cell lysate (at 2 mg/ml; diluted with 50 mM Tris-HCl buffer) was incubated at 55°C for 45 min with 50 μl of trifluoroethanol (TFE) and 15 mM dithiothreitol (DTT), then incubated with 55 mM iodoacetamide (IAM) in the dark for 30 min. After diluting the sample to 1 ml with buffer (50 mM TrisHCl, pH 8.0), 1:50 w/w trypsin was added for a 4.5-hour digestion at 37°C (halted by adding 20 μl of formic acid, resulting in 2% v/v). The sample was lyophilized, resuspended with buffer C (95% H2O, 5% acetonitrile, 0.01% formic acid), and cleaned with C18 tips (Thermo Fisher). The eluted sample was again lyophilized, resuspended with 120 μl buffer C, and filtered through a Microcon-10 filter (for 45 min at 14, 000 g at 4°C). Each sample was injected 5 times into an LTQ-Orbitrap Velos mass spectrometer (Thermo Electron), and data were collected in a 0 to 90% acetonitrile gradient over 5 hours. Nanoflow peptide separation was performed on an Eksigent HPLC using 400 ul/min flow and a reverse phase column (Zorbax BioBasic-18 column 150 mm × 0.10 mm ID (Agilent)). The set of raw files was analyzed with the MaxQuant software Citation41 using standard settings and the human genome ENSEMBL version 49.46. The sequence database was made non-redundant with respect to splice variants, by accepting the longest sequence as the representative one. Cytosolic and nuclear fractions were combined during the MaxQuant run. Proteins with an identification FDR < 0.01 were considered confidently identified and used for further analysis. Using total spectral counts and the qSPEC software,Citation42 we analyzed the data for differential protein expression. The mass spectrometry proteomics data have been deposited to the ProteomeXchange Consortium (http://www.proteomexchange.org) via the PRIDE partner repository Citation43 with the dataset identifier PXD000895. The processed protein sequence files are provided in Supplementary file 7.
Immunoblotting
Proteins were extracted by washing the cells with PBS and lysis in Laemmli buffer (62.5 mM Tris–HCl, pH 6.8, 10% glycerol, 2% SDS, 5% β-mercaptoethanol, 0.1% bromophenol blue). The Bradford method was used to measure protein concentration. Total protein (50 μg) was denatured at 95°C for 5 min, separated on SDS–PAGE, and transferred onto nitrocellulose membranes (GE Healthcare Life Sciences, Piscataway, NJ). After blocking in Tris-buffered saline/0.1% Tween (TBST)/5% milk, membranes were incubated with primary antibodies in blocking buffer (overnight at 4°C). hnRNP H1, ATXN10, CTH and RBM3 were detected with rabbit polyclonal antibodies: anti-hnRNP H1 (Abcam, ab10374, 1:1000), anti-ATXN10 (GeneTex, GTX105440, 1:1000), anti-CTH (GeneTex, GTX113409, 1:1000) and anti-RBM3 (Biorbyt, orb37889, 1:1000). Alpha-tubulin was detected with mouse monoclonal antibody (Sigma-Aldrich, 1:4000). After washing 3 times in washing buffer (TBST), membranes were incubated for 1 h at room temperature with a peroxidase-conjugated goat anti-mouse (Zymed Laboratories, 1:8000) or anti-rabbit antibody (Santa Cruz Biotechnology, 1:5000). Membranes were washed 3 times in washing buffer, and chemiluminescence detection was performed using Immobilon Western Chemiluminescent HRP Substrate (EMD Millipore) according to manufacturer's instructions.
mRNA decay assay
HeLa cells were transfected with hnRNP H1 or control siRNAs as described above. After 48 hours, cells were treated with 50 ug/mL of α-amanitin (Sigma). RNA was extracted from cells α-amanitin-tretated after 3 hours. RNA samples were treated with DNaseI (Qiagen), followed by column RNA clean up (Qiagen). Samples were quantitated by bioanalyzer method, then sequenced on an Illumina GAIIx instrument for 36 cycles.
Computational methods
Reads were mapped to hg19 using RMAP.Citation44 We used a modified version of RefSeq for read counting where we collapsed isoforms to produce a single super-transcript for each gene. We then counted the number of reads in each one of these super-transcripts, and differential expression was determined from these counts using EdgeR.Citation45 The same was done with exon-level counts to determine changed inclusion ratios, where Fisher's exact test was used to determine the significance of the change in odds-ratio. Significant interaction sites were identified from RIP-Seq and iCLIP data using Piranha.Citation26 Gene ontology and pathway analysis was undertaken using DAVID.Citation32 Sequence data has been deposited in SRA; accession numbers are SRA097978 (iCLIP) SRA097979 (RIP-Seq) and SRA097980 (RNA-Seq). Full computational details are provided in supplementary methods.
Disclosure of potential conflicts of interest
No potential conflicts of interest were disclosed.
Author Contributions
CV, MQ, SCB and PRA performed the experiments. PJU, EBS and ADS performed statistical analysis and analyzed the data. PJU, EBS and LOFP prepared the manuscript. All authors read and approved the final manuscript.
Supplemental_Tables 1-7 and information.zip
Download Zip (2.8 MB)Acknowledgments
This work was supported by NIH grant R01HG006015 (LOFP and ADS). CV acknowledges support by the NYU Whitehead Scholarship and by the NIH grant 5R01GM113237. CPRIT Training Grant - RP140105 supported PRA. The authors would like to thanks Jeremy Sanford for critical suggestions.
References
- Gerstberger S, Hafner M, Tuschl T. A census of human RNA-binding proteins. Nature reviews Genetics 2014; 15(12):829-845; PMID:25365966; http://dx.doi.org/10.1038/nrg3813
- Huelga SC, Vu AQ, Arnold JD, Liang TY, Liu PP, Yan BY, Donohue JP, Shiue L, Hoon S, Brenner S, et al. Integrative genome-wide analysis reveals cooperative regulation of alternative splicing by hnrnp proteins. Cell Rep 2012; 1(2):167-178; PMID:22574288; http://dx.doi.org/10.1016/j.celrep.2012.02.001
- Han S, Tang Y, Smith R. Functional diversity of the hnRNPs: past, present and perspectives. Biochem J 2010; 430:379-392; PMID:20795951; http://dx.doi.org/10.1042/BJ20100396
- Busch A, Hertel KJ. Evolution of SR protein and hnRNP splicing regulatory factors. Wiley Interdiscipl Rev: RNA 2012; 3(1):1-12; PMID:21898828; http://dx.doi.org/10.1002/wrna.100
- Bent H, Hanne HR, Henrik V, Kurt D, Xiangdang L, Pavel G, Peder M, Borbala G, Niels T, Julio EC. Heterogeneous nuclear ribonucleoproteins H, H', and F are members of a ubiquitously expressed subfamily of related but distinct proteins encoded by genes mapping to different chromosomes. J Biol Chem 1995; 270(48):28780-28789; PMID: 7499401; http://dx.doi.org/10.1074/jbc.270.48.28780
- Katz Y, Wang ET, Airoldi EM, Burge CB, Analysis and design of RNA sequencing experiments for identifying isoform regulation. Nat Meth 2010; 7(12):1009-1015; PMID:21057496; http://dx.doi.org/10.1038/nmeth.1528
- Matunis MJ, Xing J, Dreyfuss G. The hnRNP F protein: unique primary structure, nucleic acid-binding properties, and subcellular localization. Nucl Acids Res 1994; 22(6):1059-1067; PMID:7512260; http://dx.doi.org/10.1093/nar/22.6.1059
- Wang E, Aslanzadeh V, Papa F, Zhu H, de la Grange P, Cambi F. Global profiling of alternative splicing events and gene expression regulated by hnRNPH/F. PloS One 2012; 7(12):e51266; PMID:23284676; http://dx.doi.org/10.1371/journal.pone.0051266
- Volk N, Shomron N. Versatility of MicroRNA biogenesis. PloS One 2011; 6(5):e19391; PMID:21572999; http://dx.doi.org/10.1371/journal.pone.0019391
- Pagani F, Buratti E, Stuani C, Baralle FE. Missense, nonsense, and neutral mutations define juxtaposed regulatory elements of splicing in cystic fibrosis transmembrane regulator exon 9. J Biol Chem 2003; 278(29):26580-26588; PMID:12732620; http://dx.doi.org/10.1074/jbc.M212813200
- Masuda A, Shen XM, Ito M, Matsuura T, Engel AG, Ohno K. hnRNP H enhances skipping of a nonfunctional exon P3A in CHRNA1 and a mutation disrupting its binding causes congenital myasthenic syndrome. Hum Mol Gen 2008; 17(24):4022-4035; PMID:18806275; http://dx.doi.org/10.1093/hmg/ddn305
- Prudencio M, Belzil VV, Batra R, Ross CA, Gendron TF, Pregent LJ, Murray ME, Overstreet KK, Piazza-Johnston AE, Desaro P, et al., Distinct brain transcriptome profiles in C9orf72-associated and sporadic ALS. Nat Neurosci 2015; 18(8):1175-1182; PMID:26192745; http://dx.doi.org/10.1038/nn.4065
- Chettouh, H., Fartoux L, Aoudjehane L, Wendum D, Clapéron A, Chrétien Y, Rey C, Scatton O, Soubrane O, Conti F, et al., Mitogenic insulin receptor-A is overexpressed in human hepatocellular carcinoma due to EGFR-mediated dysregulation of RNA splicing factors. Cancer Res 2013; 73(13):3974-3986; PMID:23633480; http://dx.doi.org/10.1158/0008-5472.CAN-12-3824
- Rauch J, O'Neill E, Mack B, Matthias C, Munz M, Kolch W, Gires O. Heterogeneous nuclear ribonucleoprotein H blocks MST2-mediated apoptosis in cancer cells by regulating A-Raf transcription. Cancer Res 2010; 70(4):1679-1688; PMID:20145135; http://dx.doi.org/10.1158/0008-5472.CAN-09-2740
- LeFave CV, Squatrito M, Vorlova S, Rocco GL, Brennan CW, Holland EC, Pan YX, Cartegni L. Splicing factor hnRNPH drives an oncogenic splicing switch in gliomas. EMBO J 2011; 30(19):4084-4097; PMID:21915099; http://dx.doi.org/10.1038/emboj.2011.259
- Russo A, Siciliano G, Catillo M, Giangrande C, Amoresano A, Pucci P, Pietropaolo C, Russo G. hnRNP H1 and intronic G runs in the splicing control of the human rpL3 gene. Biochim Biophys Acta 2010; 1799(5):419-428; PMID:20100605; http://dx.doi.org/10.1016/j.bbagrm.2010.01.008
- Turunen JJ, Verma B, Nyman TA, Frilander MJ. HnRNPH1/H2, U1 snRNP, and U11 snRNP cooperate to regulate the stability of the U11-48K pre-mRNA. RNA 2013; 19(3):380-389; PMID:23335637; http://dx.doi.org/10.1261/rna.036715.112
- Stark M, Bram EE, Akerman M, Mandel-Gutfreund Y, Assaraf YG. Heterogeneous nuclear ribonucleoprotein H1/H2-dependent unsplicing of thymidine phosphorylase results in anticancer drug resistance. J Biol Chem 2011; 286(5):3741-3754; PMID:21068389; http://dx.doi.org/10.1074/jbc.M110.163444
- Tenenbaum SA, Carson CC, Lager PJ, Keene JD. Identifying mRNA subsets in messenger ribonucleoprotein complexes by using cDNA arrays. Proc Natl Acad Sci 2000; 97(26):14085-14090; PMID:11121017; http://dx.doi.org/10.1073/pnas.97.26.14085
- Ule J, Jensen KB, Ruggiu M, Mele A, Ule A, Darnell RB. CLIP identifies Nova-regulated RNA networks in the brain. Science 2003; 302(5648):1212-1215; PMID:14615540; http://dx.doi.org/10.1126/science.1090095
- Ray D, Kazan H, Chan ET, Peña Castillo L, Chaudhry S, Talukder S, Blencowe BJ, Morris Q, Hughes TR. Rapid and systematic analysis of the RNA recognition specificities of RNA-binding proteins. Nat Biotechnol 2009; 27(7):667-670; PMID:19561594; http://dx.doi.org/10.1038/nbt.1550
- Morris AR, Mukherjee N, Keene JD. Systematic analysis of post-transcriptional gene expression. Wiley Interdiscipl Rev 2010; 2(2):162-180; PMID:20836020; http://dx.doi.org/10.1002/wsbm.54
- Ray D, Kazan H, Cook KB, Weirauch MT, Najafabadi HS, Li X, Gueroussov S, Albu M, Zheng H, Yang A, et al., A compendium of RNA-binding motifs for decoding gene regulation. Nature 2013; 499(7457):172-177; PMID:23846655; http://dx.doi.org/10.1038/nature12311
- Bahrami-Samani E, Vo DT, de Araujo PR, Vogel C, Smith AD, Penalva LO, Uren PJ. Computational challenges, tools, and resources for analyzing co‐and post‐transcriptional events in high throughput. Wiley Interdiscipl Rev 2015; 6(3):291-310; PMID:25515586; http://dx.doi.org/10.1002/wrna.1274
- Kuersten S, Radek A, Vogel C, Penalva LO. Translation regulation gets its ‘omics’ moment. Wiley Interdisciplinary Reviews: RNA, 2013; 4(6):617-630; PMID:23677826; http://dx.doi.org/10.1002/wrna.1173
- Uren PJ, Bahrami-Samani E, Burns SC, Qiao M, Karginov FV, Hodges E, Hannon GJ, Sanford JR, Penalva LO, Smith AD. Site identification in high-throughput RNA-protein interaction data. Bioinformatics 2012; 28(23):3013-3020; PMID:23024010; http://dx.doi.org/10.1093/bioinformatics/bts569
- Mukherjee N, Corcoran DL, Nusbaum JD, Reid DW, Georgiev S, Hafner M, Ascano M Jr, Tuschl T, Ohler U, Keene JD. Integrative regulatory mapping indicates that the RNA-binding protein HuR couples pre-mRNA processing and mRNA stability. Mol Cell 2011; 43(3):327-339; PMID:21723170; http://dx.doi.org/10.1016/j.molcel.2011.06.007
- Sugimoto Y, König J, Hussain S, Zupan B, Curk T, Frye M, Ule J. Analysis of CLIP and iCLIP methods for nucleotide-resolution studies of protein-RNA interactions. Gen Biol 2012; 13(8):R67; PMID:22863408; http://dx.doi.org/10.1186/gb-2012-13-8-r67
- Bahrami-Samani E, Penalva LO, Smith AD, Uren PJ. Leveraging cross-link modification events in CLIP-seq for motif discovery. Nucl Acids Res 2015; 43(1):95-103; PMID:25505146; http://dx.doi.org/10.1093/nar/gku1288
- Reyes-Herrera P, Speck-Hernandez CA, Sierra CA, Herrera S. BackCLIP: a tool to identify common background presence in PAR-CLIP datasets. Bioinformatics 2015; 31(22):3703-5, p. btv442; PMID:26227145; http://dx.doi.org/10.1093/bioinformatics/btv442
- Lunde BM, Moore C, Varani G. RNA-binding proteins: modular design for efficient function. Nat Rev Mol Cell Biol 2007; 8(6):479-490; PMID:17473849; http://dx.doi.org/10.1038/nrm2178
- Huang DW, Sherman BT, Lempicki RA. Systematic and integrative analysis of large gene lists using DAVID bioinformatics resources. Nat Prot 2008; 4(1):44-57; PMID:19131956; http://dx.doi.org/10.1038/nprot.2008.211
- Mercado PA, Ayala YM, Romano M, Buratti E, Baralle FE. Depletion of TDP 43 overrides the need for exonic and intronic splicing enhancers in the human apoA-II gene. Nucl Acids Res 2005; 33(18):6000-6010; PMID:16254078; http://dx.doi.org/10.1093/nar/gki897
- Santarpia L, Lippman SM, El-Naggar AK. Targeting the MAPK-RAS-RAF signaling pathway in cancer therapy. Exp Opi Therapeut Tar 2012; 16(1):103-119; PMID:22239440; http://dx.doi.org/10.1517/14728222.2011.645805
- Schwartz AL, Ciechanover A. Targeting proteins for destruction by the ubiquitin system: implications for human pathobiology. Ann Rev Pharmacol Toxicol 2009; 49:73-96; PMID:18834306; http://dx.doi.org/10.1146/annurev.pharmtox.051208.165340
- D'Angiolella V, Esencay M, Pagano M. A cyclin without cyclin-dependent kinases: cyclin F controls genome stability through ubiquitin-mediated proteolysis. Trend Cell Biol 2012; PMID:23182110
- Liu Y, Hu W, Murakawa Y, Yin J, Wang G, Landthaler M, Yan J. Cold-induced RNA-binding proteins regulate circadian gene expression by controlling alternative polyadenylation. Sci Rep 2013; 3:2054; PMID:23792593
- LeFave CV, Squatrito M, Vorlova S, Rocco GL, Brennan CW, Holland EC, Pan YX, Cartegni L. Splicing factor hnRNPH drives an oncogenic splicing switch in gliomas. EMBO J 2011; 30(19):4084-4097; PMID:21915099; http://dx.doi.org/10.1038/emboj.2011.259
- Mauger DM, Lin C, Garcia-Blanco MA. hnRNP H and hnRNP F complex with Fox2 to silence fibroblast growth factor receptor 2 exon IIIc. Mol Cell Biol 2008; 28(17):5403-5419; PMID:18573884; http://dx.doi.org/10.1128/MCB.00739-08
- Konig J, Zarnack K, Rot G, Curk T, Kayikci M, Zupan B, Turner DJ, Luscombe NM, Ule J. iCLIP reveals the function of hnRNP particles in splicing at individual nucleotide resolution. Nat Struct Mol Biol 2010; 17(7):909-915; PMID:20601959; http://dx.doi.org/10.1038/nsmb.1838
- Cox J, Neuhauser N, Michalski A, Scheltema RA, Olsen JV, Mann M. Andromeda: A peptide search engine integrated into the MaxQuant environment. J Prot Res 2011; 10(4):1794-1805; PMID:21254760; http://dx.doi.org/10.1021/pr101065j
- Choi H, Fermin D, Nesvizhskii AI. Significance Analysis of Spectral Count Data in Label-free Shotgun Proteomics. Mol Cell Prot 2008; 7(12):2373-2385; PMID:18644780; http://dx.doi.org/10.1074/mcp.M800203-MCP200
- Vizcaíno JA, Côté RG, Csordas A, Dianes JA, Fabregat A, Foster JM, Griss J, Alpi E, Birim M, Contell J, et al., The PRoteomics IDEntifications (PRIDE) database and associated tools: status in 2013. Nucl Acids Res 2013; 41(D1):D1063-69; PMID:23203882; http://dx.doi.org/10.1093/nar/gks1262
- Smith AD, Chung WY, Hodges E, Kendall J, Hannon G, Hicks J, Xuan Z, Zhang MQ. Updates to the RMAP short-read mapping software. Bioinformatics 2009; 25(21):2841-2842; PMID:19736251; http://dx.doi.org/10.1093/bioinformatics/btp533
- Robinson M, et al., edgeR: differential expression analysis of digital gene expression data User's Guide. 2011.